| Param | Original file | Final file |
|---|---|---|
| Filename | modeM0/AS1A14_099T04_9000006540_55770cztM0_level2.fits | modeM0/AS1A14_099T04_9000006540_55770cztM0_level2_quad_clean.evt |
| Size (bytes) | 645,831,360 | 97,614,720 |
| Size | 615.9 MB | 93.1 MB |
| Events in quadrant A | 8,208,593 | 548,480 |
| Events in quadrant B | 3,651,598 | 716,924 |
| Events in quadrant C | 4,370,964 | 639,800 |
| Events in quadrant D | 7,113,358 | 545,223 |
| Mode M0 | |||
|---|---|---|---|
| Quadrant | BADHDUFLAG | Total packets | Discarded packets |
| A | 0 | 29294 | 0 |
| B | 0 | 16116 | 0 |
| C | 0 | 18389 | 0 |
| D | 0 | 26231 | 0 |
| Mode SS | |||
|---|---|---|---|
| Quadrant | BADHDUFLAG | Total packets | Discarded packets |
| A | 0 | 146 | 0 |
| B | 0 | 146 | 0 |
| C | 0 | 146 | 0 |
| D | 0 | 146 | 0 |
| Quadrant | Total seconds | Saturated seconds | Saturation percentage |
|---|---|---|---|
| A | 7250 | 1499 | 20.675862% |
| B | 7250 | 67 | 0.924138% |
| C | 7251 | 192 | 2.647911% |
| D | 7251 | 927 | 12.784444% |
Noise dominated data is calculated using 1-second bins in cleaned event files. If a bin has >2000 counts, and if more than 50% of those come from <1% of pixels, then it is considered to be noise-dominated and hence unusable.
| Quadrant | # 1 sec bins | Bins with >0 counts | Bins with >2000 counts | High rate bins dominated by noise | Noise dominated (total time) | Noise dominated (detector-on time) | Marked lightcurve |
|---|---|---|---|---|---|---|---|
| A | 7250 | 7250 | 1371 | 1371 | 18.91% | 18.91% | 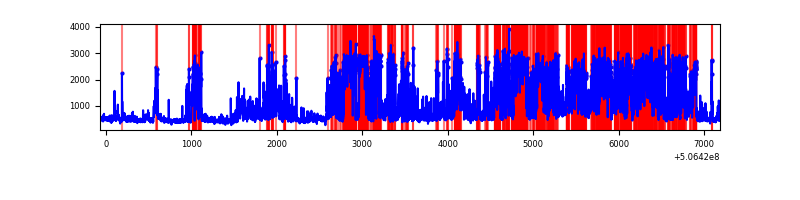 |
| B | 7250 | 7250 | 38 | 38 | 0.52% | 0.52% | 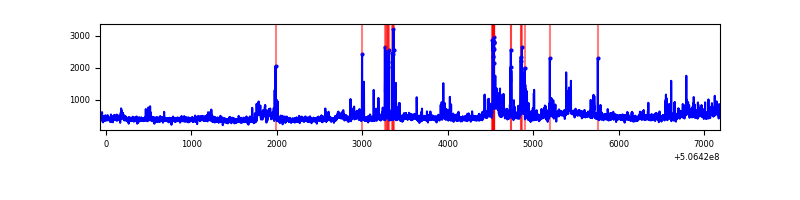 |
| C | 7251 | 7251 | 162 | 162 | 2.23% | 2.23% | 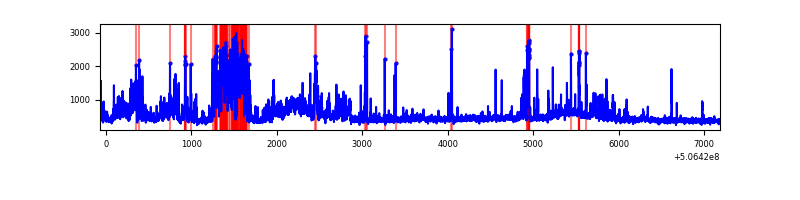 |
| D | 7251 | 7251 | 963 | 963 | 13.28% | 13.28% | 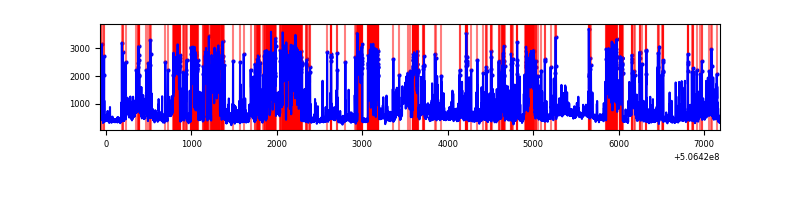 |
Top three noisy pixels from each quadrant. If the there are fewer than three noisy pixels in the level2.evt file, extra rows are filled as -1
| Pixel properties | Quadrant properties | ||||||
|---|---|---|---|---|---|---|---|
| Quadrant | DetID | PixID | Counts | Sigma | Mean | Median | Sigma |
| A | 7 | 64 | 3455597 | 20035.96 | 693 | 677 | 172.4 |
| A | 15 | 32 | 1387695 | 8043.67 | 693 | 677 | 172.4 |
| A | 8 | 192 | 263516 | 1524.27 | 693 | 677 | 172.4 |
| B | 7 | 0 | 324156 | 2022.19 | 741 | 715 | 159.9 |
| B | 5 | 172 | 179672 | 1118.86 | 741 | 715 | 159.9 |
| B | 0 | 199 | 70313 | 435.14 | 741 | 715 | 159.9 |
| C | 9 | 38 | 1229894 | 6150.34 | 728 | 719 | 199.9 |
| C | 12 | 250 | 91339 | 453.43 | 728 | 719 | 199.9 |
| C | 10 | 22 | 78090 | 387.14 | 728 | 719 | 199.9 |
| D | 11 | 129 | 3144436 | 16025.45 | 693 | 662 | 196.2 |
| D | 7 | 70 | 855795 | 4359.06 | 693 | 662 | 196.2 |
| D | 8 | 240 | 167742 | 851.69 | 693 | 662 | 196.2 |
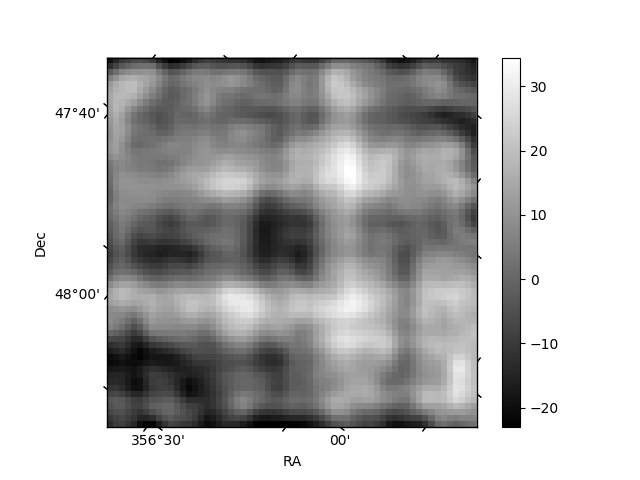
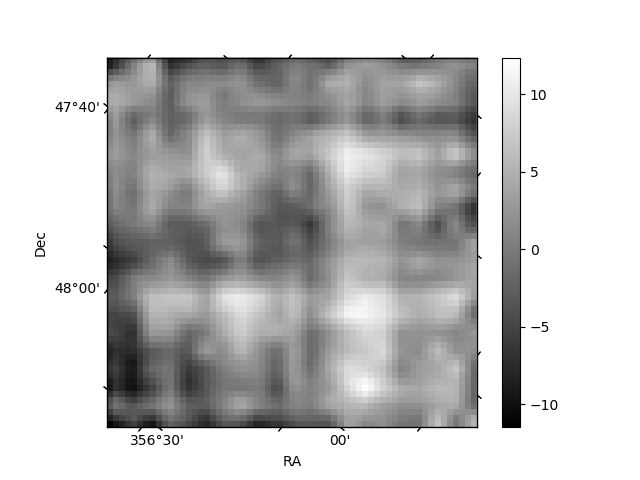
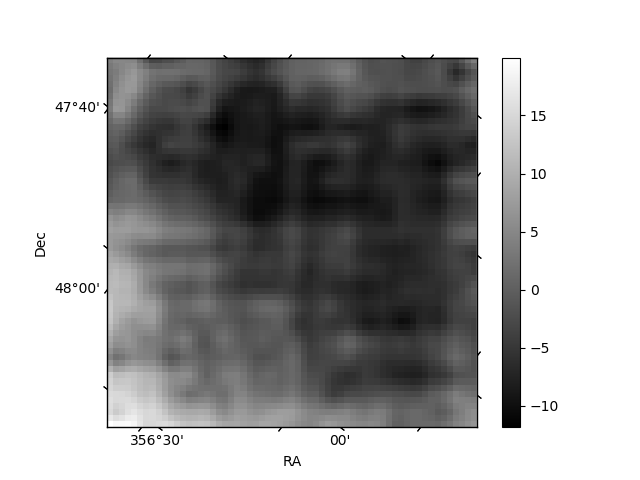
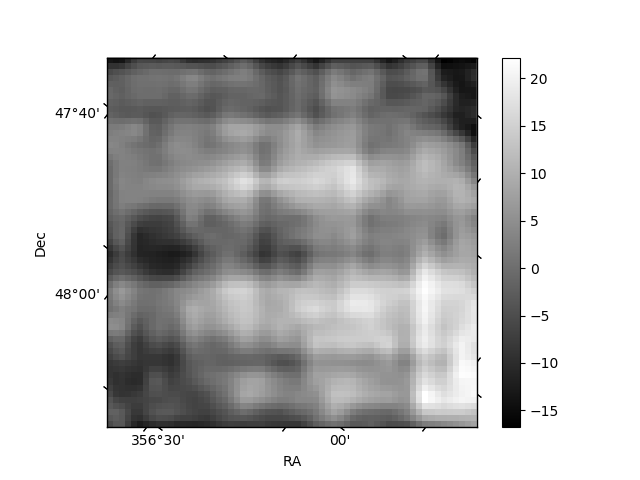
Histogram calculated using DETX and DETY for each event in the final _common_clean file
| Quadrant A | 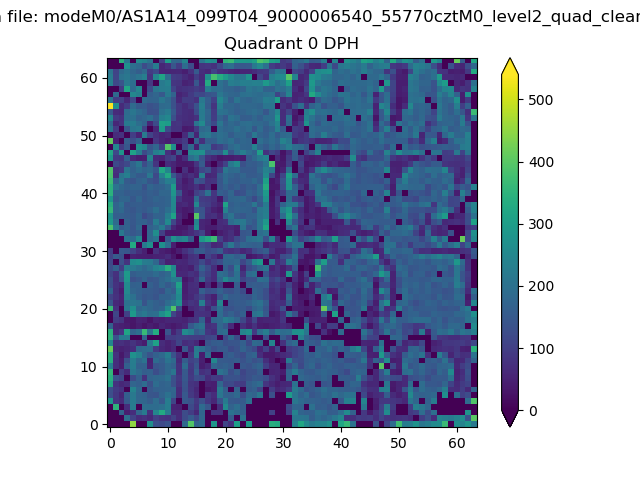 |
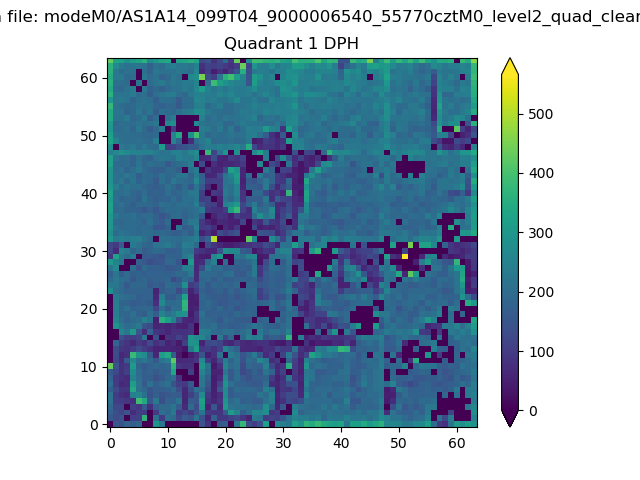 |
Quadrant B |
|---|---|---|---|
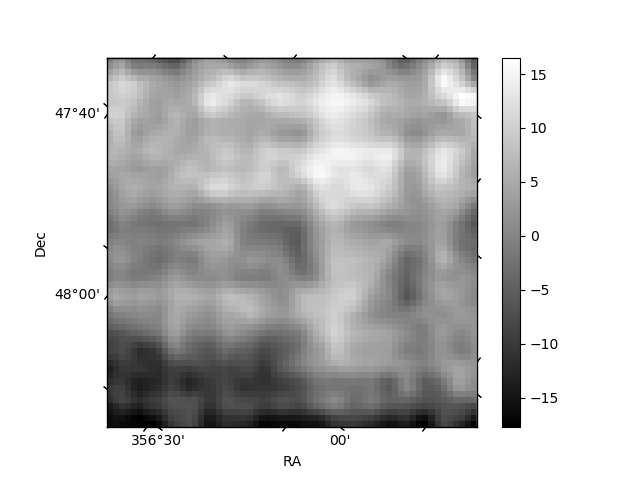
| Quadrant D | 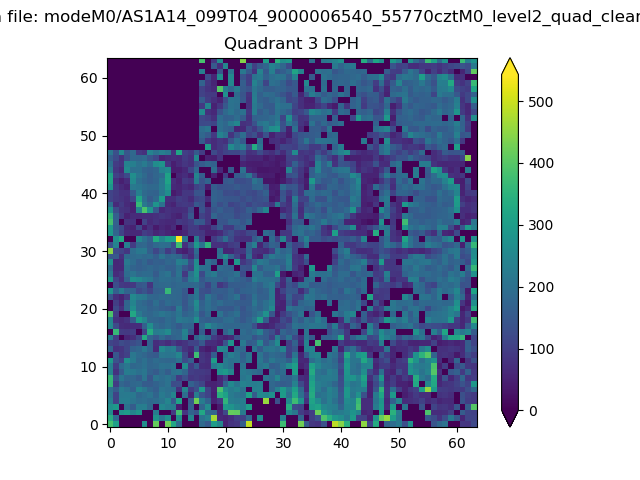 |
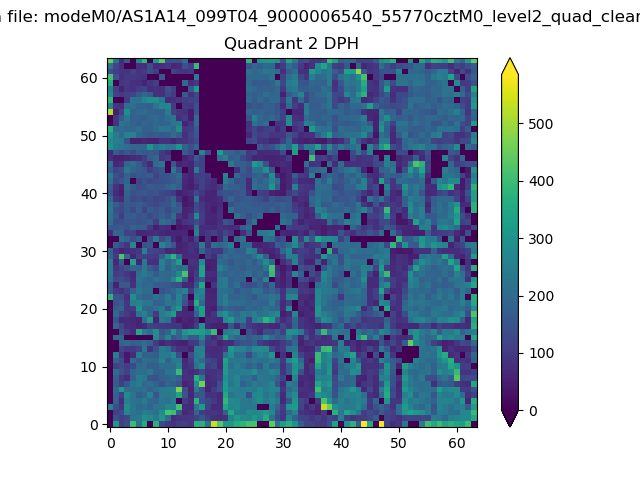 |
Quadrant C |
| Plot type | Count rate plots | Images |
|---|---|---|
| Comparison with Poisson distribution Blue bars denote a histogram of data divided into 1 sec bins. Red curve is a Poisson curve with rate = median count rate of data. |
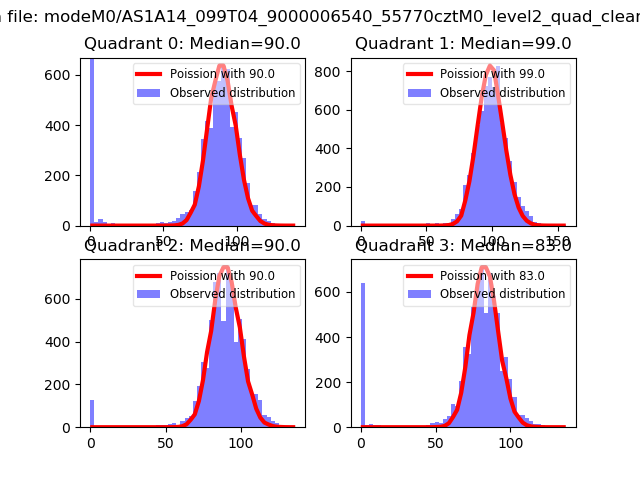 |
 |
| Quadrant-wise count rates Data is divided into 100 sec bins |
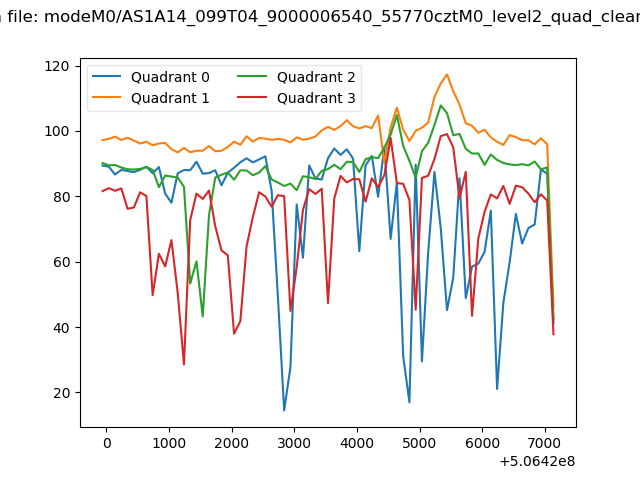 |
|
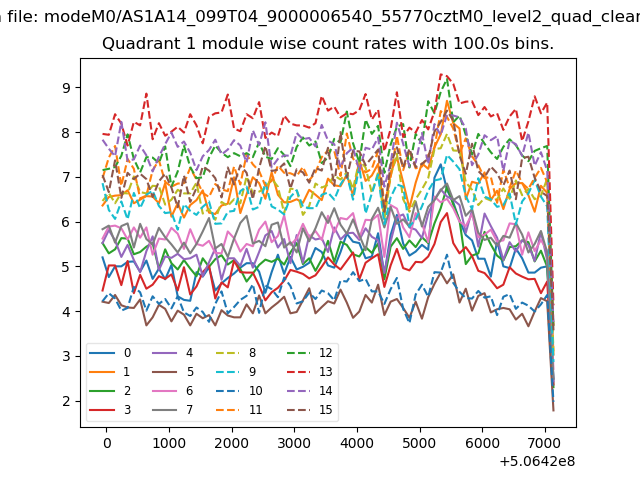
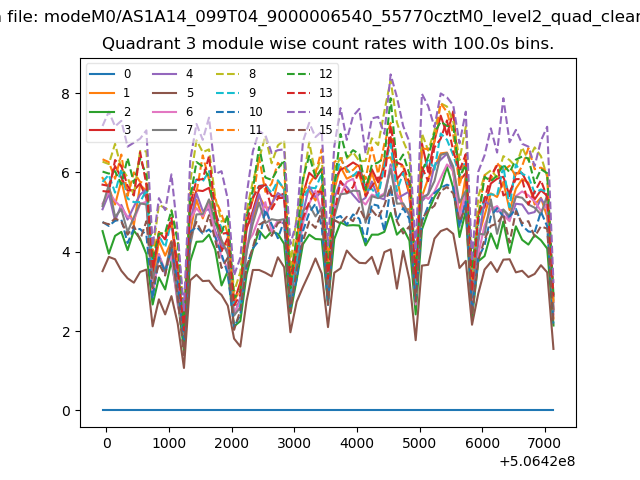
| Module-wise count rates for Quadrant A Data is divided into 100 sec bins |
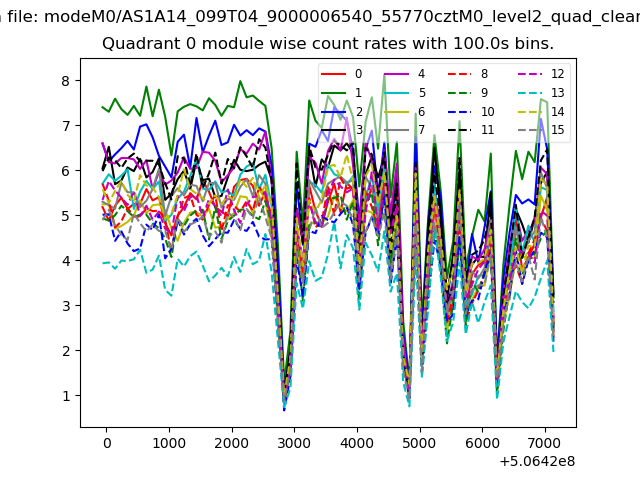 |
 |
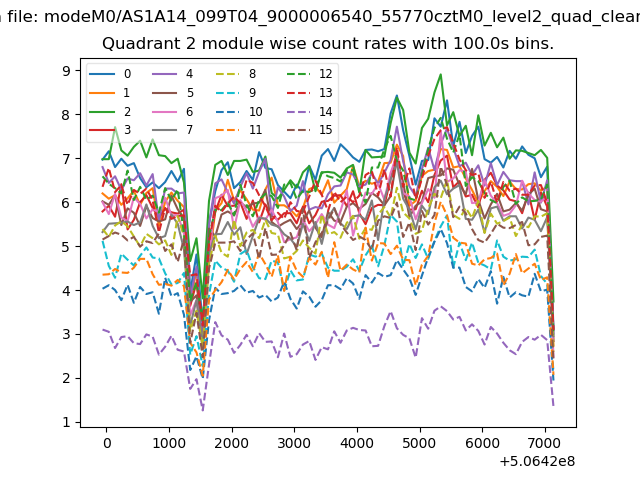
| Module-wise count rates for Quadrant B Data is divided into 100 sec bins |
 |
 |
| Module-wise count rates for Quadrant C Data is divided into 100 sec bins |
 |
 |
| Module-wise count rates for Quadrant D Data is divided into 100 sec bins |
 |
 |
| Parameter | Plot |
|---|---|
| CZT HV Monitor | 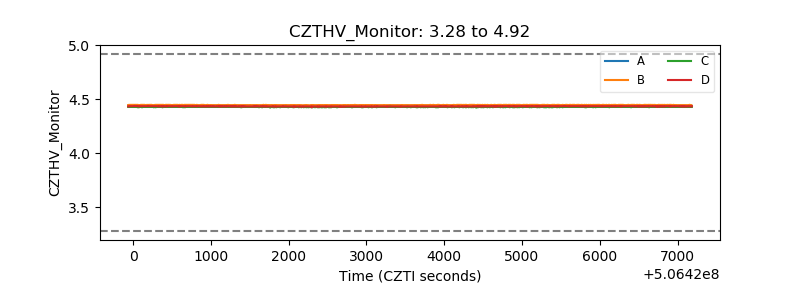 |
| D_VDD | 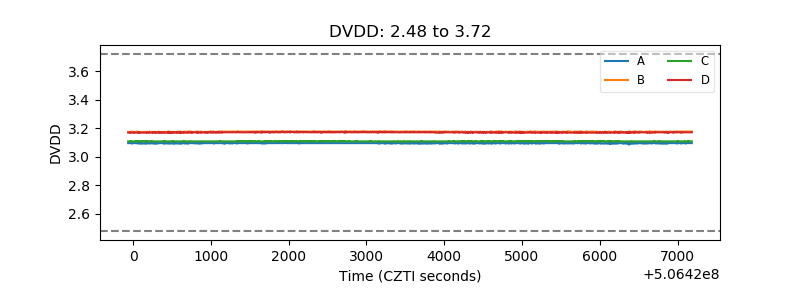 |
| Temperature 1 | 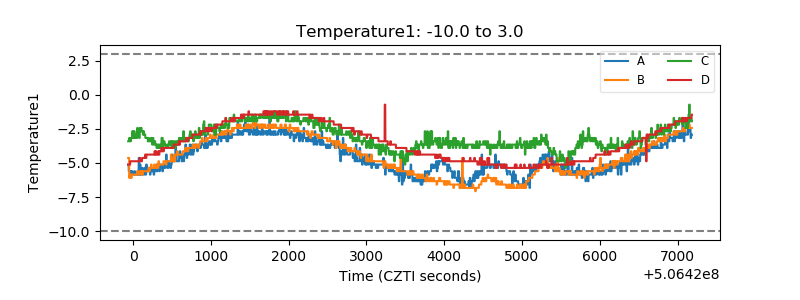 |
| Veto HV Monitor | 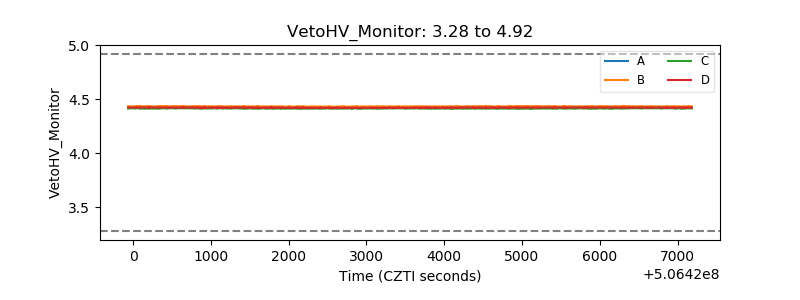 |
| Veto LLD | 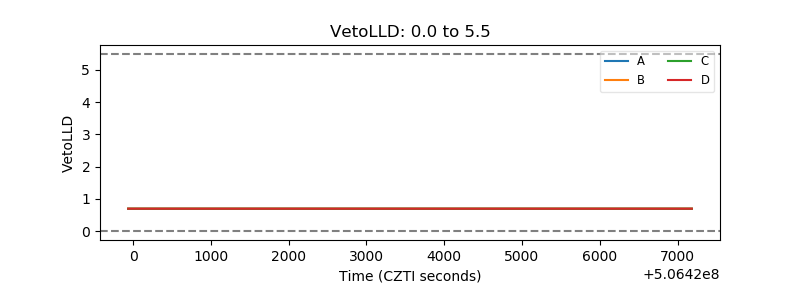 |
| Alpha Counter |  |
| _CPM_Rate | 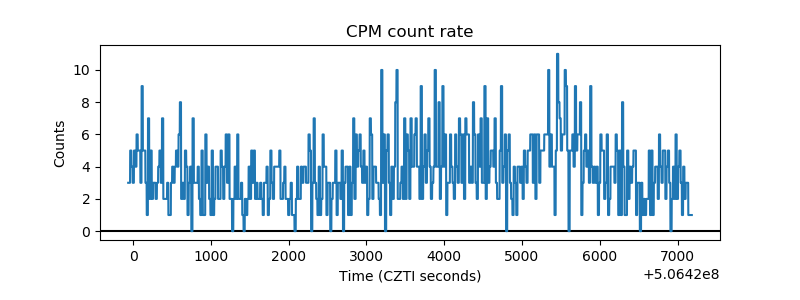 |
| CZT Counter | 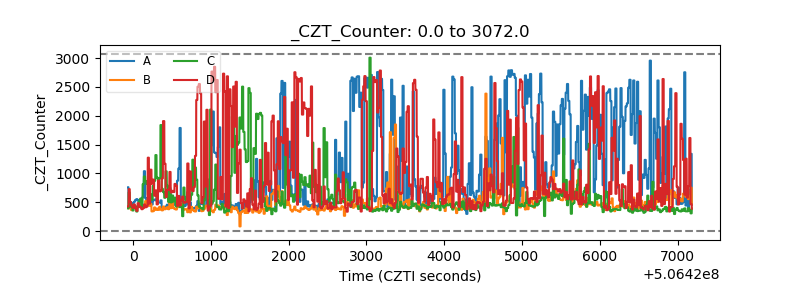 |
| +2.5 Volts monitor |  |
| +5 Volts monitor |  |
| _ROLL_ROT | 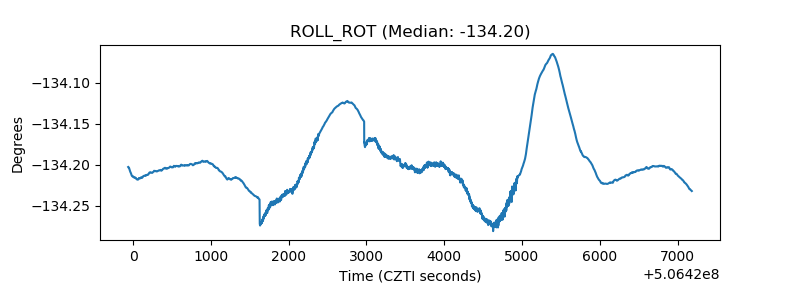 |
| _Roll_DEC | 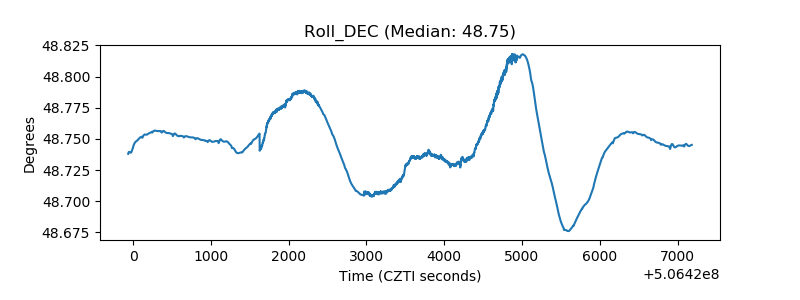 |
| _Roll_RA | 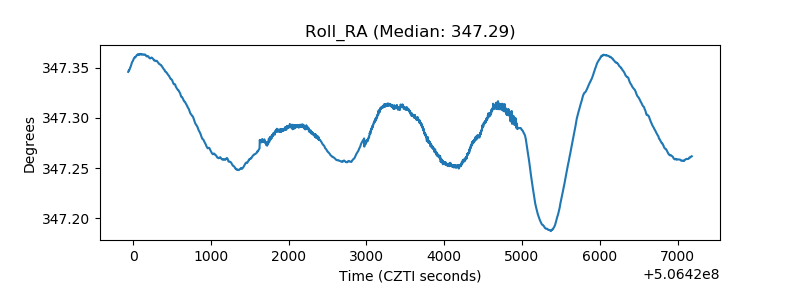 |
| Veto Counter | 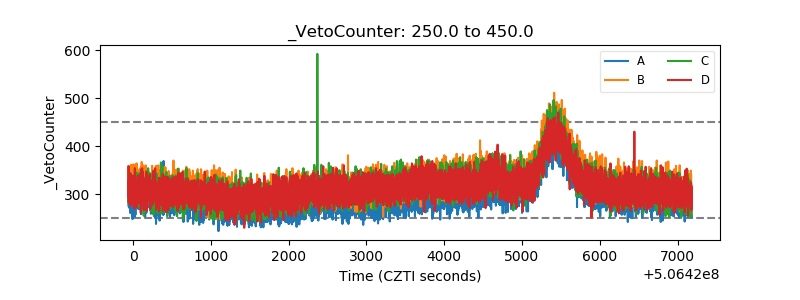 |