| Param | Original file | Final file |
|---|---|---|
| Filename | modeM0/AS1A14_099T04_9000006540_55771cztM0_level2.fits | modeM0/AS1A14_099T04_9000006540_55771cztM0_level2_quad_clean.evt |
| Size (bytes) | 581,362,560 | 105,382,080 |
| Size | 554.4 MB | 100.5 MB |
| Events in quadrant A | 8,461,148 | 612,712 |
| Events in quadrant B | 3,723,707 | 751,567 |
| Events in quadrant C | 3,252,143 | 684,554 |
| Events in quadrant D | 5,496,825 | 615,919 |
| Mode M0 | |||
|---|---|---|---|
| Quadrant | BADHDUFLAG | Total packets | Discarded packets |
| A | 0 | 30325 | 0 |
| B | 0 | 16325 | 0 |
| C | 0 | 15699 | 0 |
| D | 0 | 21623 | 0 |
| Mode SS | |||
|---|---|---|---|
| Quadrant | BADHDUFLAG | Total packets | Discarded packets |
| A | 0 | 152 | 0 |
| B | 0 | 152 | 0 |
| C | 0 | 152 | 0 |
| D | 0 | 152 | 0 |
| Quadrant | Total seconds | Saturated seconds | Saturation percentage |
|---|---|---|---|
| A | 7560 | 1195 | 15.806878% |
| B | 7560 | 18 | 0.238095% |
| C | 7561 | 14 | 0.185161% |
| D | 7561 | 385 | 5.091919% |
Noise dominated data is calculated using 1-second bins in cleaned event files. If a bin has >2000 counts, and if more than 50% of those come from <1% of pixels, then it is considered to be noise-dominated and hence unusable.
| Quadrant | # 1 sec bins | Bins with >0 counts | Bins with >2000 counts | High rate bins dominated by noise | Noise dominated (total time) | Noise dominated (detector-on time) | Marked lightcurve |
|---|---|---|---|---|---|---|---|
| A | 7560 | 7560 | 1187 | 1187 | 15.70% | 15.70% | 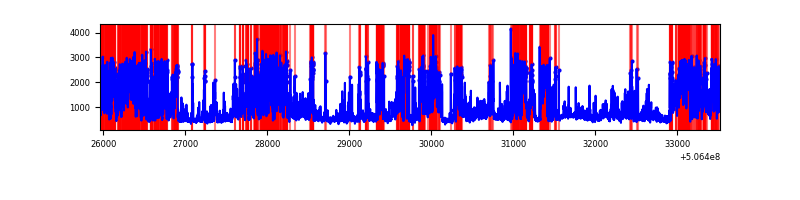 |
| B | 7560 | 7560 | 1 | 1 | 0.01% | 0.01% | 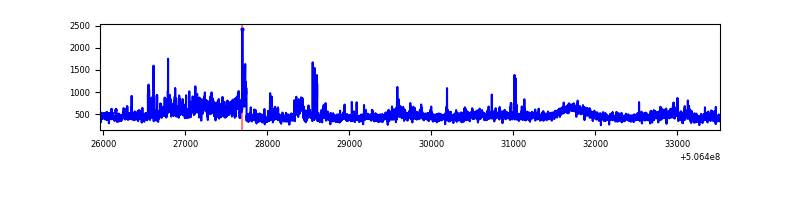 |
| C | 7561 | 7561 | 12 | 12 | 0.16% | 0.16% | 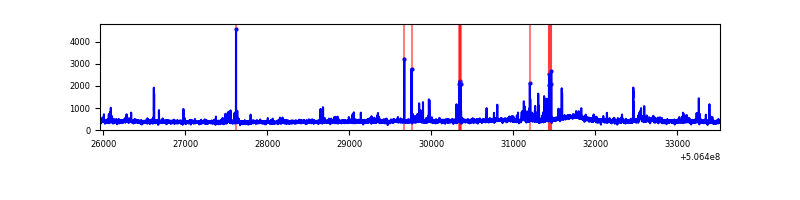 |
| D | 7561 | 7561 | 412 | 412 | 5.45% | 5.45% | 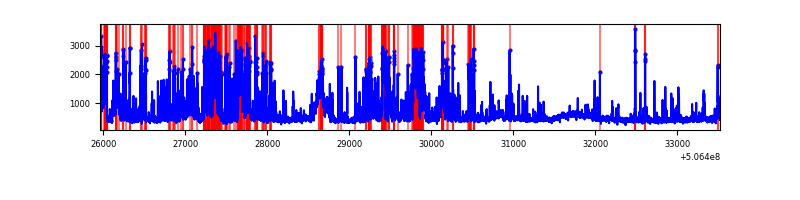 |
Top three noisy pixels from each quadrant. If the there are fewer than three noisy pixels in the level2.evt file, extra rows are filled as -1
| Pixel properties | Quadrant properties | ||||||
|---|---|---|---|---|---|---|---|
| Quadrant | DetID | PixID | Counts | Sigma | Mean | Median | Sigma |
| A | 15 | 32 | 2764347 | 14999.59 | 743 | 725 | 184.2 |
| A | 7 | 64 | 2031438 | 11021.72 | 743 | 725 | 184.2 |
| A | 8 | 192 | 281024 | 1521.33 | 743 | 725 | 184.2 |
| B | 7 | 0 | 486671 | 2910.48 | 775 | 746 | 167.0 |
| B | 4 | 206 | 86457 | 513.37 | 775 | 746 | 167.0 |
| B | 0 | 199 | 30218 | 176.52 | 775 | 746 | 167.0 |
| C | 12 | 2 | 67984 | 321.62 | 764 | 757 | 209.0 |
| C | 10 | 22 | 52246 | 246.33 | 764 | 757 | 209.0 |
| C | 12 | 250 | 31572 | 147.42 | 764 | 757 | 209.0 |
| D | 11 | 129 | 1615879 | 7657.61 | 745 | 711 | 210.9 |
| D | 7 | 70 | 441660 | 2090.57 | 745 | 711 | 210.9 |
| D | 8 | 240 | 231300 | 1093.24 | 745 | 711 | 210.9 |
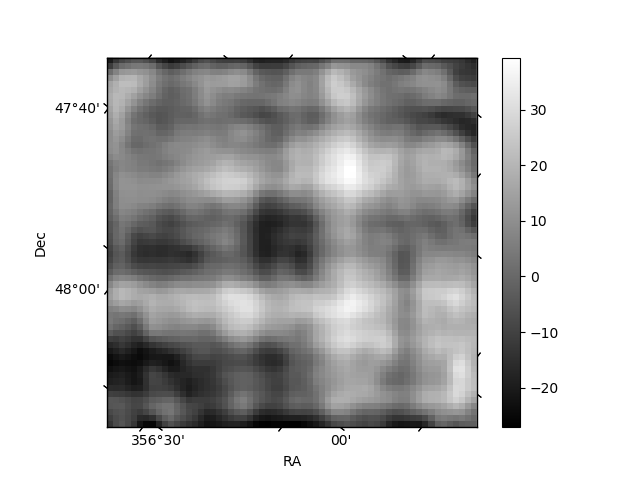
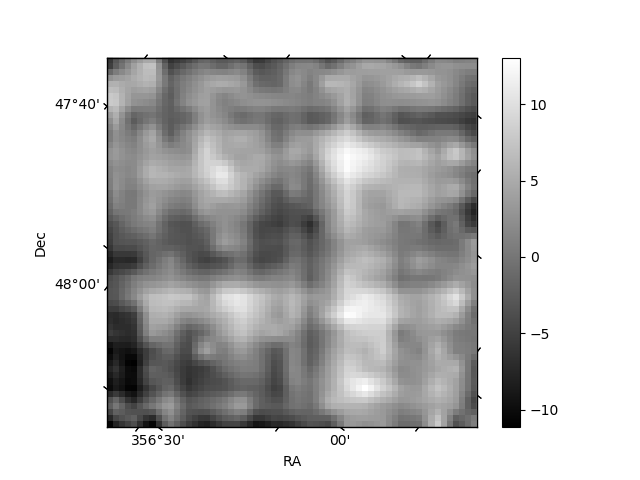
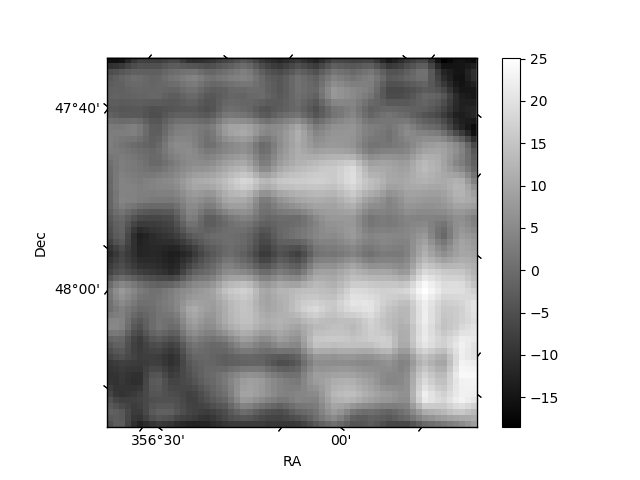
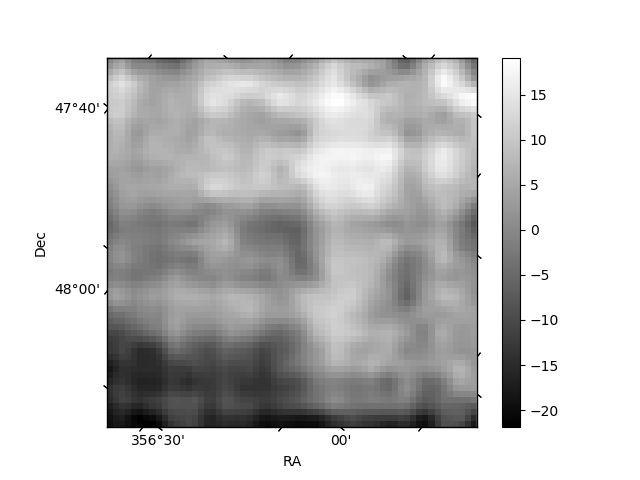
Histogram calculated using DETX and DETY for each event in the final _common_clean file
| Quadrant A | 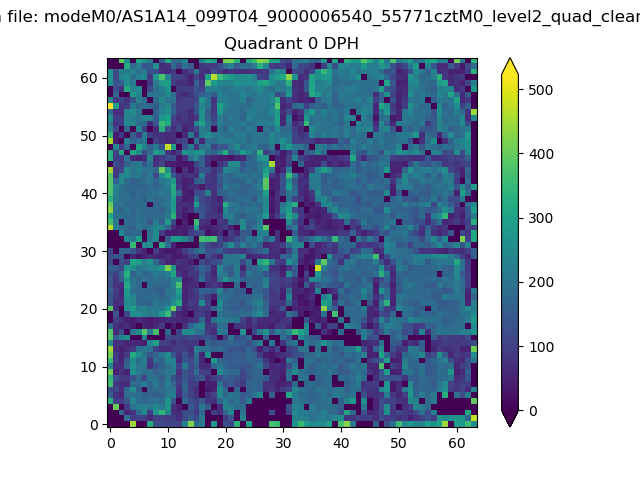 |
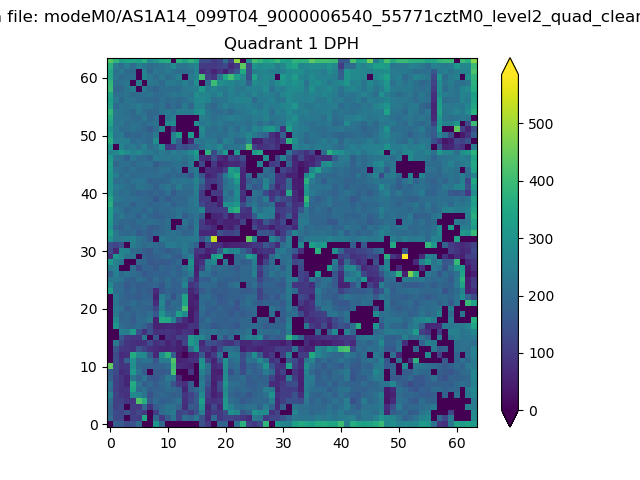 |
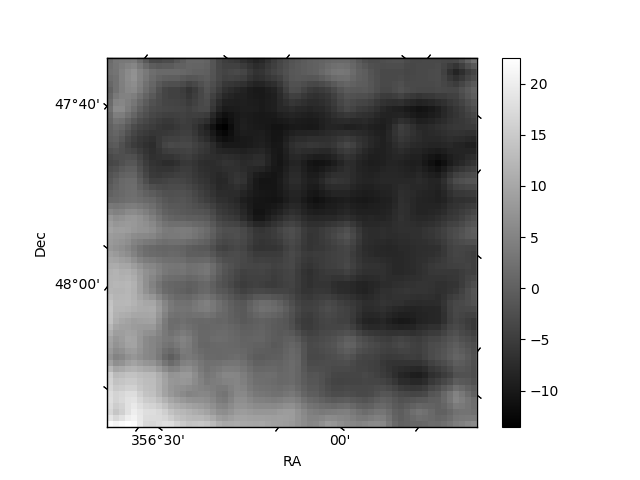
Quadrant B |
|---|---|---|---|
| Quadrant D | 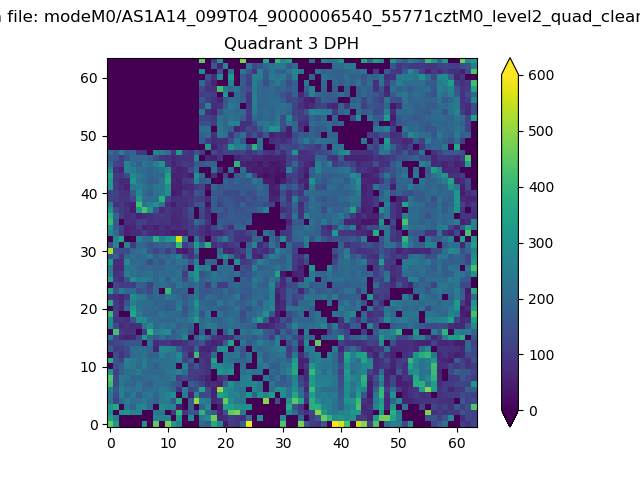 |
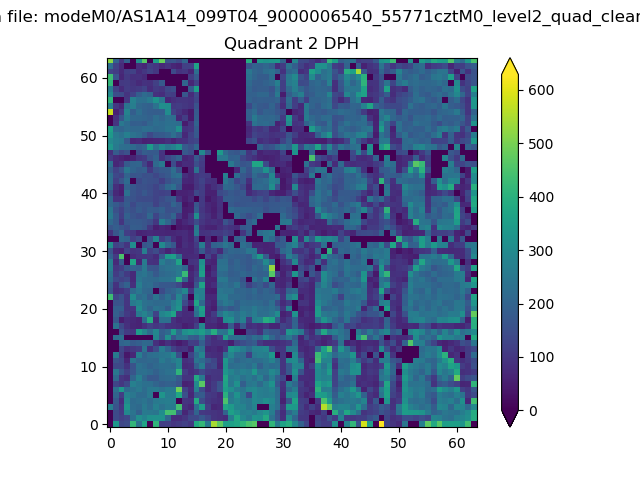 |
Quadrant C |
| Plot type | Count rate plots | Images |
|---|---|---|
| Comparison with Poisson distribution Blue bars denote a histogram of data divided into 1 sec bins. Red curve is a Poisson curve with rate = median count rate of data. |
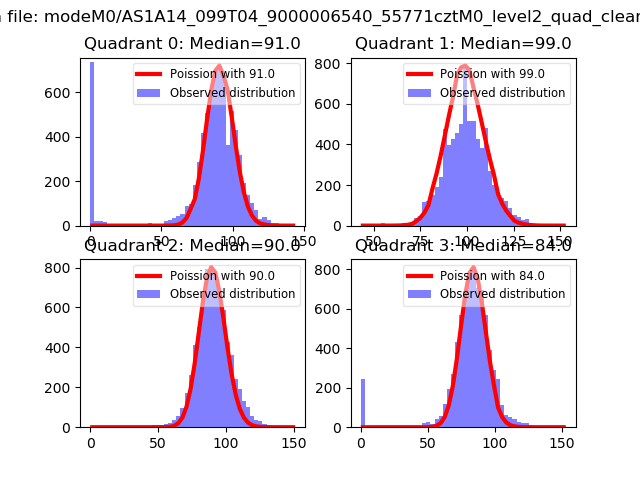 |
 |
| Quadrant-wise count rates Data is divided into 100 sec bins |
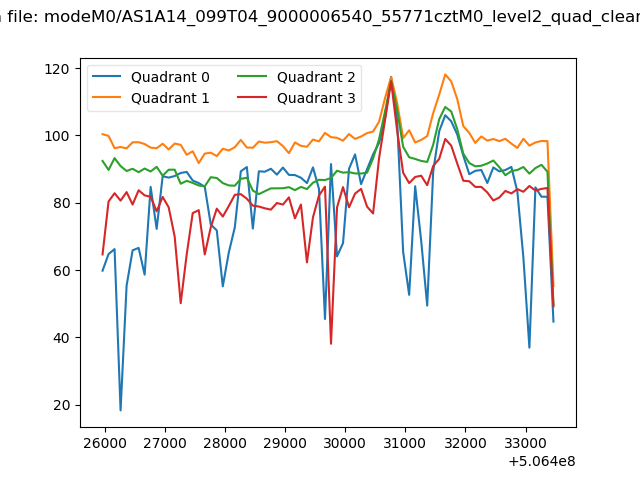 |
|
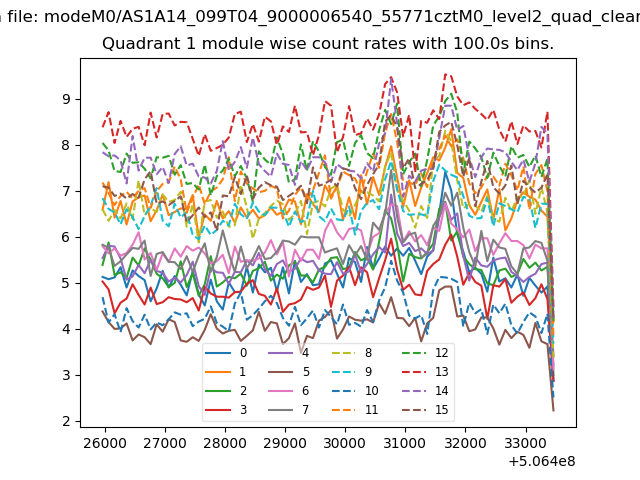
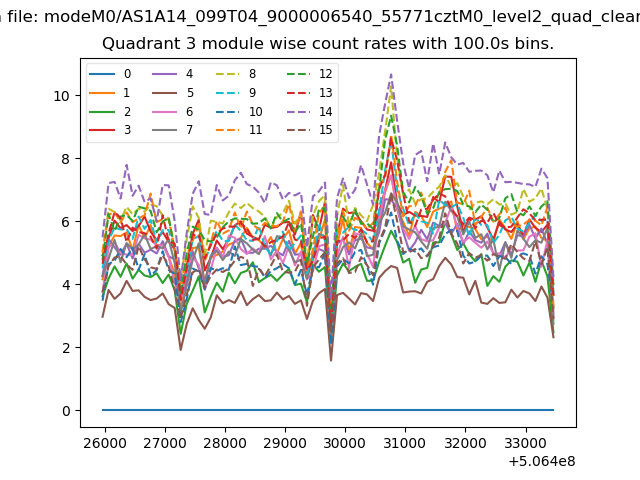
| Module-wise count rates for Quadrant A Data is divided into 100 sec bins |
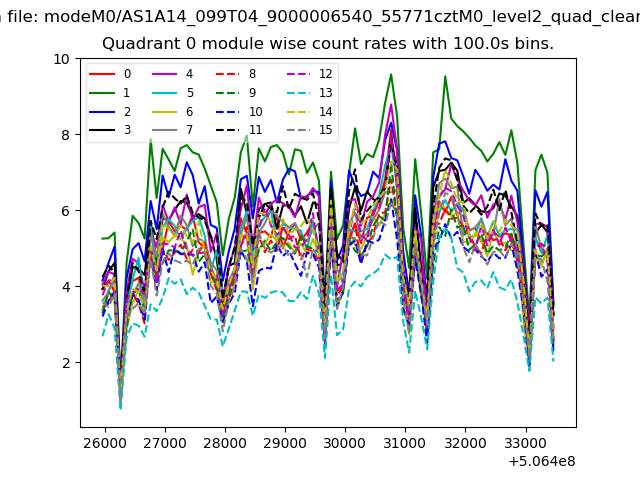 |
 |
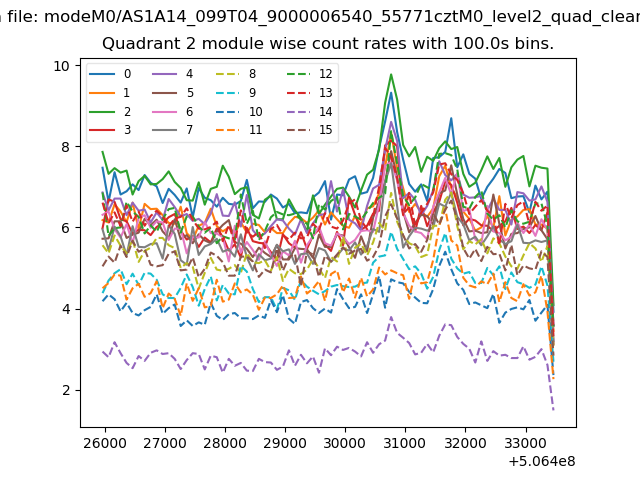
| Module-wise count rates for Quadrant B Data is divided into 100 sec bins |
 |
 |
| Module-wise count rates for Quadrant C Data is divided into 100 sec bins |
 |
 |
| Module-wise count rates for Quadrant D Data is divided into 100 sec bins |
 |
 |
| Parameter | Plot |
|---|---|
| CZT HV Monitor |  |
| D_VDD | 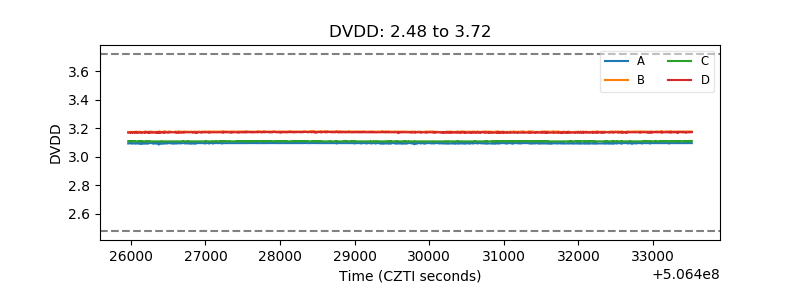 |
| Temperature 1 | 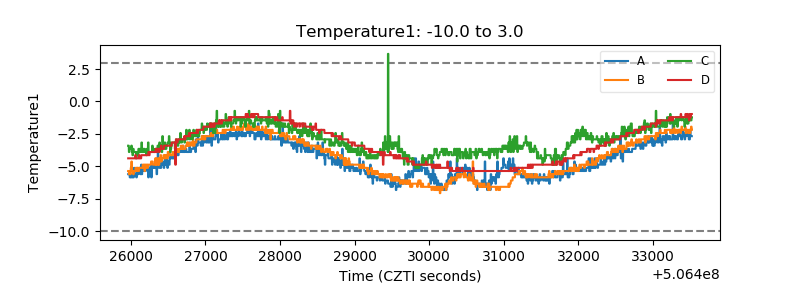 |
| Veto HV Monitor | 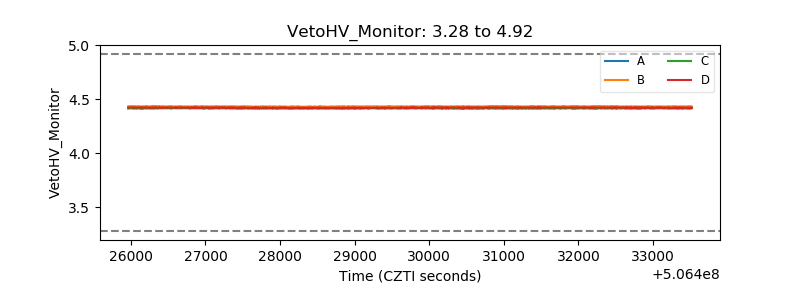 |
| Veto LLD | 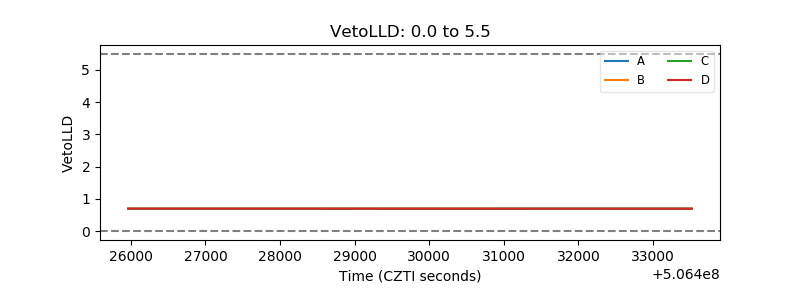 |
| Alpha Counter | 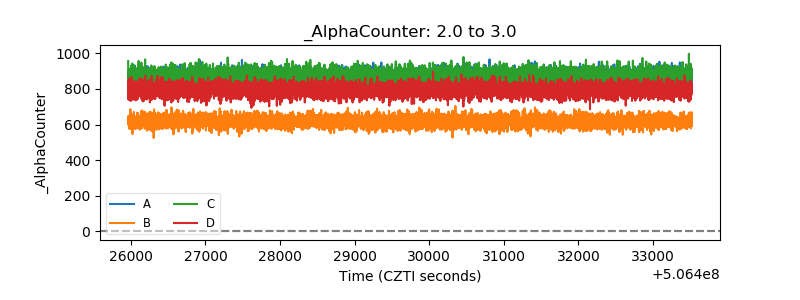 |
| _CPM_Rate | 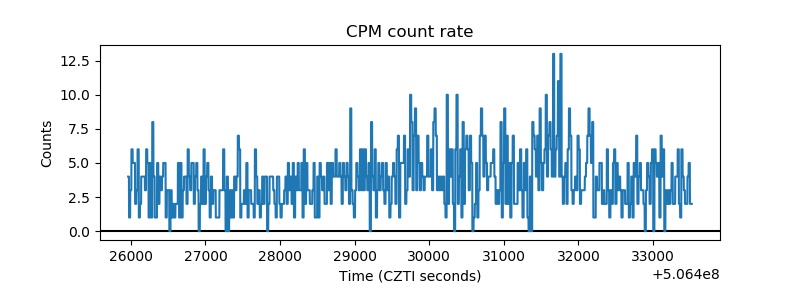 |
| CZT Counter | 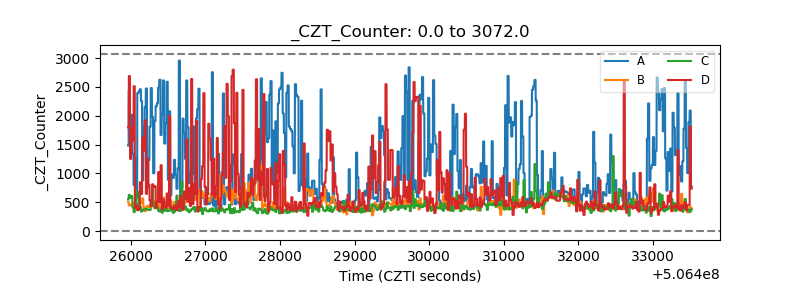 |
| +2.5 Volts monitor |  |
| +5 Volts monitor |  |
| _ROLL_ROT | 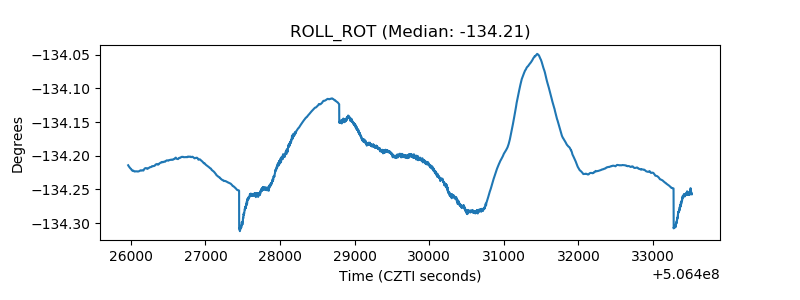 |
| _Roll_DEC | 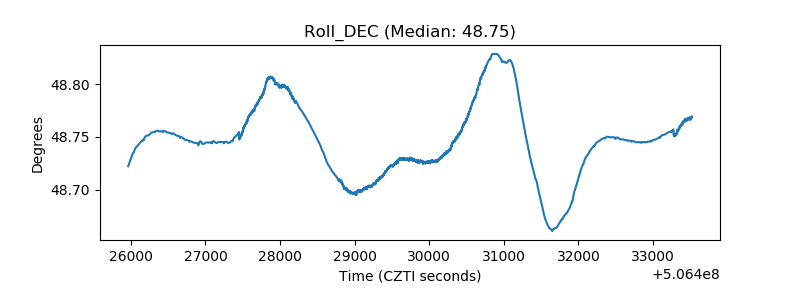 |
| _Roll_RA | 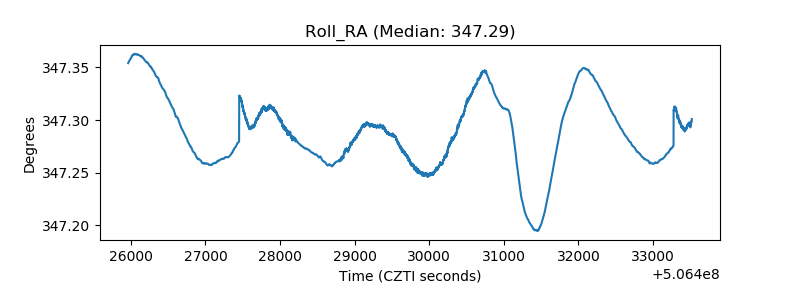 |
| Veto Counter | 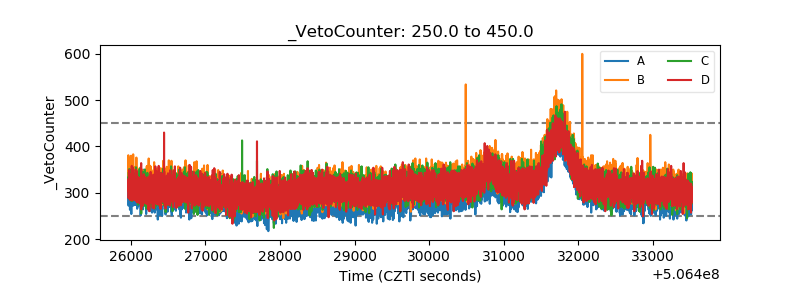 |