| Param | Original file | Final file |
|---|---|---|
| Filename | modeM0/AS1A14_099T04_9000006540_55775cztM0_level2.fits | modeM0/AS1A14_099T04_9000006540_55775cztM0_level2_quad_clean.evt |
| Size (bytes) | 990,336,960 | 71,579,520 |
| Size | 944.5 MB | 68.3 MB |
| Events in quadrant A | 12,306,957 | 386,347 |
| Events in quadrant B | 6,864,224 | 665,355 |
| Events in quadrant C | 3,706,994 | 587,189 |
| Events in quadrant D | 13,273,350 | 70,452 |
| Mode M0 | |||
|---|---|---|---|
| Quadrant | BADHDUFLAG | Total packets | Discarded packets |
| A | 0 | 41088 | 7 |
| B | 0 | 25061 | 1 |
| C | 0 | 15969 | 1 |
| D | 0 | 43938 | 1 |
| Mode M9 | |||
|---|---|---|---|
| Quadrant | BADHDUFLAG | Total packets | Discarded packets |
| A | 0 | 9 | 0 |
| B | 0 | 9 | 0 |
| C | 0 | 9 | 0 |
| D | 0 | 9 | 0 |
| Mode SS | |||
|---|---|---|---|
| Quadrant | BADHDUFLAG | Total packets | Discarded packets |
| A | 0 | 134 | 0 |
| B | 0 | 134 | 0 |
| C | 0 | 134 | 0 |
| D | 0 | 134 | 0 |
| Quadrant | Total seconds | Saturated seconds | Saturation percentage |
|---|---|---|---|
| A | 6563 | 3235 | 49.291483% |
| B | 6564 | 284 | 4.326630% |
| C | 6564 | 255 | 3.884826% |
| D | 6564 | 5901 | 89.899452% |
Noise dominated data is calculated using 1-second bins in cleaned event files. If a bin has >2000 counts, and if more than 50% of those come from <1% of pixels, then it is considered to be noise-dominated and hence unusable.
| Quadrant | # 1 sec bins | Bins with >0 counts | Bins with >2000 counts | High rate bins dominated by noise | Noise dominated (total time) | Noise dominated (detector-on time) | Marked lightcurve |
|---|---|---|---|---|---|---|---|
| A | 7388 | 6563 | 3140 | 3140 | 42.50% | 47.84% | 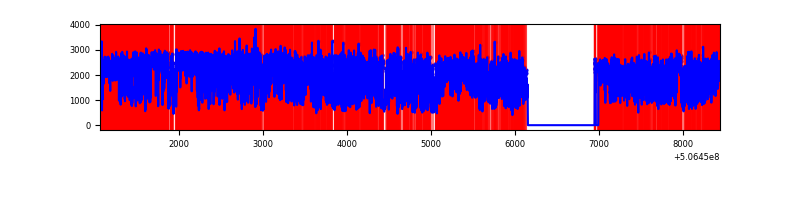 |
| B | 7389 | 6565 | 105 | 105 | 1.42% | 1.60% | 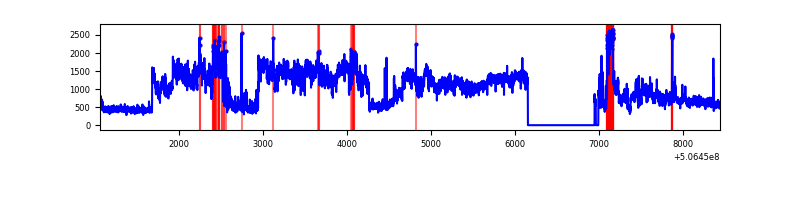 |
| C | 7389 | 6565 | 193 | 193 | 2.61% | 2.94% | 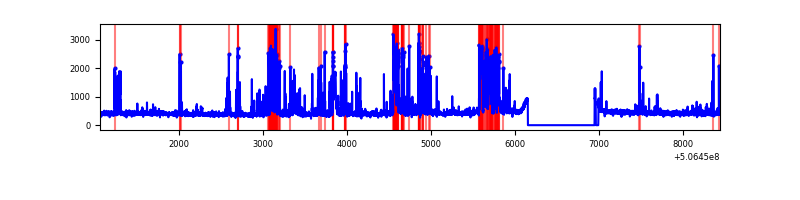 |
| D | 7388 | 6564 | 4361 | 4361 | 59.03% | 66.44% | 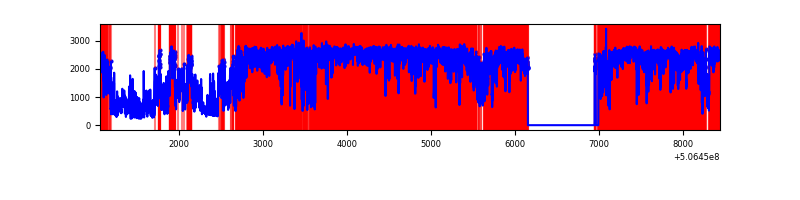 |
Top three noisy pixels from each quadrant. If the there are fewer than three noisy pixels in the level2.evt file, extra rows are filled as -1
| Pixel properties | Quadrant properties | ||||||
|---|---|---|---|---|---|---|---|
| Quadrant | DetID | PixID | Counts | Sigma | Mean | Median | Sigma |
| A | 7 | 64 | 8426167 | 60495.85 | 554 | 542 | 139.3 |
| A | 15 | 32 | 785158 | 5633.53 | 554 | 542 | 139.3 |
| A | 0 | 8 | 347750 | 2492.95 | 554 | 542 | 139.3 |
| B | 5 | 172 | 4045458 | 28033.09 | 671 | 647 | 144.3 |
| B | 7 | 0 | 79327 | 545.3 | 671 | 647 | 144.3 |
| B | 7 | 252 | 38221 | 260.41 | 671 | 647 | 144.3 |
| C | 13 | 3 | 894321 | 4856.43 | 666 | 657 | 184.0 |
| C | 12 | 2 | 102573 | 553.84 | 666 | 657 | 184.0 |
| C | 14 | 96 | 44432 | 237.89 | 666 | 657 | 184.0 |
| D | 11 | 129 | 10086788 | 137108.83 | 249 | 237 | 73.6 |
| D | 7 | 70 | 1812075 | 24628.74 | 249 | 237 | 73.6 |
| D | 8 | 245 | 145335 | 1972.35 | 249 | 237 | 73.6 |
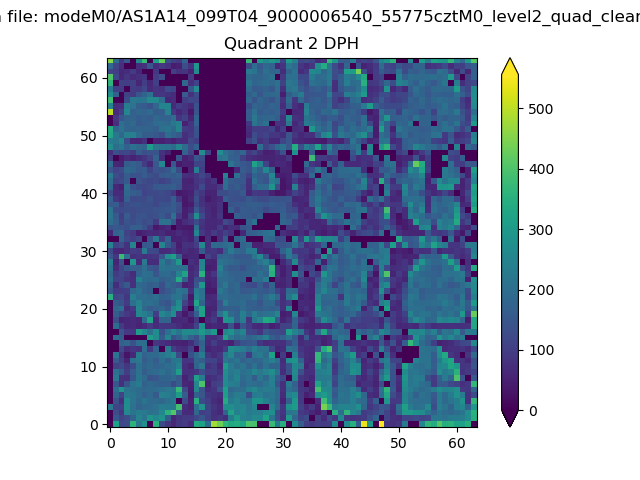
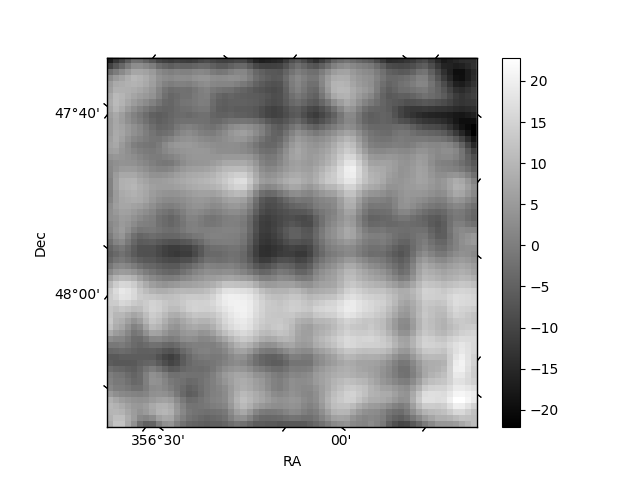
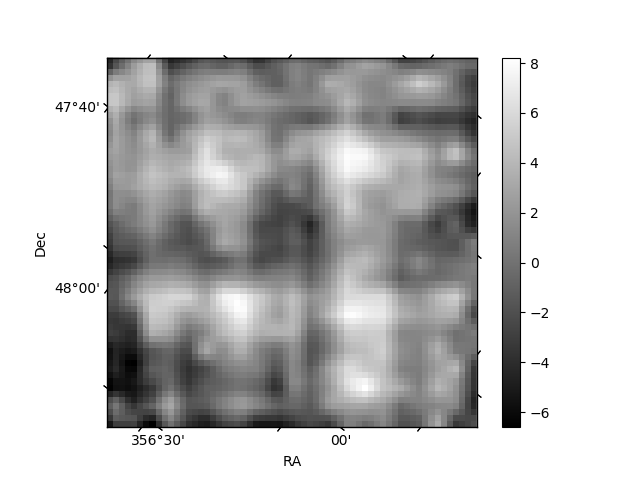
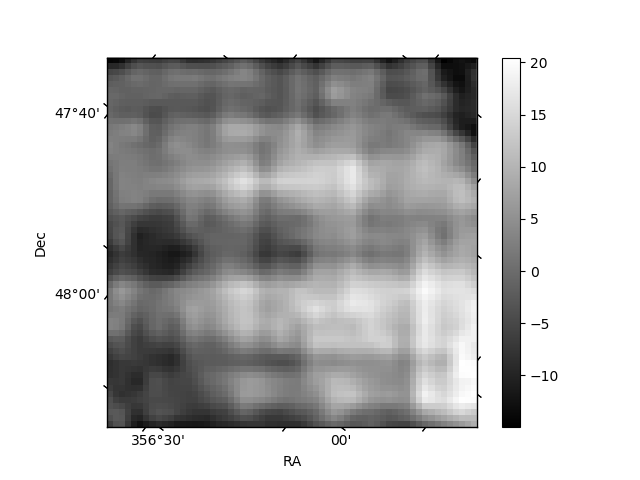
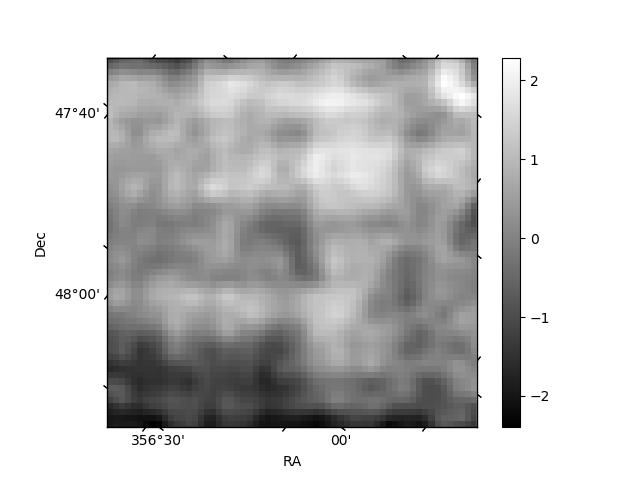
Histogram calculated using DETX and DETY for each event in the final _common_clean file
| Quadrant A | 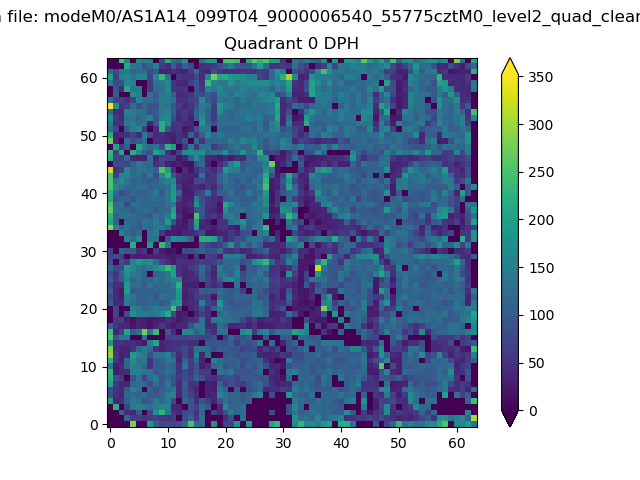 |
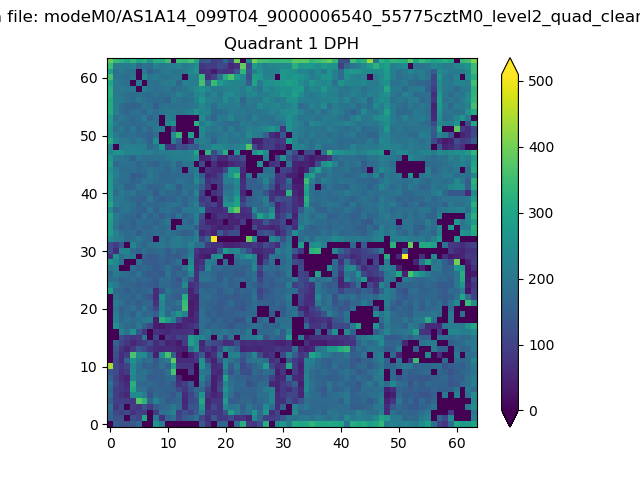 |
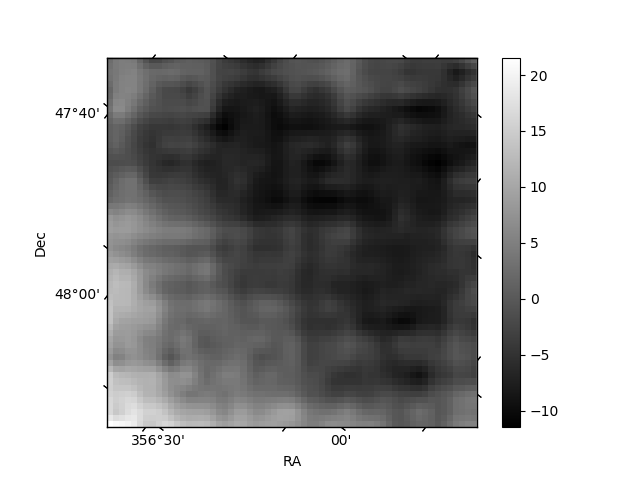
Quadrant B |
|---|---|---|---|
| Quadrant D | 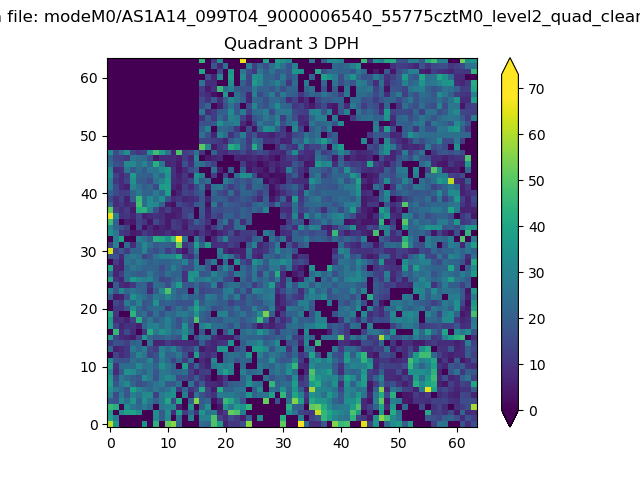 |
 |
Quadrant C |
| Plot type | Count rate plots | Images |
|---|---|---|
| Comparison with Poisson distribution Blue bars denote a histogram of data divided into 1 sec bins. Red curve is a Poisson curve with rate = median count rate of data. |
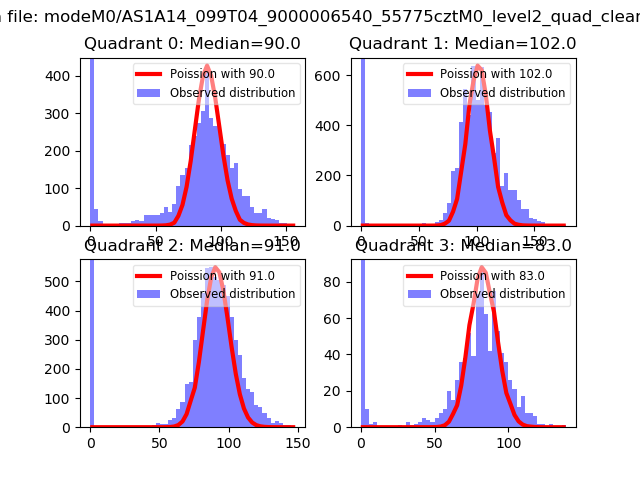 |
 |
| Quadrant-wise count rates Data is divided into 100 sec bins |
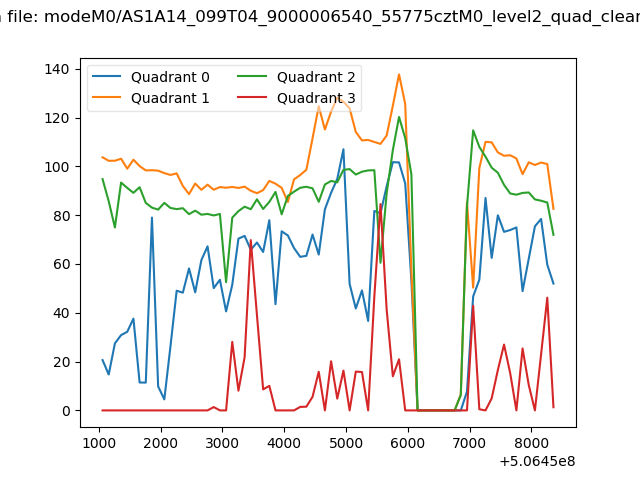 |
|
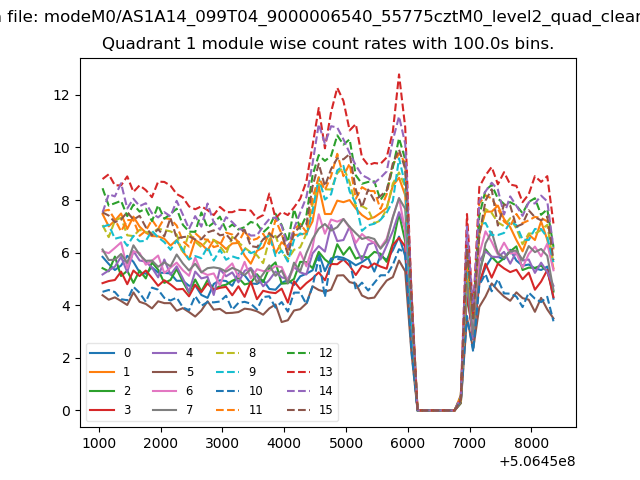
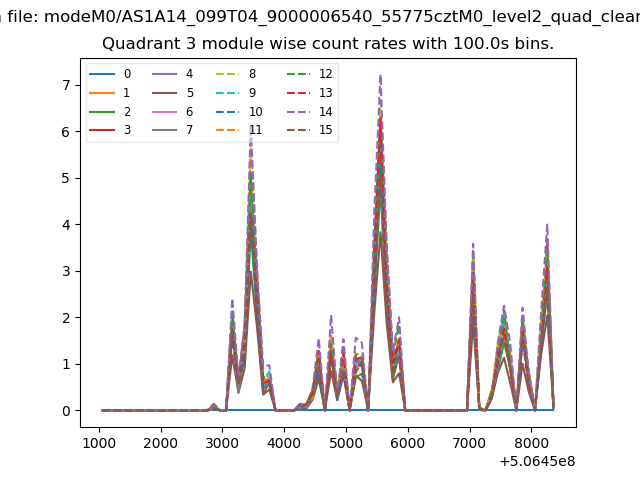
| Module-wise count rates for Quadrant A Data is divided into 100 sec bins |
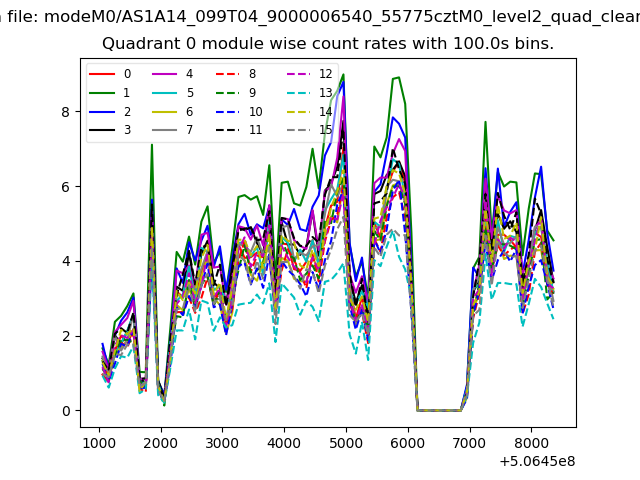 |
 |
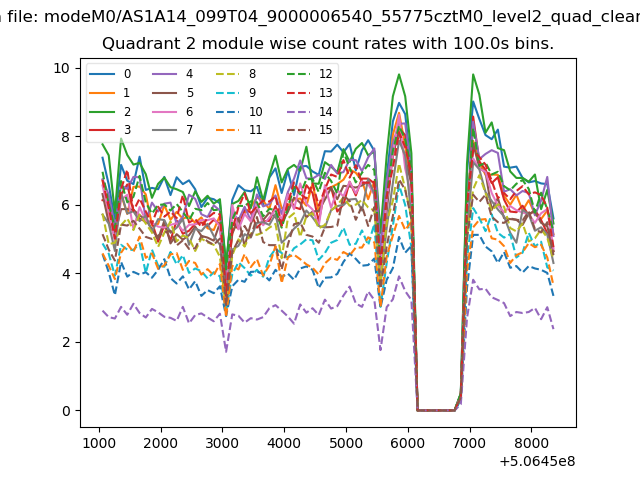
| Module-wise count rates for Quadrant B Data is divided into 100 sec bins |
 |
 |
| Module-wise count rates for Quadrant C Data is divided into 100 sec bins |
 |
 |
| Module-wise count rates for Quadrant D Data is divided into 100 sec bins |
 |
 |
| Parameter | Plot |
|---|---|
| CZT HV Monitor | 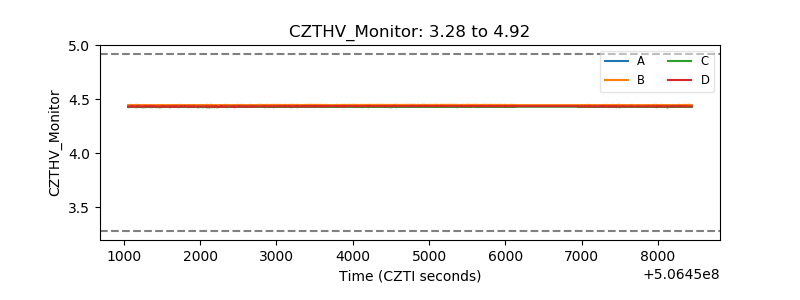 |
| D_VDD | 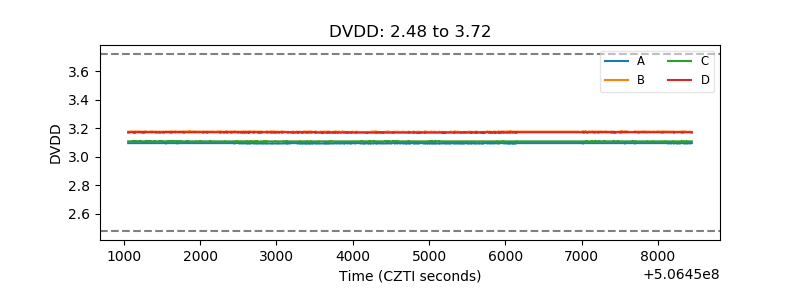 |
| Temperature 1 | 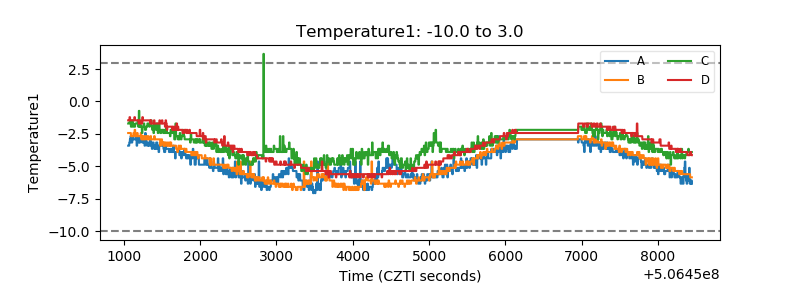 |
| Veto HV Monitor | 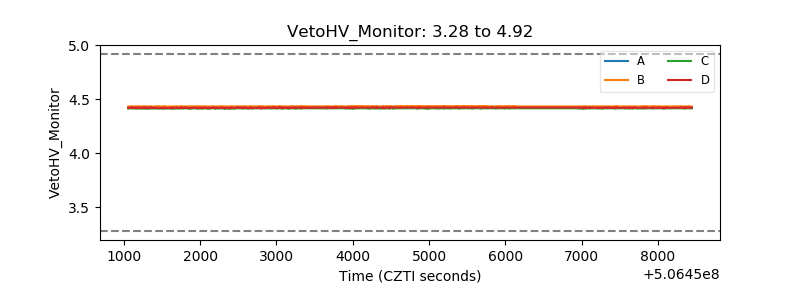 |
| Veto LLD | 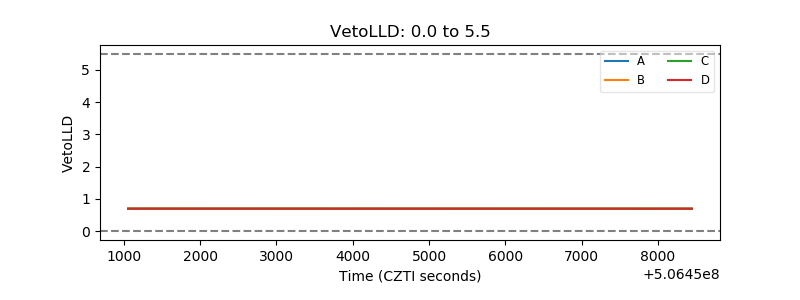 |
| Alpha Counter | 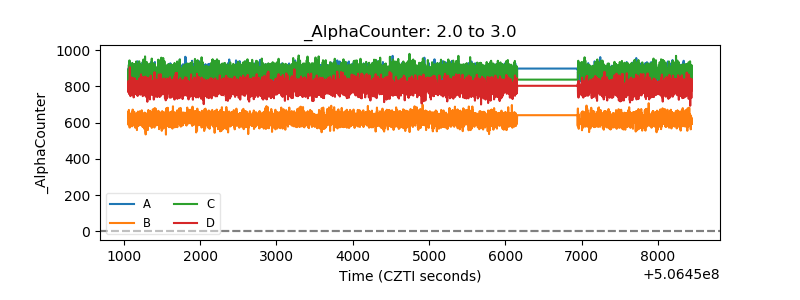 |
| _CPM_Rate | 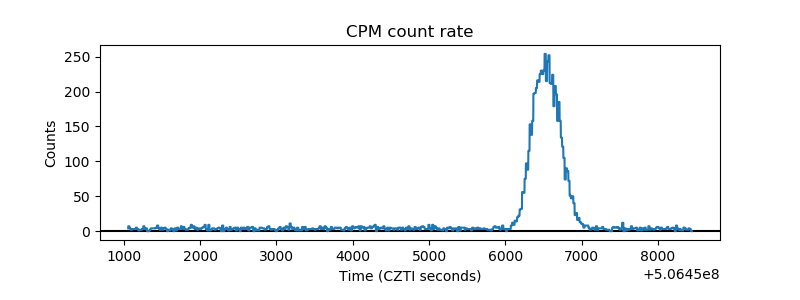 |
| CZT Counter | 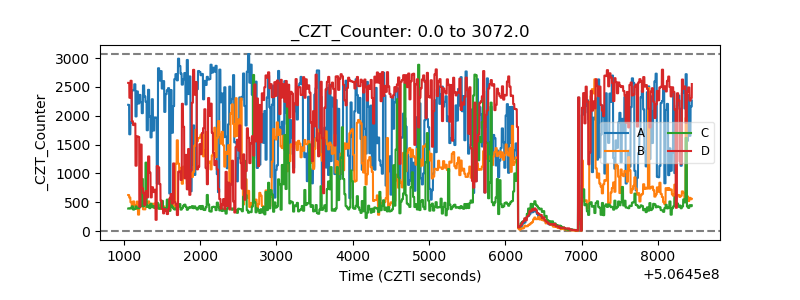 |
| +2.5 Volts monitor | 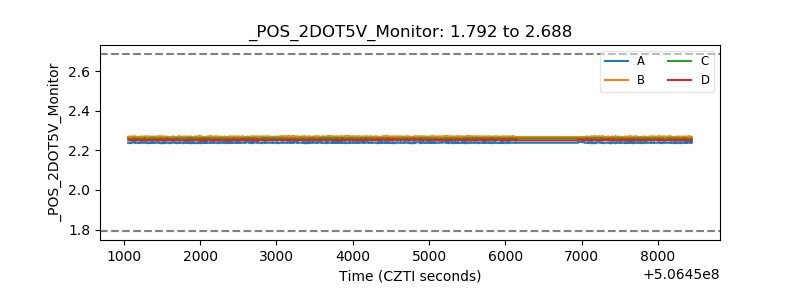 |
| +5 Volts monitor | 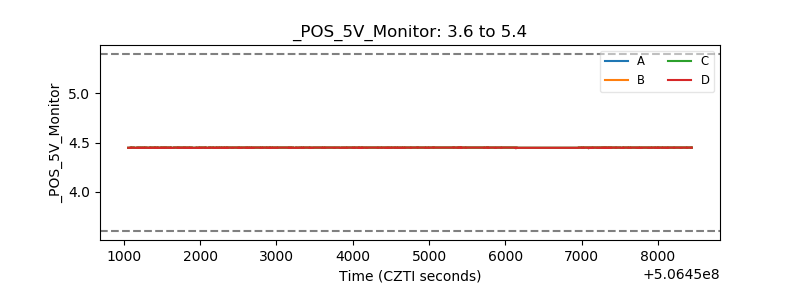 |
| _ROLL_ROT | 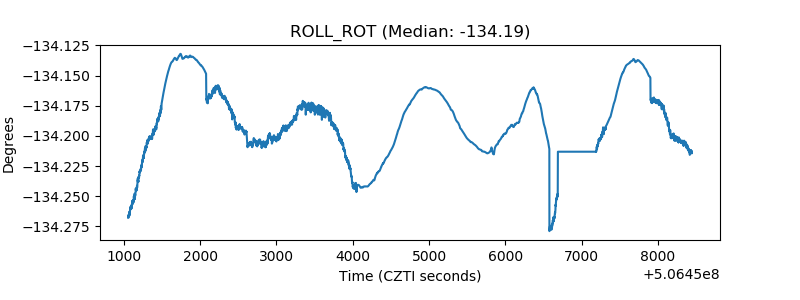 |
| _Roll_DEC | 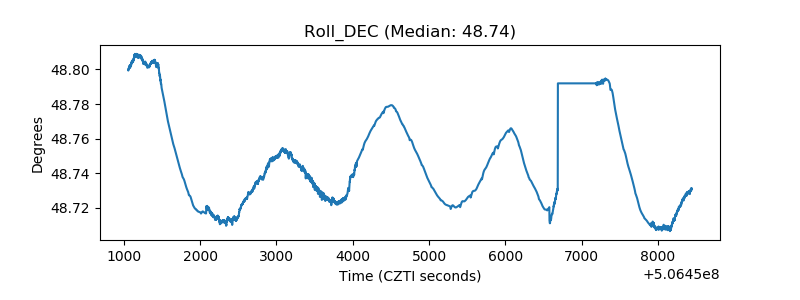 |
| _Roll_RA | 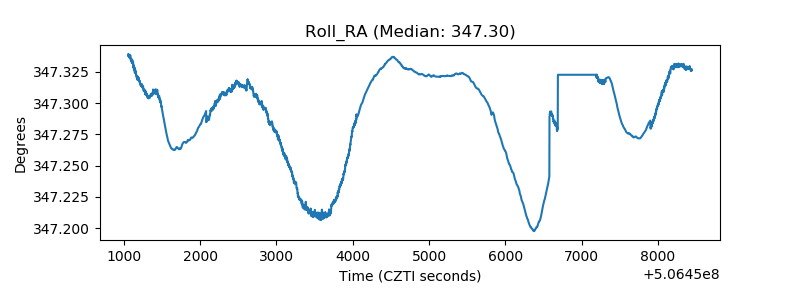 |
| Veto Counter | 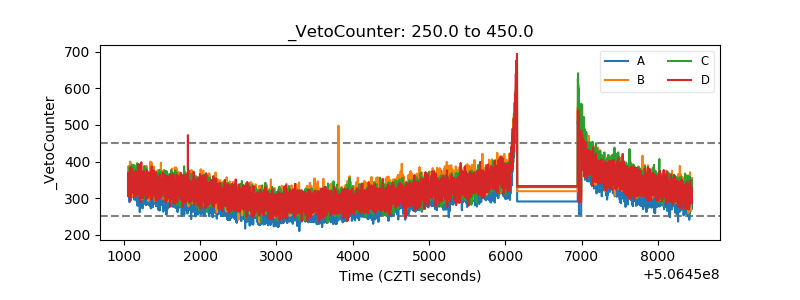 |