| Param | Original file | Final file |
|---|---|---|
| Filename | modeM0/AS1A14_099T04_9000006540_55779cztM0_level2.fits | modeM0/AS1A14_099T04_9000006540_55779cztM0_level2_quad_clean.evt |
| Size (bytes) | 699,367,680 | 89,190,720 |
| Size | 667.0 MB | 85.1 MB |
| Events in quadrant A | 8,729,344 | 552,590 |
| Events in quadrant B | 3,285,327 | 702,390 |
| Events in quadrant C | 2,958,605 | 631,891 |
| Events in quadrant D | 10,403,926 | 353,798 |
| Mode M0 | |||
|---|---|---|---|
| Quadrant | BADHDUFLAG | Total packets | Discarded packets |
| A | 0 | 30560 | 2 |
| B | 0 | 13944 | 2 |
| C | 0 | 13777 | 2 |
| D | 0 | 35497 | 2 |
| Mode M9 | |||
|---|---|---|---|
| Quadrant | BADHDUFLAG | Total packets | Discarded packets |
| A | 0 | 16 | 0 |
| B | 0 | 17 | 0 |
| C | 0 | 17 | 0 |
| D | 0 | 17 | 0 |
| Mode SS | |||
|---|---|---|---|
| Quadrant | BADHDUFLAG | Total packets | Discarded packets |
| A | 0 | 134 | 0 |
| B | 0 | 134 | 0 |
| C | 0 | 134 | 0 |
| D | 0 | 134 | 0 |
| Quadrant | Total seconds | Saturated seconds | Saturation percentage |
|---|---|---|---|
| A | 6594 | 1321 | 20.033364% |
| B | 6594 | 21 | 0.318471% |
| C | 6594 | 19 | 0.288141% |
| D | 6594 | 2890 | 43.827722% |
Noise dominated data is calculated using 1-second bins in cleaned event files. If a bin has >2000 counts, and if more than 50% of those come from <1% of pixels, then it is considered to be noise-dominated and hence unusable.
| Quadrant | # 1 sec bins | Bins with >0 counts | Bins with >2000 counts | High rate bins dominated by noise | Noise dominated (total time) | Noise dominated (detector-on time) | Marked lightcurve |
|---|---|---|---|---|---|---|---|
| A | 7804 | 6594 | 1237 | 1237 | 15.85% | 18.76% | 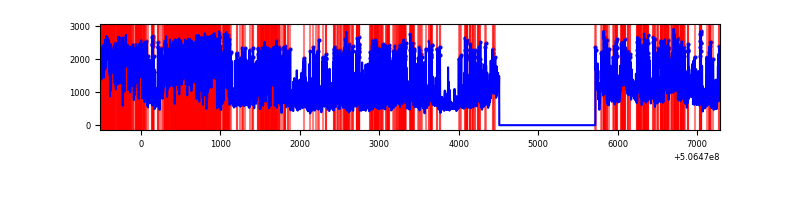 |
| B | 7804 | 6595 | 2 | 2 | 0.03% | 0.03% | 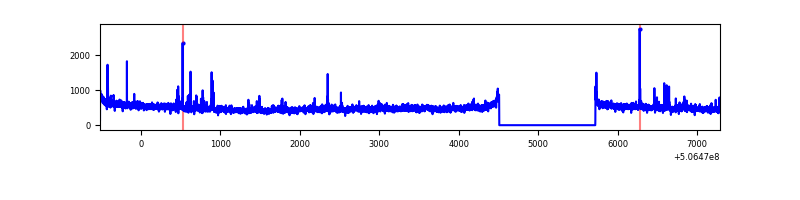 |
| C | 7804 | 6595 | 16 | 16 | 0.21% | 0.24% | 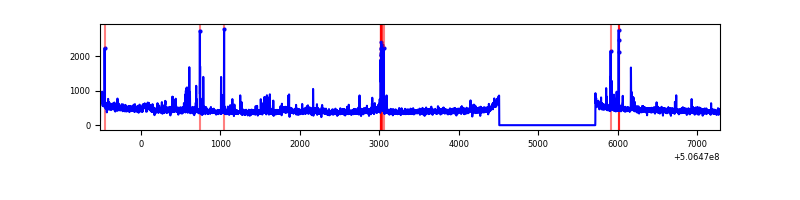 |
| D | 7804 | 6594 | 2789 | 2789 | 35.74% | 42.30% | 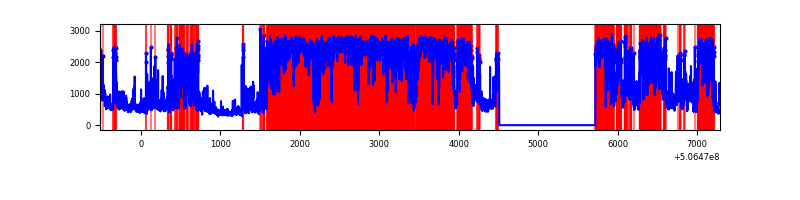 |
Top three noisy pixels from each quadrant. If the there are fewer than three noisy pixels in the level2.evt file, extra rows are filled as -1
| Pixel properties | Quadrant properties | ||||||
|---|---|---|---|---|---|---|---|
| Quadrant | DetID | PixID | Counts | Sigma | Mean | Median | Sigma |
| A | 7 | 64 | 4583735 | 27998.02 | 664 | 648 | 163.7 |
| A | 15 | 32 | 736741 | 4496.78 | 664 | 648 | 163.7 |
| A | 12 | 115 | 248532 | 1514.32 | 664 | 648 | 163.7 |
| B | 5 | 172 | 416574 | 2745.21 | 704 | 676 | 151.5 |
| B | 0 | 199 | 28080 | 180.89 | 704 | 676 | 151.5 |
| B | 12 | 111 | 18243 | 115.95 | 704 | 676 | 151.5 |
| C | 9 | 38 | 58177 | 297.93 | 699 | 691 | 192.9 |
| C | 6 | 223 | 49654 | 253.76 | 699 | 691 | 192.9 |
| C | 14 | 96 | 30501 | 154.49 | 699 | 691 | 192.9 |
| D | 11 | 129 | 7156061 | 47796.51 | 522 | 497 | 149.7 |
| D | 7 | 70 | 478664 | 3193.98 | 522 | 497 | 149.7 |
| D | 8 | 245 | 274676 | 1831.41 | 522 | 497 | 149.7 |
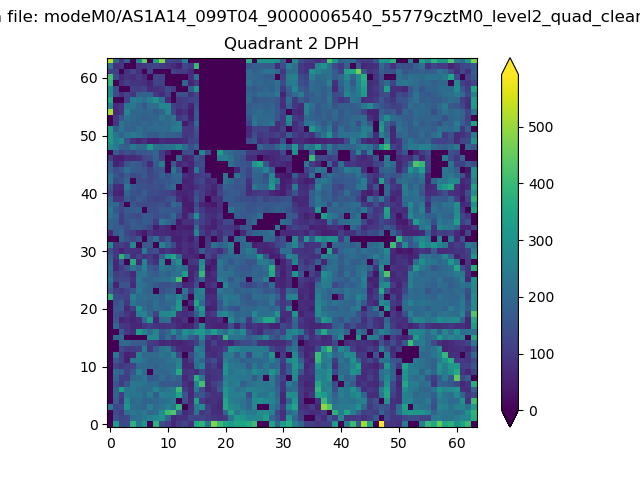
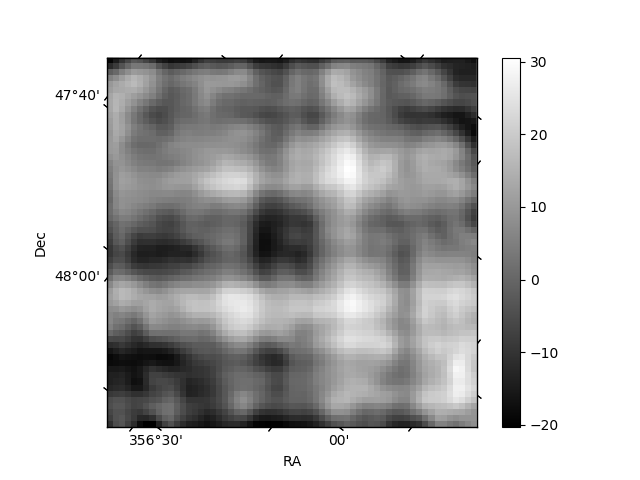
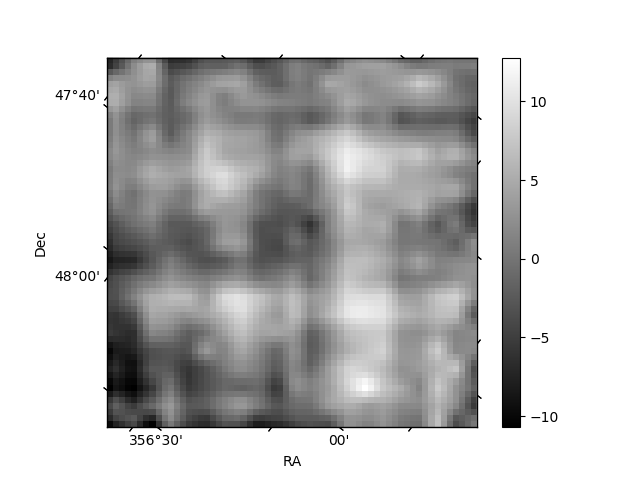
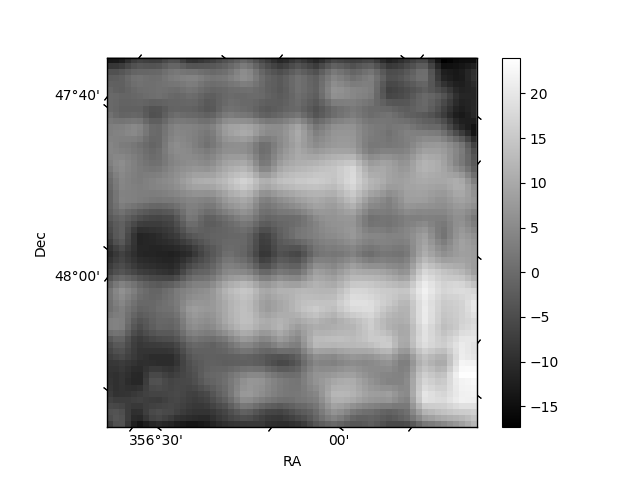
Histogram calculated using DETX and DETY for each event in the final _common_clean file
| Quadrant A | 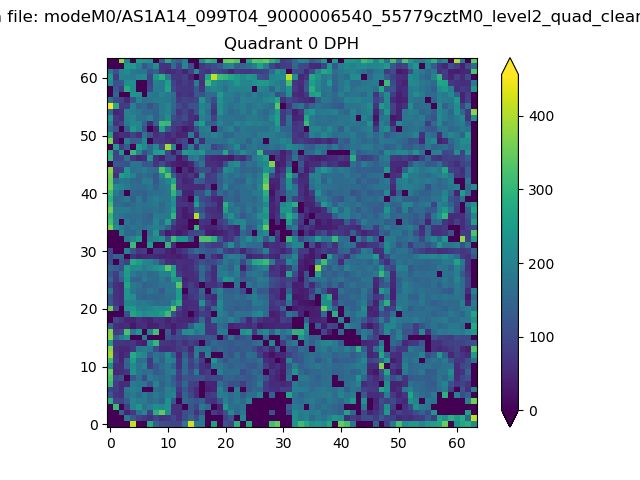 |
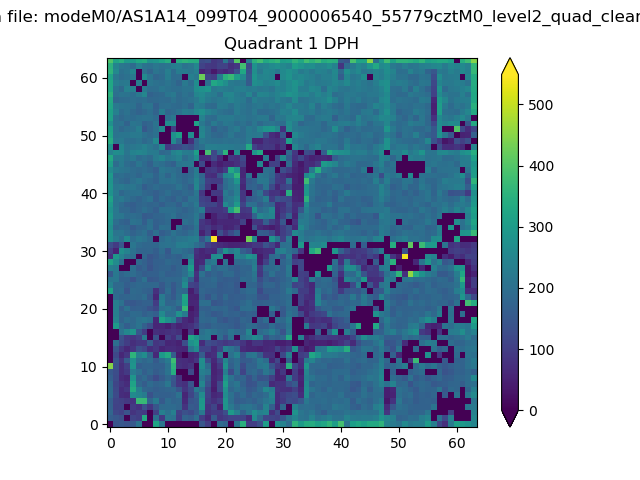 |
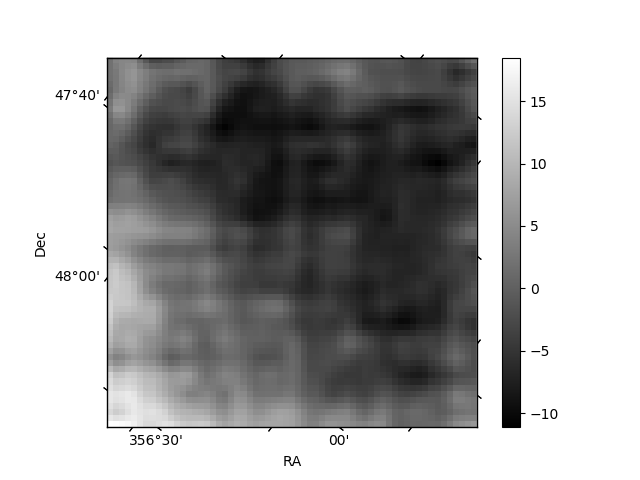
Quadrant B |
|---|---|---|---|
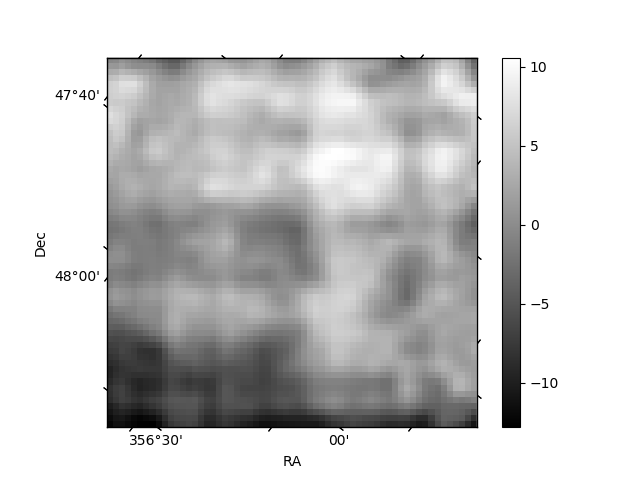
| Quadrant D | 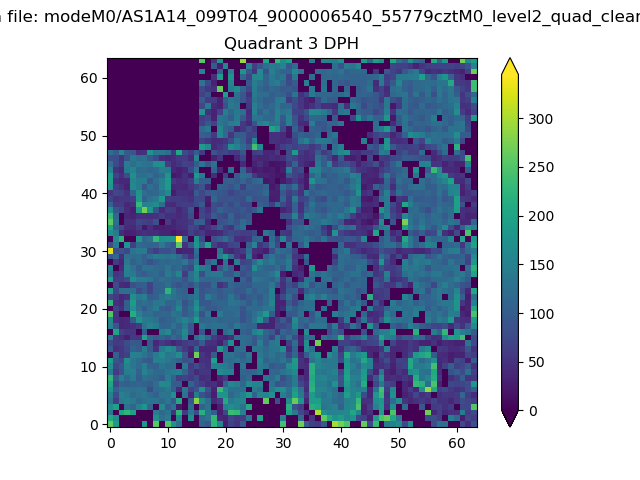 |
 |
Quadrant C |
| Plot type | Count rate plots | Images |
|---|---|---|
| Comparison with Poisson distribution Blue bars denote a histogram of data divided into 1 sec bins. Red curve is a Poisson curve with rate = median count rate of data. |
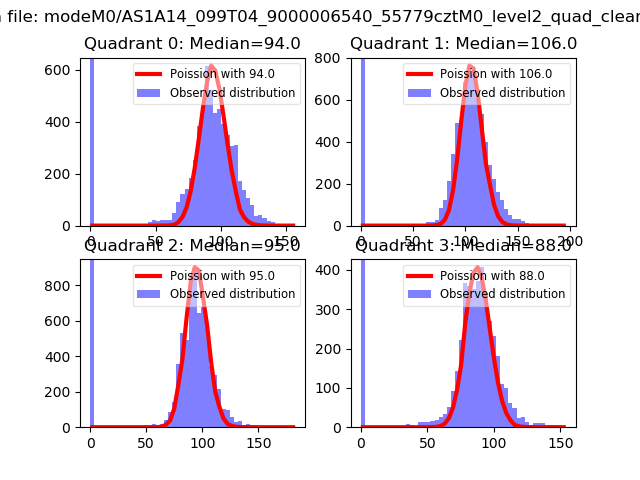 |
 |
| Quadrant-wise count rates Data is divided into 100 sec bins |
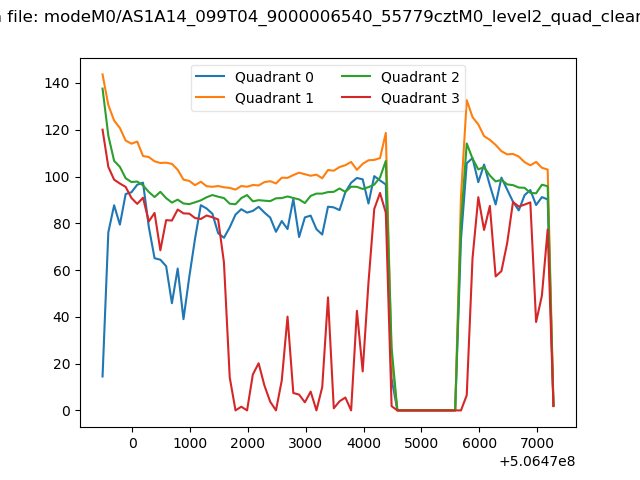 |
|
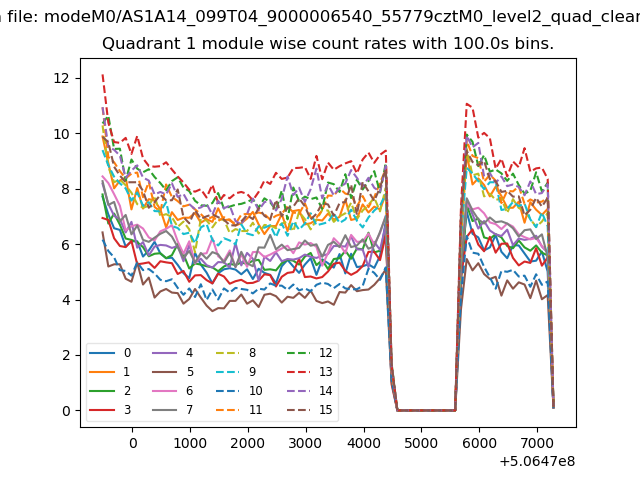
| Module-wise count rates for Quadrant A Data is divided into 100 sec bins |
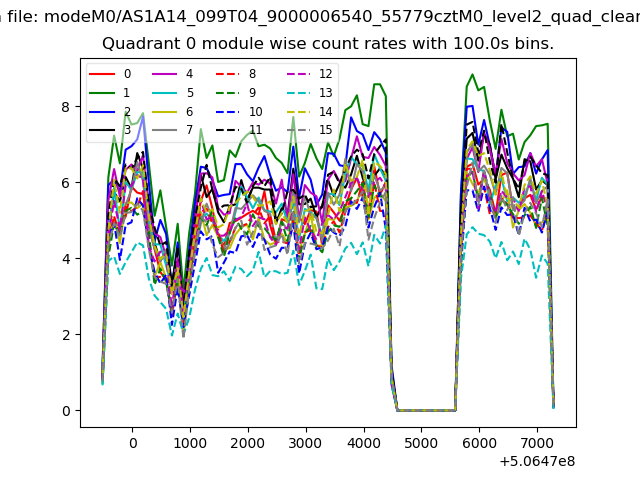 |
 |
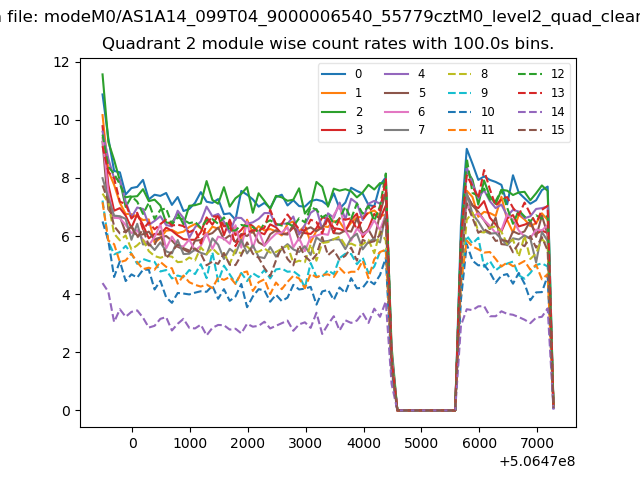
| Module-wise count rates for Quadrant B Data is divided into 100 sec bins |
 |
 |
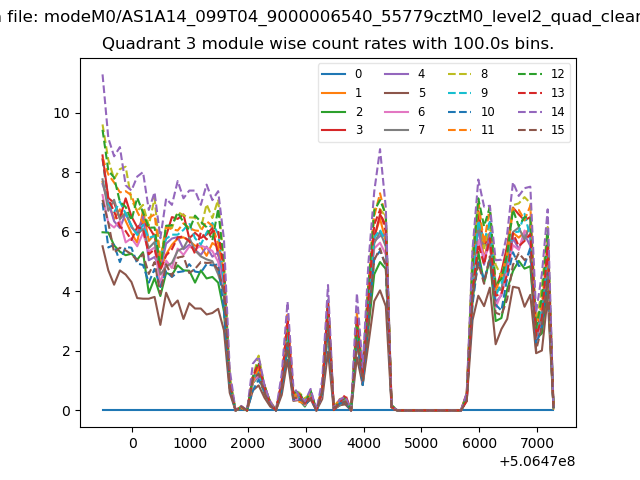
| Module-wise count rates for Quadrant C Data is divided into 100 sec bins |
 |
 |
| Module-wise count rates for Quadrant D Data is divided into 100 sec bins |
 |
 |
| Parameter | Plot |
|---|---|
| CZT HV Monitor | 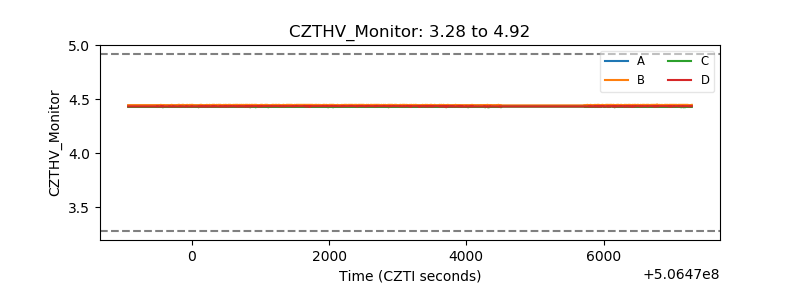 |
| D_VDD | 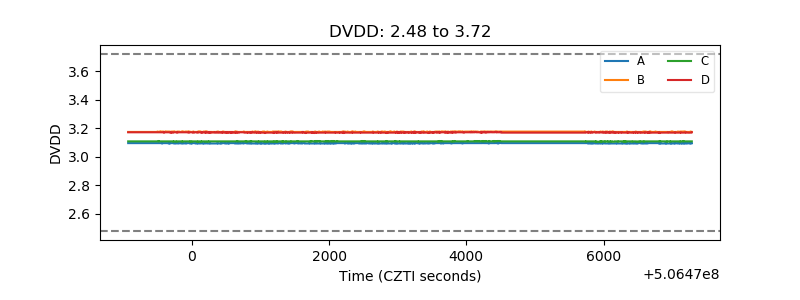 |
| Temperature 1 | 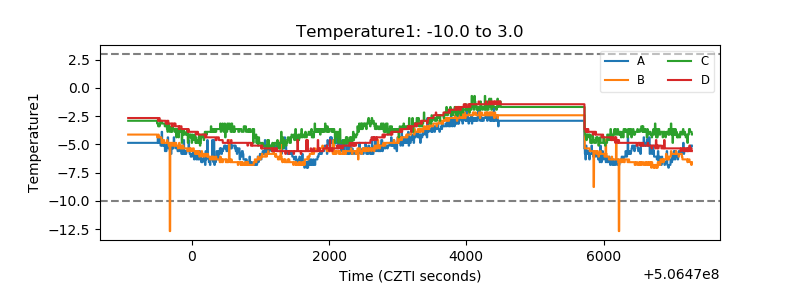 |
| Veto HV Monitor | 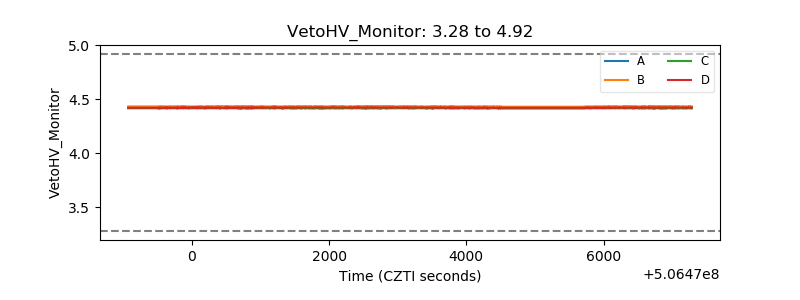 |
| Veto LLD | 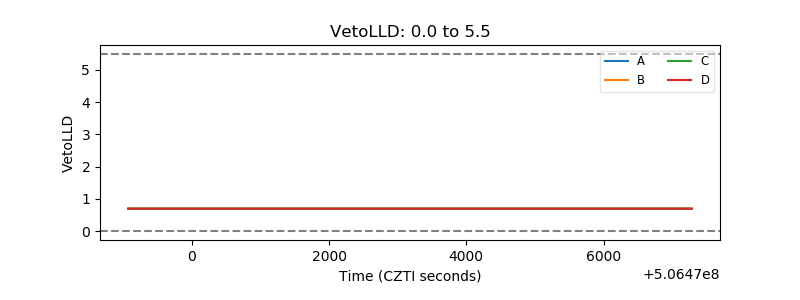 |
| Alpha Counter | 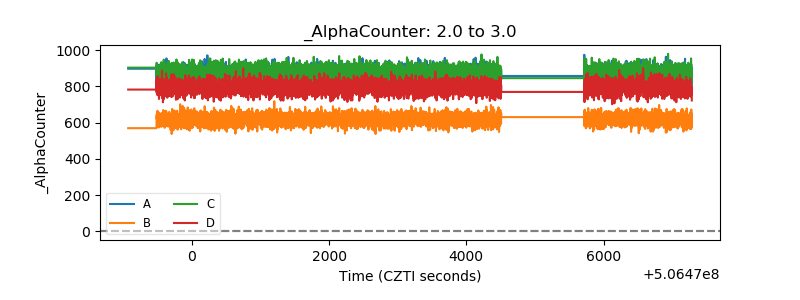 |
| _CPM_Rate | 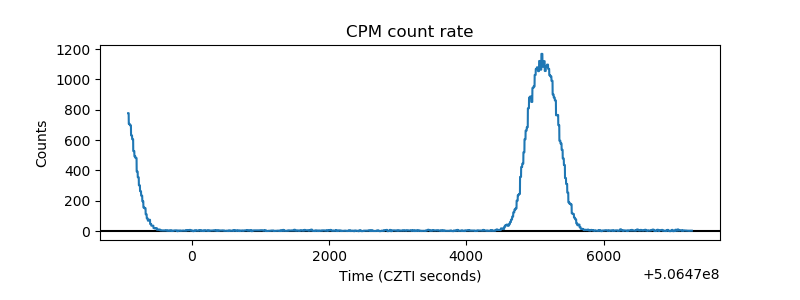 |
| CZT Counter | 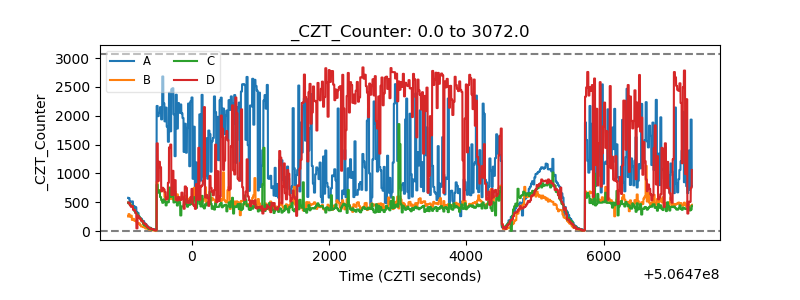 |
| +2.5 Volts monitor |  |
| +5 Volts monitor |  |
| _ROLL_ROT | 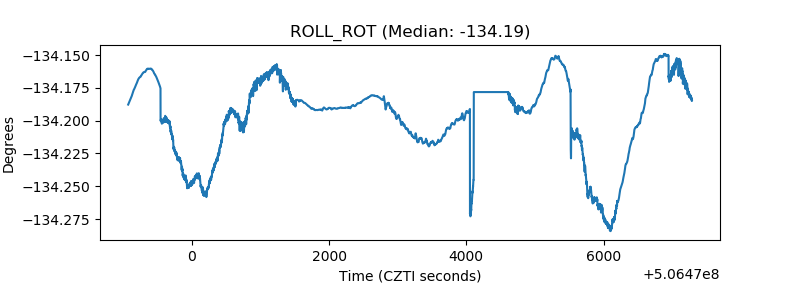 |
| _Roll_DEC | 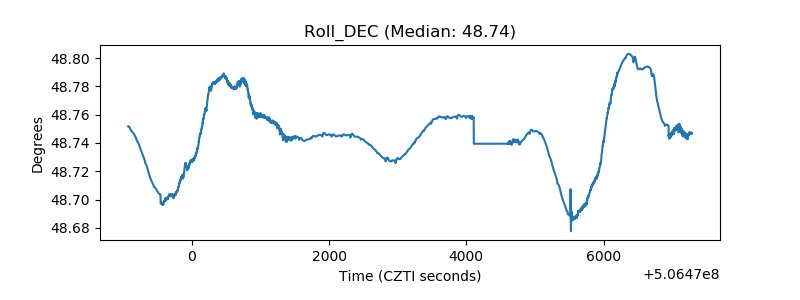 |
| _Roll_RA | 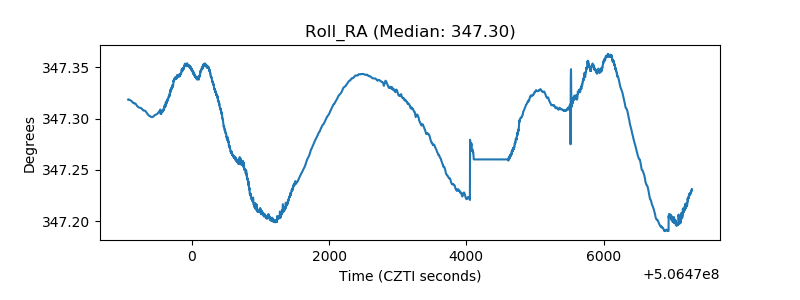 |
| Veto Counter | 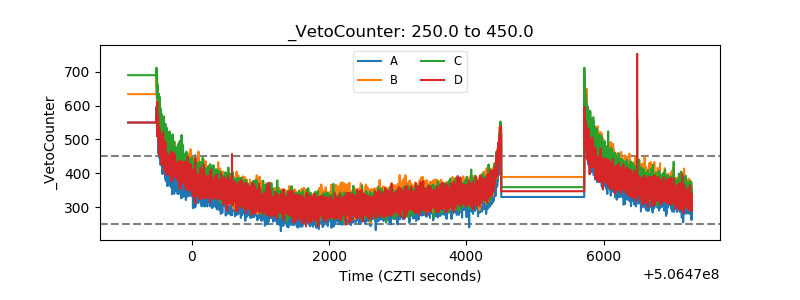 |