| Param | Original file | Final file |
|---|---|---|
| Filename | modeM0/AS1A14_099T04_9000006540_55781cztM0_level2.fits | modeM0/AS1A14_099T04_9000006540_55781cztM0_level2_quad_clean.evt |
| Size (bytes) | 542,234,880 | 95,186,880 |
| Size | 517.1 MB | 90.8 MB |
| Events in quadrant A | 5,371,050 | 609,713 |
| Events in quadrant B | 3,236,313 | 696,989 |
| Events in quadrant C | 3,012,687 | 630,967 |
| Events in quadrant D | 7,941,495 | 486,365 |
| Mode M0 | |||
|---|---|---|---|
| Quadrant | BADHDUFLAG | Total packets | Discarded packets |
| A | 0 | 20402 | 2 |
| B | 0 | 13696 | 2 |
| C | 0 | 14000 | 2 |
| D | 0 | 28163 | 2 |
| Mode M9 | |||
|---|---|---|---|
| Quadrant | BADHDUFLAG | Total packets | Discarded packets |
| A | 0 | 18 | 0 |
| B | 0 | 19 | 0 |
| C | 0 | 19 | 0 |
| D | 0 | 19 | 0 |
| Mode SS | |||
|---|---|---|---|
| Quadrant | BADHDUFLAG | Total packets | Discarded packets |
| A | 0 | 132 | 0 |
| B | 0 | 132 | 0 |
| C | 0 | 132 | 0 |
| D | 0 | 132 | 0 |
| Quadrant | Total seconds | Saturated seconds | Saturation percentage |
|---|---|---|---|
| A | 6577 | 458 | 6.963661% |
| B | 6577 | 79 | 1.201156% |
| C | 6577 | 55 | 0.836248% |
| D | 6577 | 1295 | 19.689828% |
Noise dominated data is calculated using 1-second bins in cleaned event files. If a bin has >2000 counts, and if more than 50% of those come from <1% of pixels, then it is considered to be noise-dominated and hence unusable.
| Quadrant | # 1 sec bins | Bins with >0 counts | Bins with >2000 counts | High rate bins dominated by noise | Noise dominated (total time) | Noise dominated (detector-on time) | Marked lightcurve |
|---|---|---|---|---|---|---|---|
| A | 7726 | 6578 | 311 | 311 | 4.03% | 4.73% | 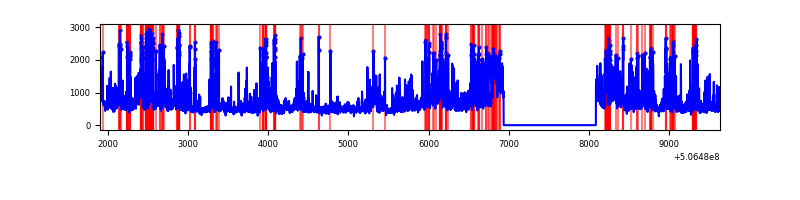 |
| B | 7726 | 6576 | 0 | 0 | 0.00% | 0.00% | 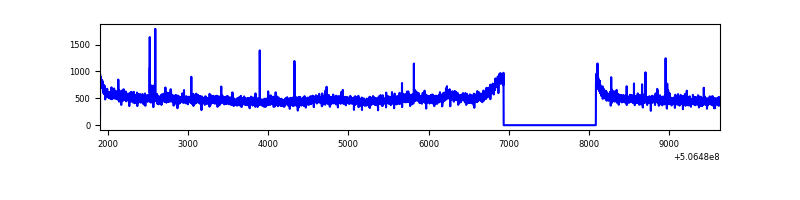 |
| C | 7726 | 6576 | 42 | 42 | 0.54% | 0.64% | 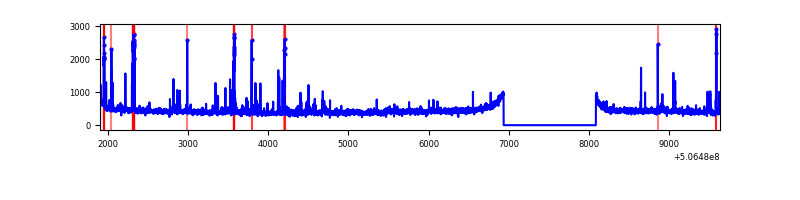 |
| D | 7726 | 6576 | 1355 | 1355 | 17.54% | 20.61% | 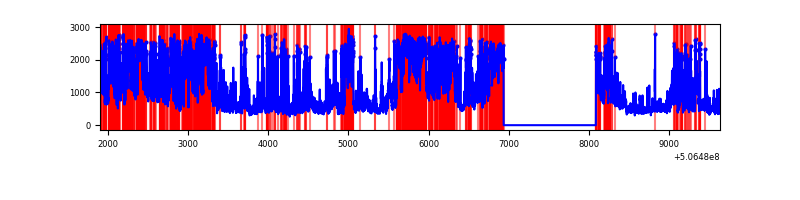 |
Top three noisy pixels from each quadrant. If the there are fewer than three noisy pixels in the level2.evt file, extra rows are filled as -1
| Pixel properties | Quadrant properties | ||||||
|---|---|---|---|---|---|---|---|
| Quadrant | DetID | PixID | Counts | Sigma | Mean | Median | Sigma |
| A | 15 | 32 | 852284 | 4918.87 | 696 | 678 | 173.1 |
| A | 7 | 64 | 658310 | 3798.47 | 696 | 678 | 173.1 |
| A | 0 | 8 | 246098 | 1417.54 | 696 | 678 | 173.1 |
| B | 5 | 172 | 351925 | 2282.59 | 711 | 684 | 153.9 |
| B | 7 | 0 | 40689 | 259.98 | 711 | 684 | 153.9 |
| B | 12 | 111 | 18503 | 115.8 | 711 | 684 | 153.9 |
| C | 12 | 250 | 116710 | 600.49 | 701 | 694 | 193.2 |
| C | 14 | 254 | 40153 | 204.24 | 701 | 694 | 193.2 |
| C | 6 | 223 | 38739 | 196.92 | 701 | 694 | 193.2 |
| D | 11 | 129 | 4200304 | 23222.35 | 636 | 608 | 180.8 |
| D | 7 | 70 | 521011 | 2877.58 | 636 | 608 | 180.8 |
| D | 8 | 245 | 505517 | 2791.91 | 636 | 608 | 180.8 |
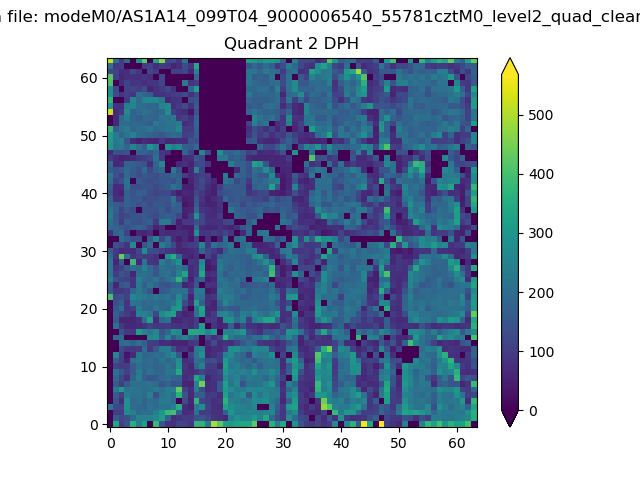
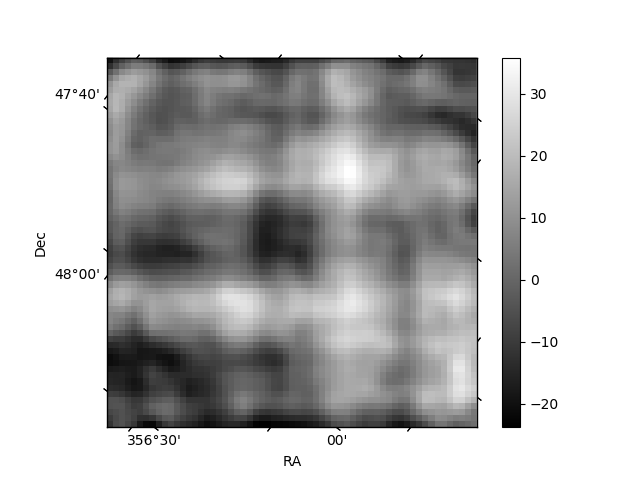
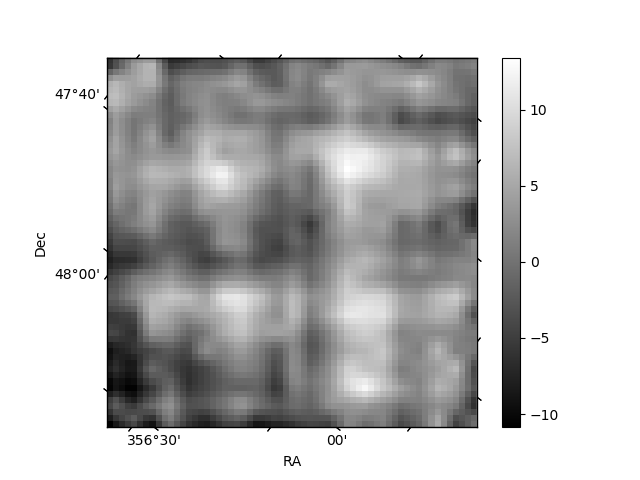
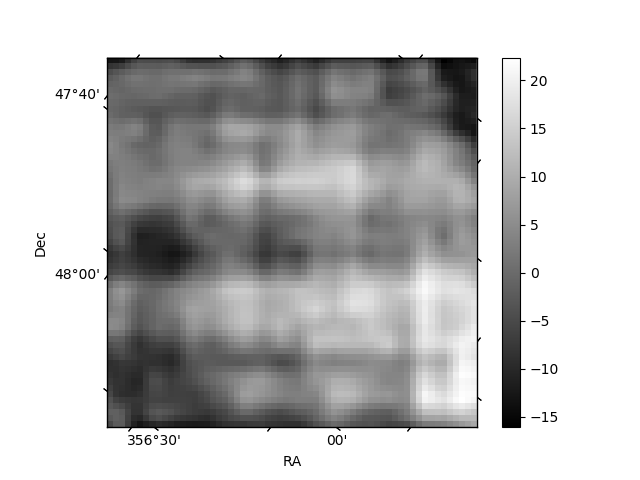
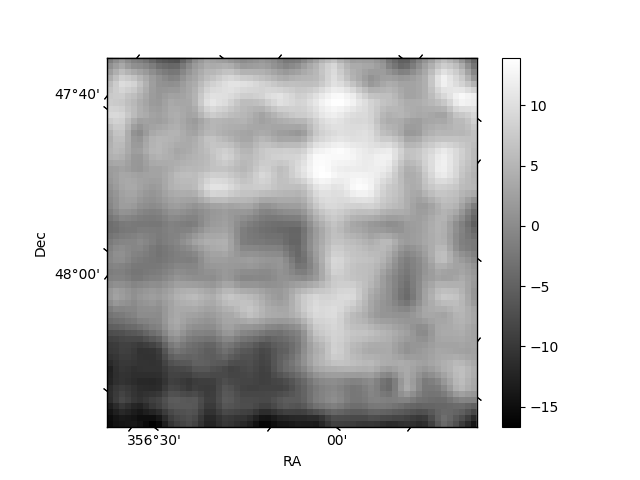
Histogram calculated using DETX and DETY for each event in the final _common_clean file
| Quadrant A | 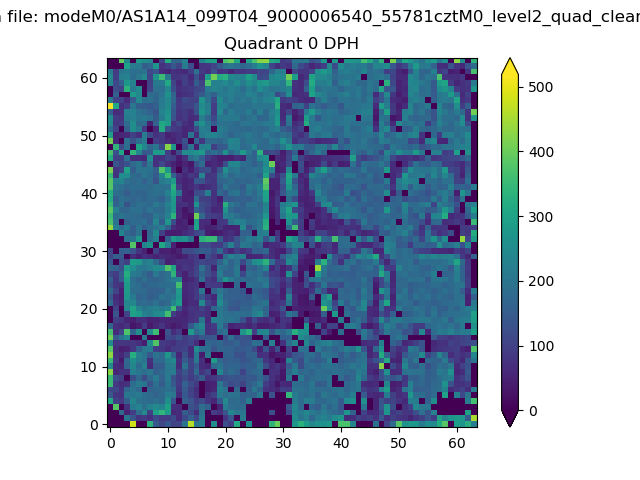 |
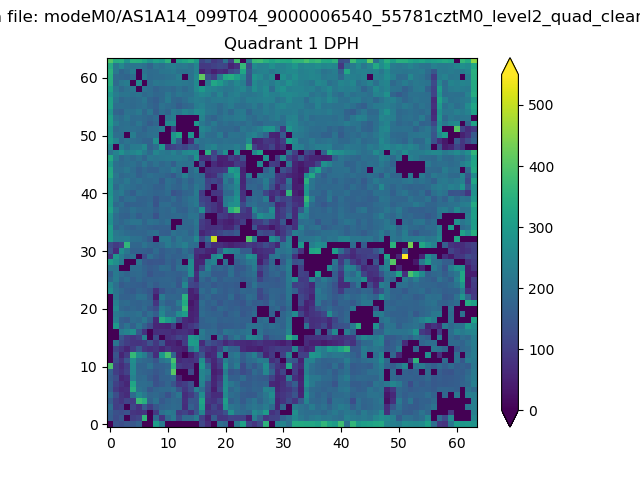 |
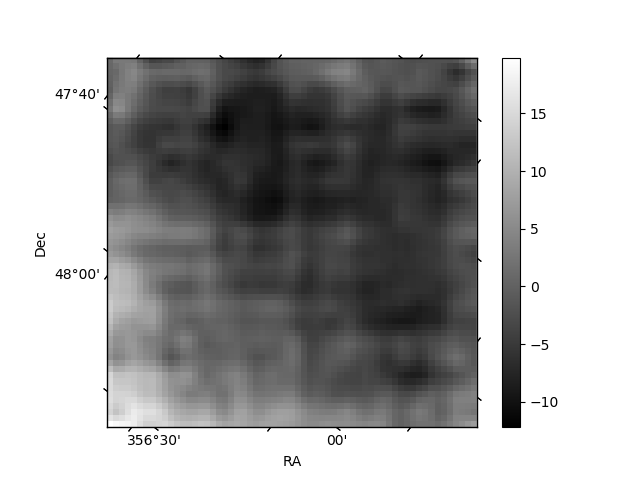
Quadrant B |
|---|---|---|---|
| Quadrant D | 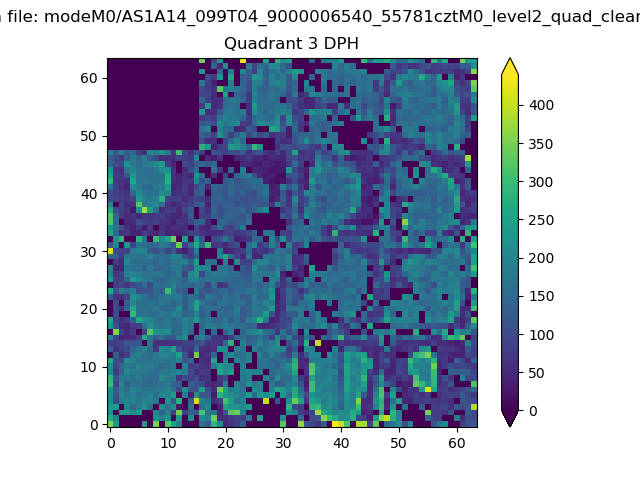 |
 |
Quadrant C |
| Plot type | Count rate plots | Images |
|---|---|---|
| Comparison with Poisson distribution Blue bars denote a histogram of data divided into 1 sec bins. Red curve is a Poisson curve with rate = median count rate of data. |
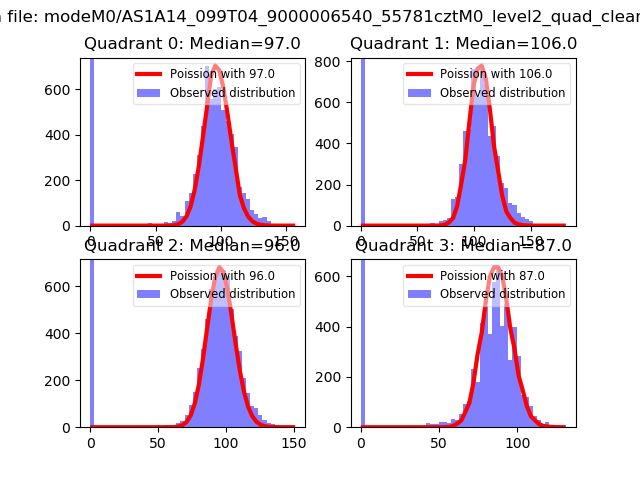 |
 |
| Quadrant-wise count rates Data is divided into 100 sec bins |
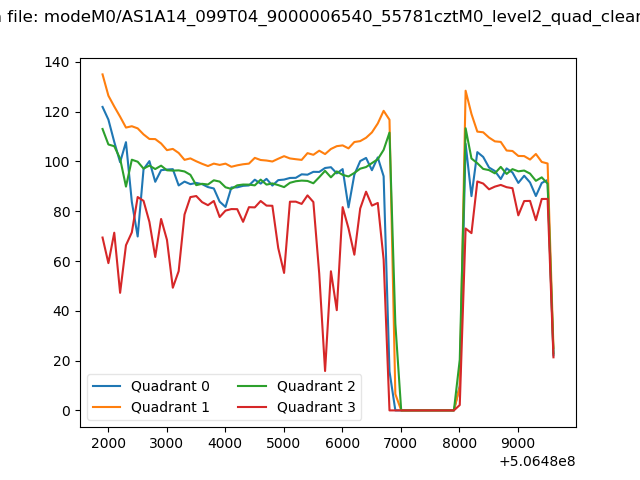 |
|
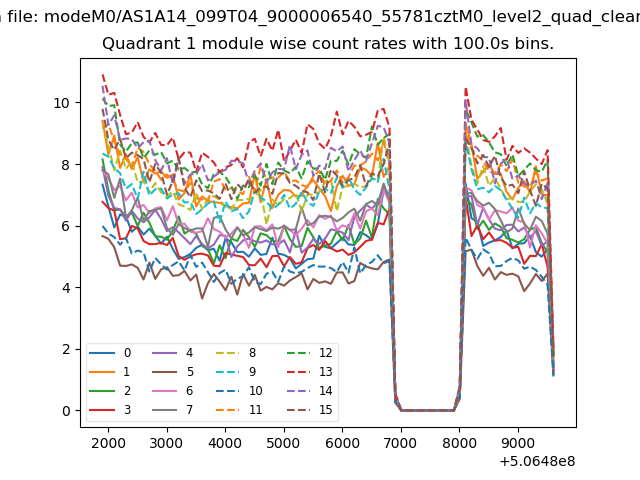
| Module-wise count rates for Quadrant A Data is divided into 100 sec bins |
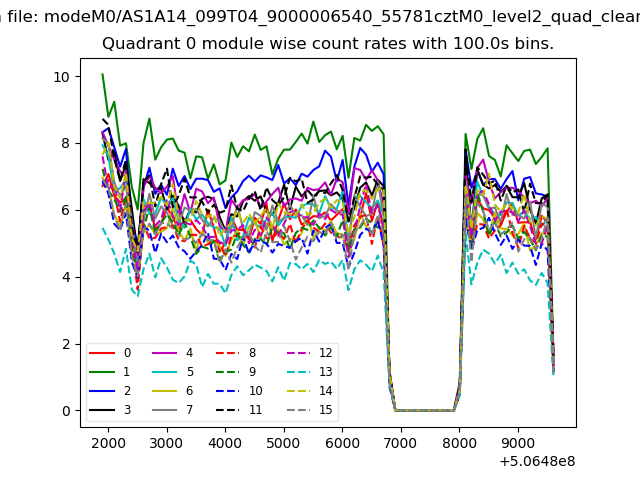 |
 |
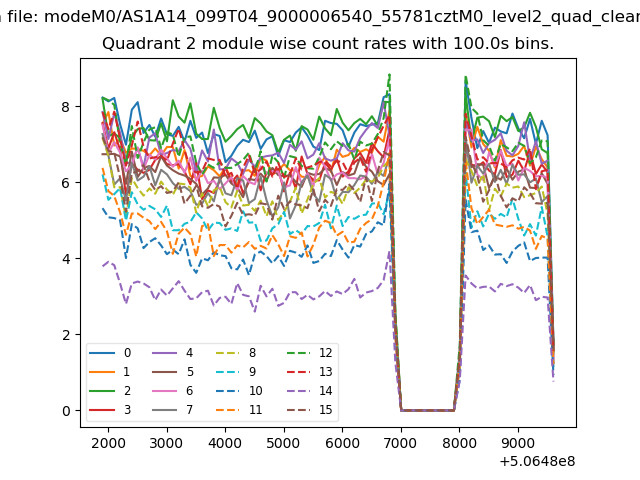
| Module-wise count rates for Quadrant B Data is divided into 100 sec bins |
 |
 |
| Module-wise count rates for Quadrant C Data is divided into 100 sec bins |
 |
 |
| Module-wise count rates for Quadrant D Data is divided into 100 sec bins |
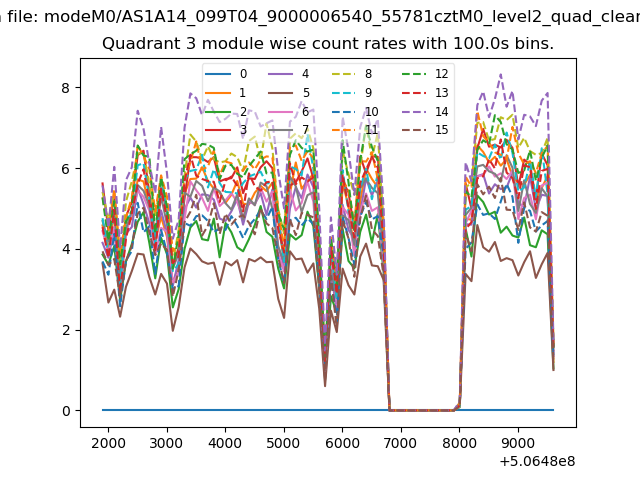 |
 |
| Parameter | Plot |
|---|---|
| CZT HV Monitor | 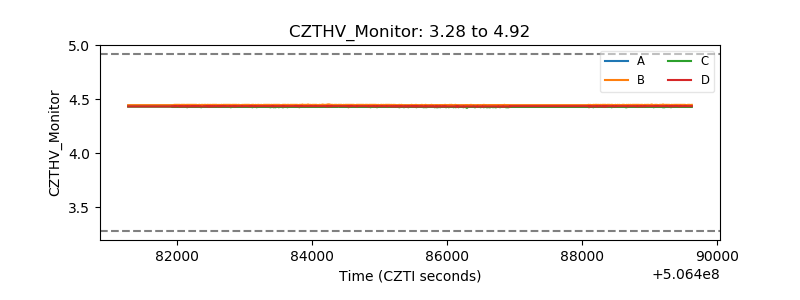 |
| D_VDD | 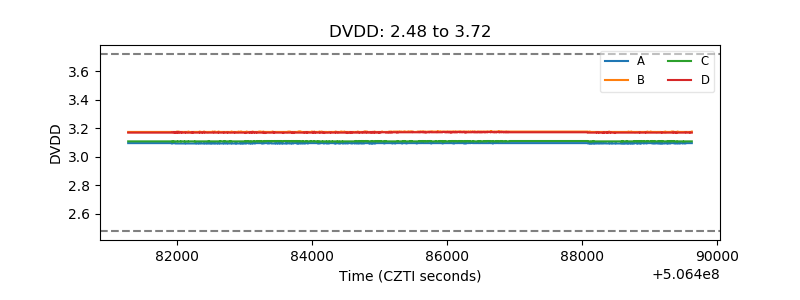 |
| Temperature 1 | 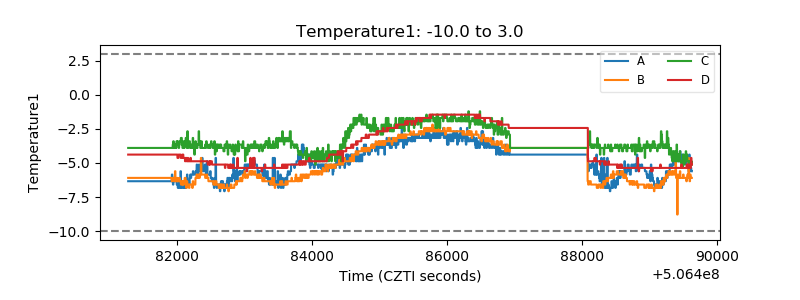 |
| Veto HV Monitor | 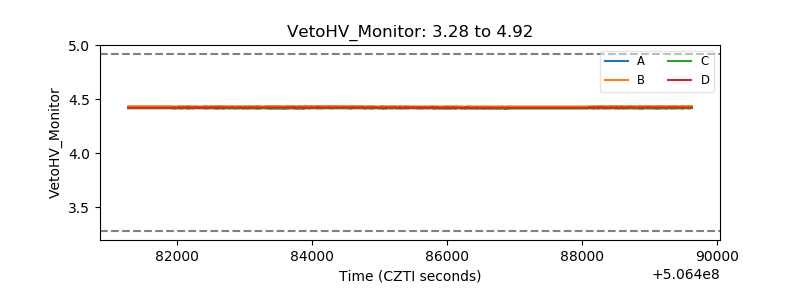 |
| Veto LLD | 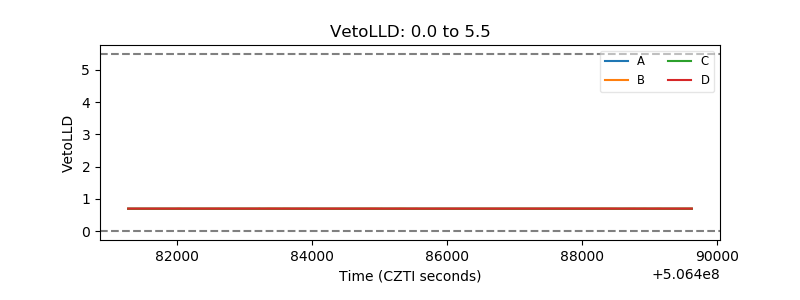 |
| Alpha Counter | 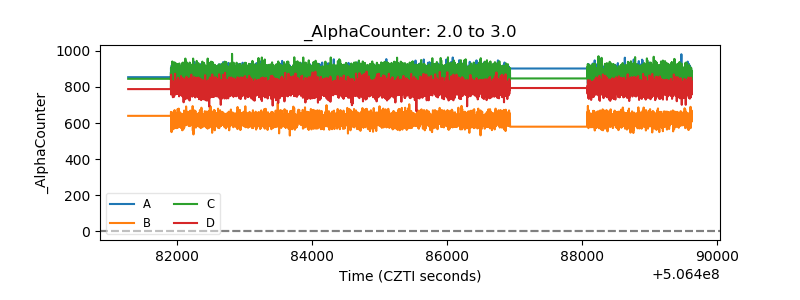 |
| _CPM_Rate | 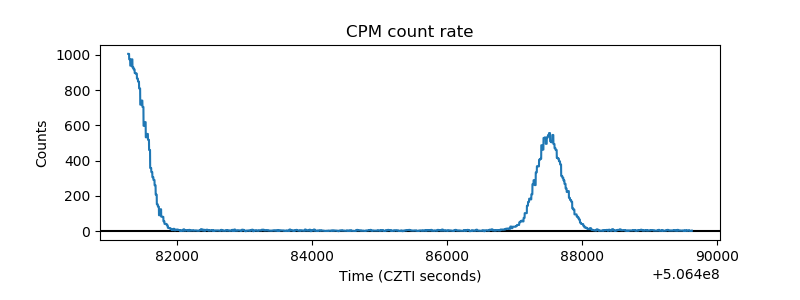 |
| CZT Counter | 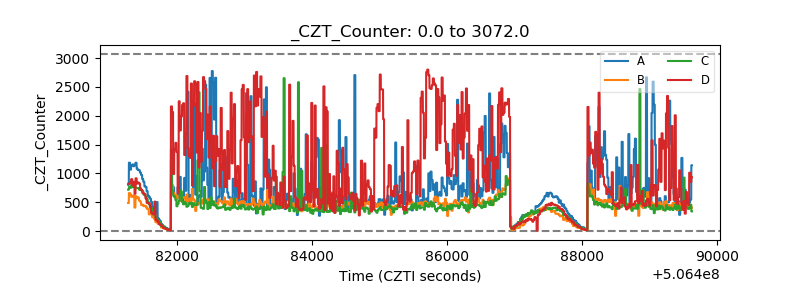 |
| +2.5 Volts monitor |  |
| +5 Volts monitor |  |
| _ROLL_ROT | 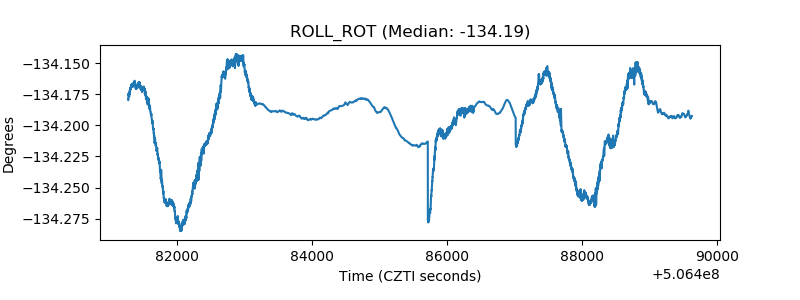 |
| _Roll_DEC | 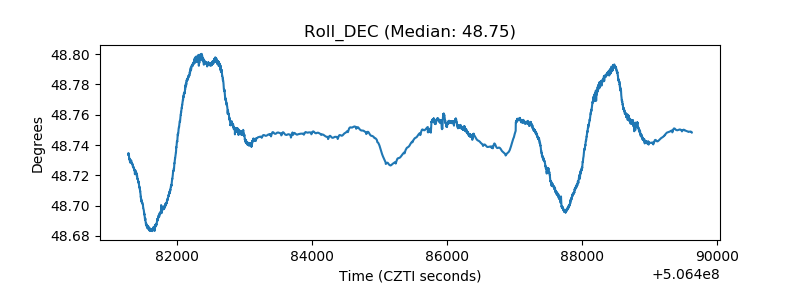 |
| _Roll_RA | 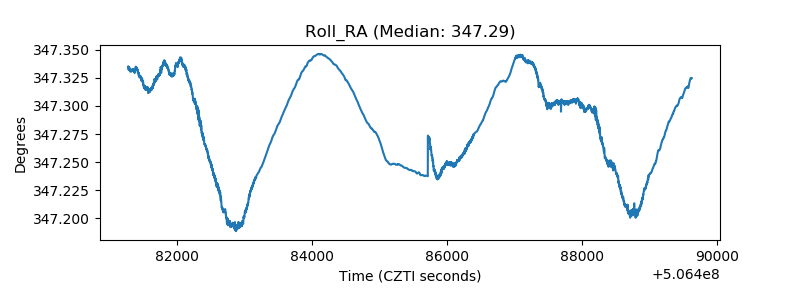 |
| Veto Counter | 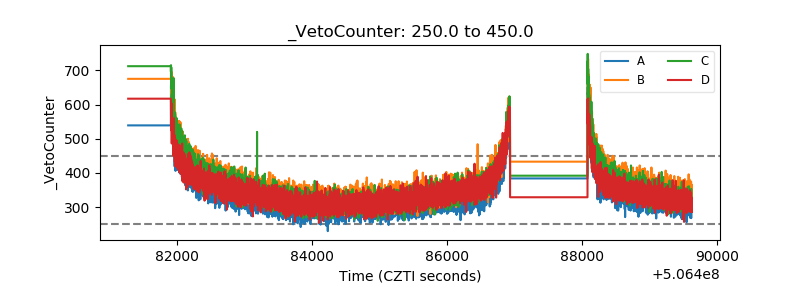 |