| Param | Original file | Final file |
|---|---|---|
| Filename | modeM0/AS1A14_099T04_9000006540_55782cztM0_level2.fits | modeM0/AS1A14_099T04_9000006540_55782cztM0_level2_quad_clean.evt |
| Size (bytes) | 608,656,320 | 89,559,360 |
| Size | 580.5 MB | 85.4 MB |
| Events in quadrant A | 6,122,421 | 599,459 |
| Events in quadrant B | 3,241,770 | 678,183 |
| Events in quadrant C | 2,993,031 | 621,085 |
| Events in quadrant D | 9,657,072 | 349,921 |
| Mode M0 | |||
|---|---|---|---|
| Quadrant | BADHDUFLAG | Total packets | Discarded packets |
| A | 0 | 22765 | 2 |
| B | 0 | 13984 | 2 |
| C | 0 | 14201 | 2 |
| D | 0 | 33253 | 2 |
| Mode M9 | |||
|---|---|---|---|
| Quadrant | BADHDUFLAG | Total packets | Discarded packets |
| A | 0 | 19 | 0 |
| B | 0 | 19 | 0 |
| C | 0 | 20 | 0 |
| D | 0 | 20 | 0 |
| Mode SS | |||
|---|---|---|---|
| Quadrant | BADHDUFLAG | Total packets | Discarded packets |
| A | 0 | 134 | 0 |
| B | 0 | 134 | 0 |
| C | 0 | 134 | 0 |
| D | 0 | 134 | 0 |
| Quadrant | Total seconds | Saturated seconds | Saturation percentage |
|---|---|---|---|
| A | 6645 | 557 | 8.382242% |
| B | 6645 | 132 | 1.986456% |
| C | 6645 | 78 | 1.173815% |
| D | 6645 | 2742 | 41.264108% |
Noise dominated data is calculated using 1-second bins in cleaned event files. If a bin has >2000 counts, and if more than 50% of those come from <1% of pixels, then it is considered to be noise-dominated and hence unusable.
| Quadrant | # 1 sec bins | Bins with >0 counts | Bins with >2000 counts | High rate bins dominated by noise | Noise dominated (total time) | Noise dominated (detector-on time) | Marked lightcurve |
|---|---|---|---|---|---|---|---|
| A | 7640 | 6646 | 460 | 460 | 6.02% | 6.92% | 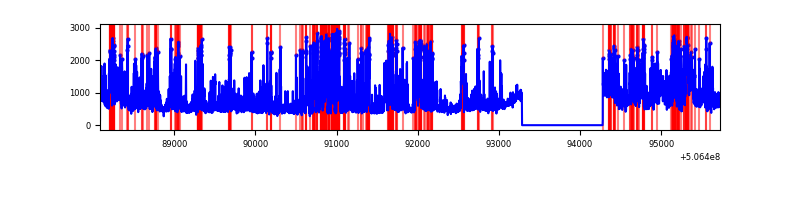 |
| B | 7639 | 6645 | 1 | 1 | 0.01% | 0.02% | 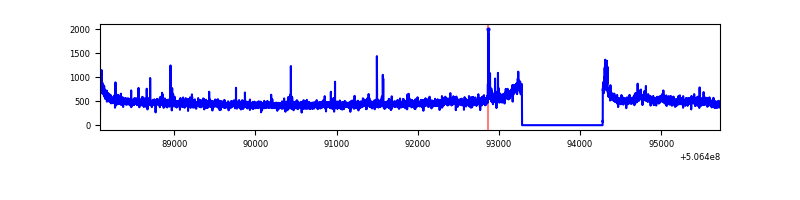 |
| C | 7639 | 6645 | 48 | 48 | 0.63% | 0.72% | 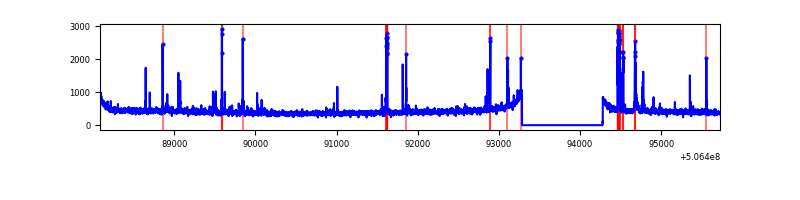 |
| D | 7639 | 6645 | 2381 | 2381 | 31.17% | 35.83% | 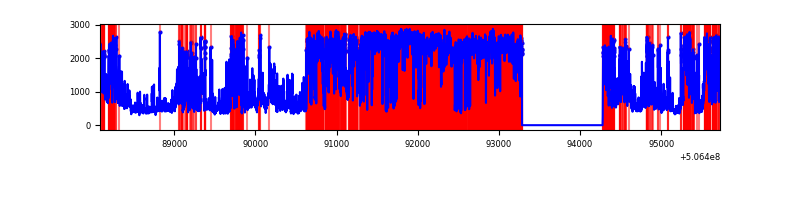 |
Top three noisy pixels from each quadrant. If the there are fewer than three noisy pixels in the level2.evt file, extra rows are filled as -1
| Pixel properties | Quadrant properties | ||||||
|---|---|---|---|---|---|---|---|
| Quadrant | DetID | PixID | Counts | Sigma | Mean | Median | Sigma |
| A | 15 | 32 | 1641342 | 9541.11 | 700 | 681 | 172.0 |
| A | 7 | 64 | 702599 | 4081.94 | 700 | 681 | 172.0 |
| A | 12 | 115 | 411638 | 2389.88 | 700 | 681 | 172.0 |
| B | 5 | 172 | 374086 | 2431.99 | 712 | 685 | 153.5 |
| B | 12 | 111 | 18769 | 117.78 | 712 | 685 | 153.5 |
| B | 7 | 252 | 17805 | 111.5 | 712 | 685 | 153.5 |
| C | 12 | 250 | 163635 | 852.38 | 700 | 694 | 191.2 |
| C | 15 | 199 | 61904 | 320.2 | 700 | 694 | 191.2 |
| C | 6 | 223 | 18147 | 91.3 | 700 | 694 | 191.2 |
| D | 11 | 129 | 7244213 | 51464.51 | 493 | 471 | 140.8 |
| D | 8 | 245 | 175289 | 1242.03 | 493 | 471 | 140.8 |
| D | 2 | 249 | 76692 | 541.53 | 493 | 471 | 140.8 |
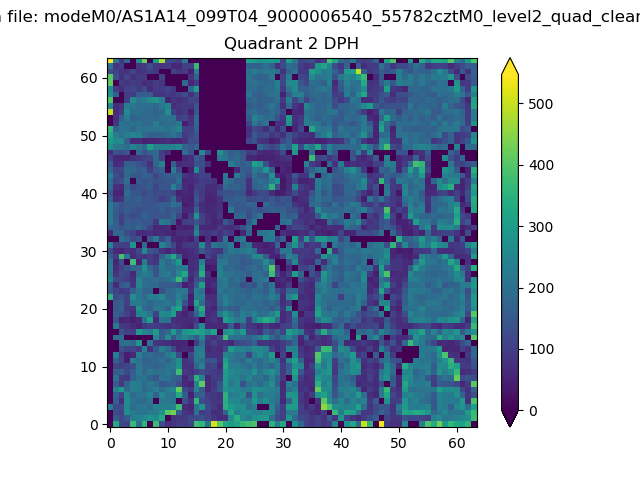
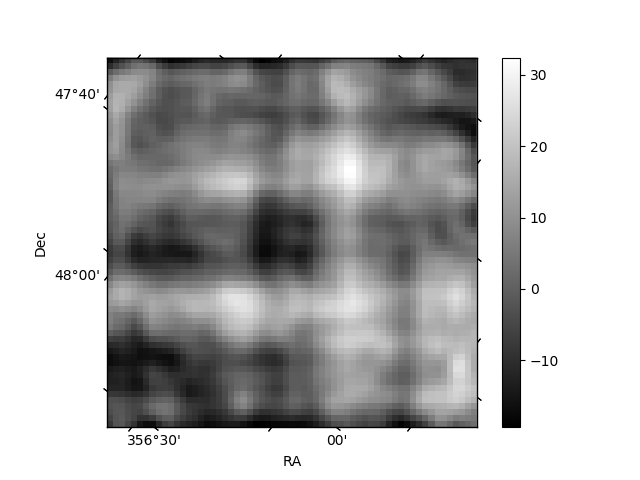
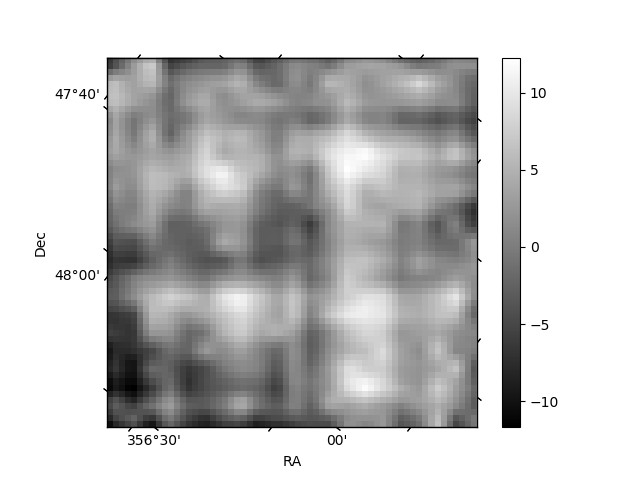
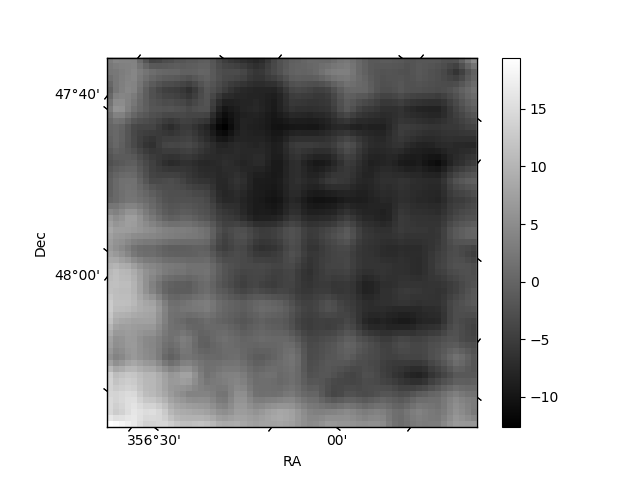
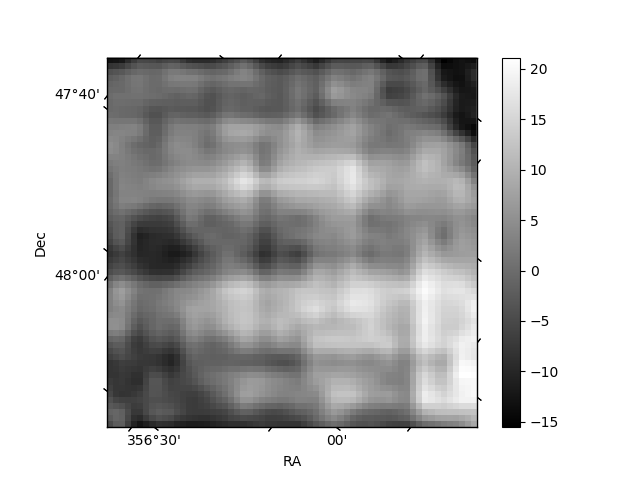
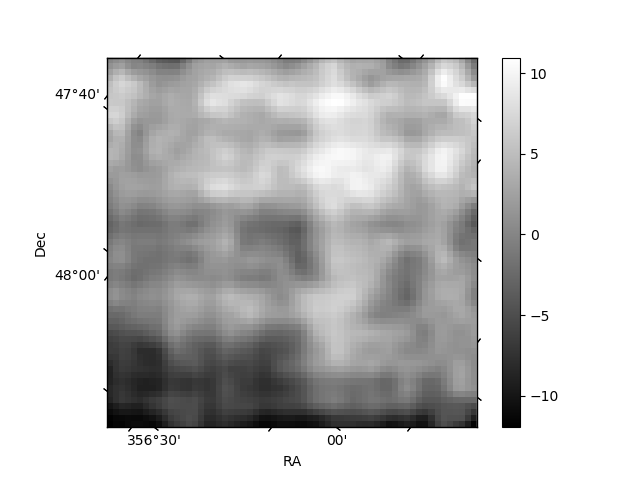
Histogram calculated using DETX and DETY for each event in the final _common_clean file
| Quadrant A | 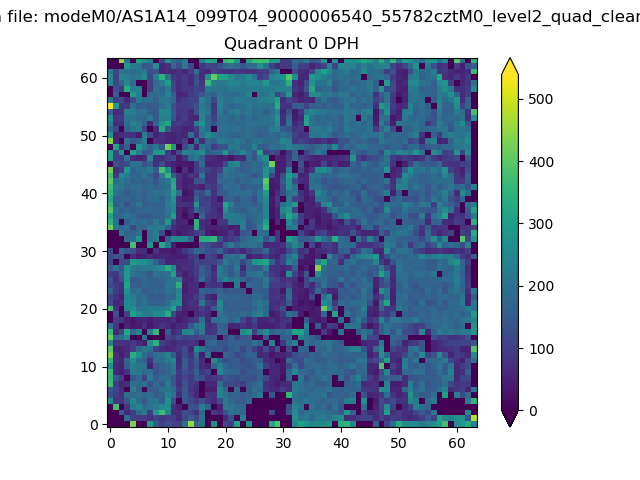 |
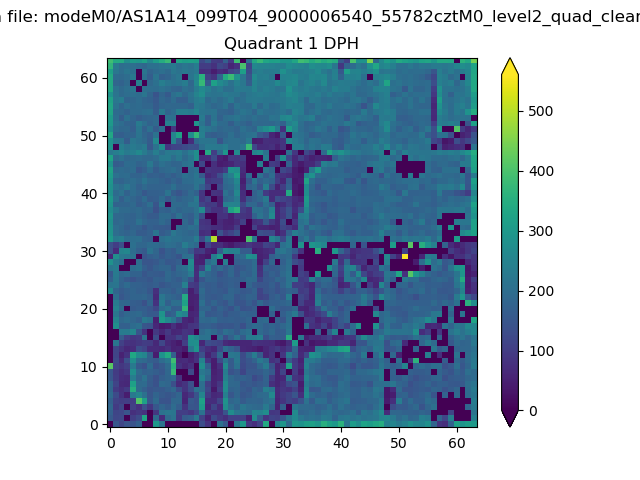 |
Quadrant B |
|---|---|---|---|
| Quadrant D | 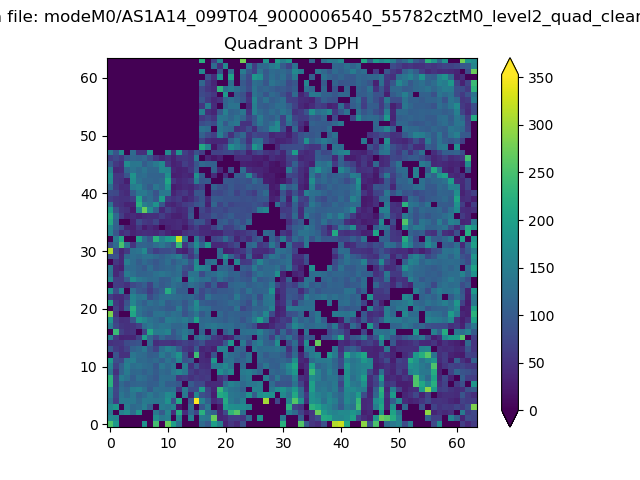 |
 |
Quadrant C |
| Plot type | Count rate plots | Images |
|---|---|---|
| Comparison with Poisson distribution Blue bars denote a histogram of data divided into 1 sec bins. Red curve is a Poisson curve with rate = median count rate of data. |
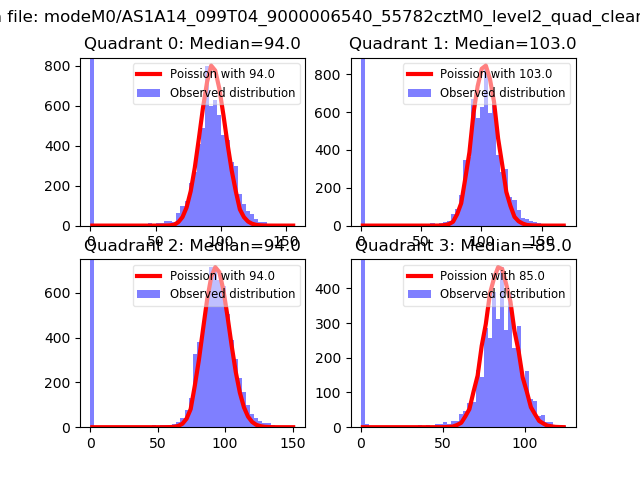 |
 |
| Quadrant-wise count rates Data is divided into 100 sec bins |
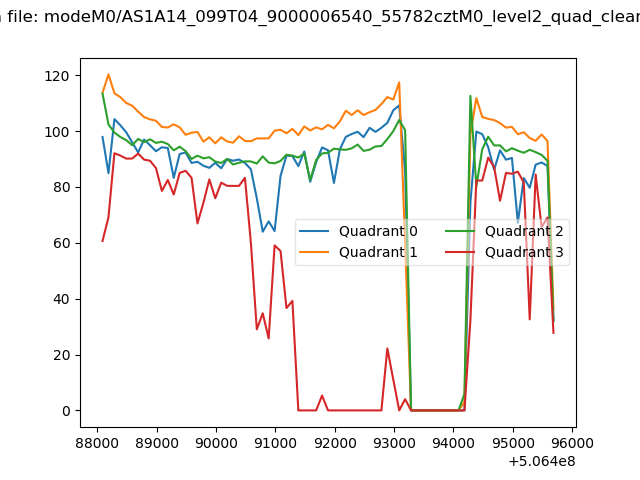 |
|
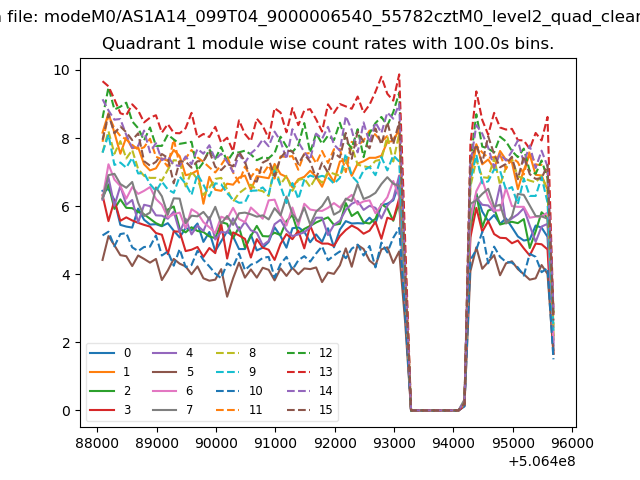
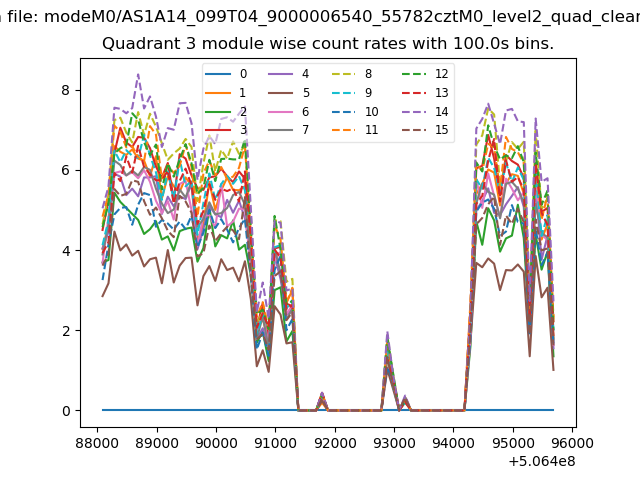
| Module-wise count rates for Quadrant A Data is divided into 100 sec bins |
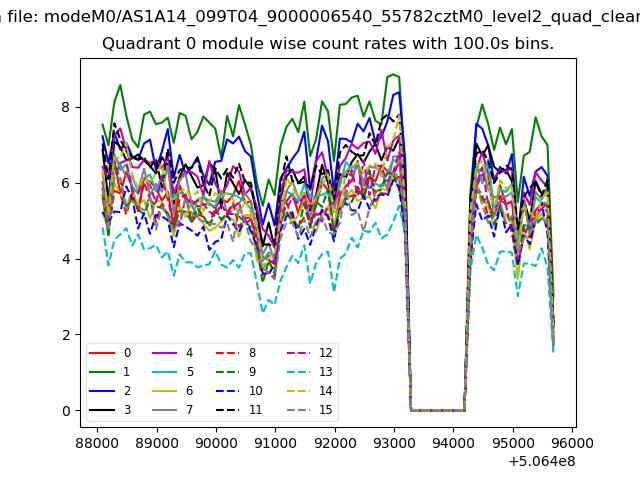 |
 |
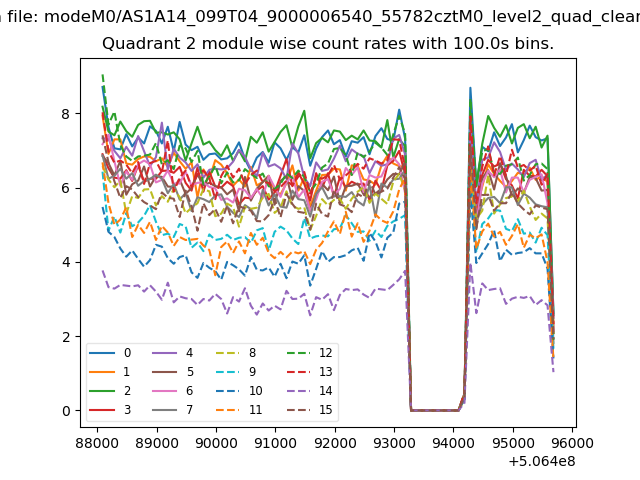
| Module-wise count rates for Quadrant B Data is divided into 100 sec bins |
 |
 |
| Module-wise count rates for Quadrant C Data is divided into 100 sec bins |
 |
 |
| Module-wise count rates for Quadrant D Data is divided into 100 sec bins |
 |
 |
| Parameter | Plot |
|---|---|
| CZT HV Monitor | 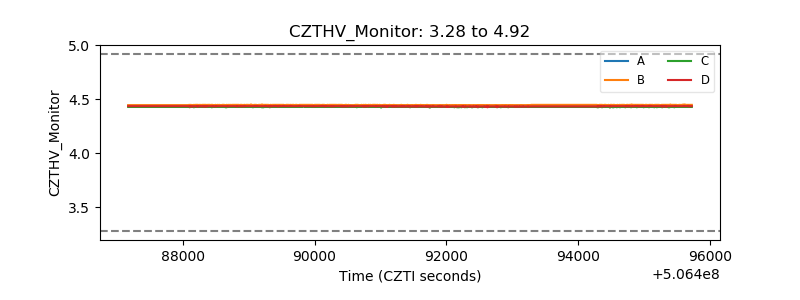 |
| D_VDD | 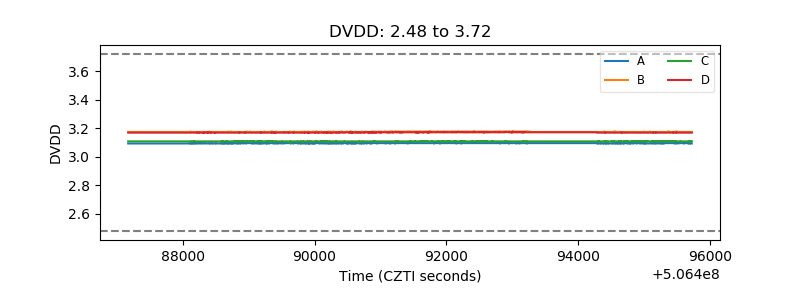 |
| Temperature 1 | 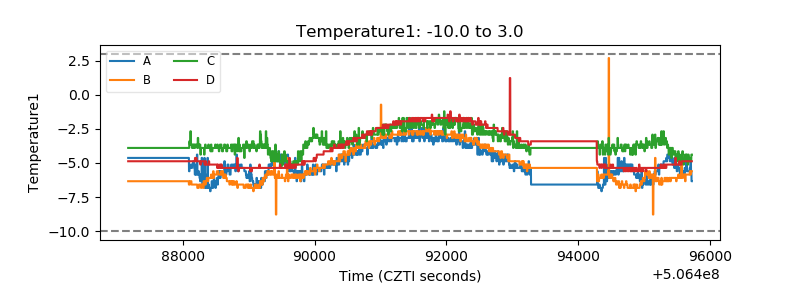 |
| Veto HV Monitor | 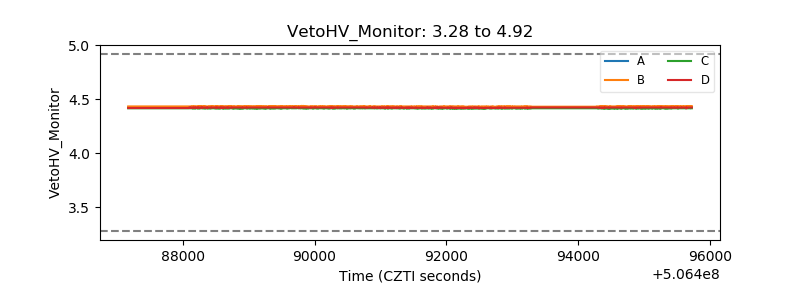 |
| Veto LLD | 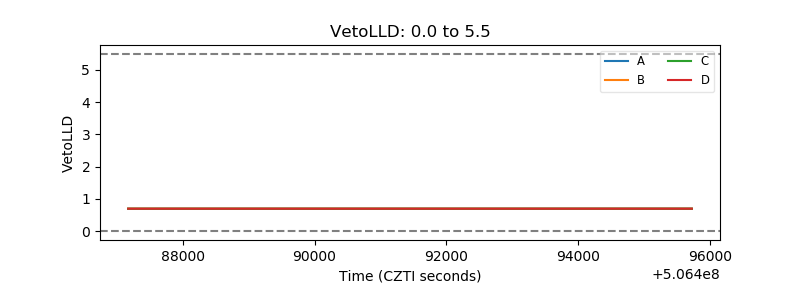 |
| Alpha Counter | 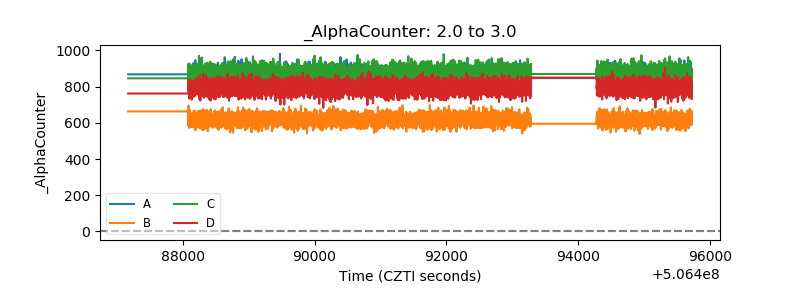 |
| _CPM_Rate | 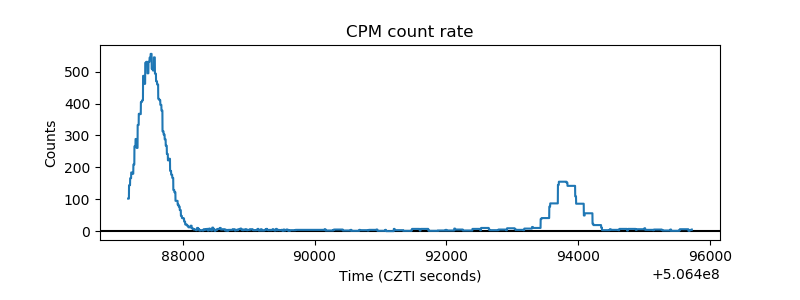 |
| CZT Counter | 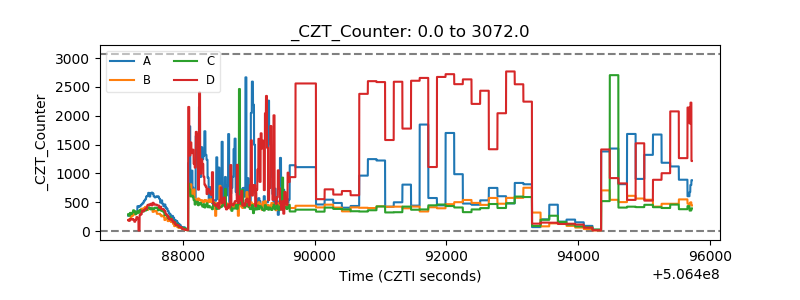 |
| +2.5 Volts monitor |  |
| +5 Volts monitor |  |
| _ROLL_ROT | 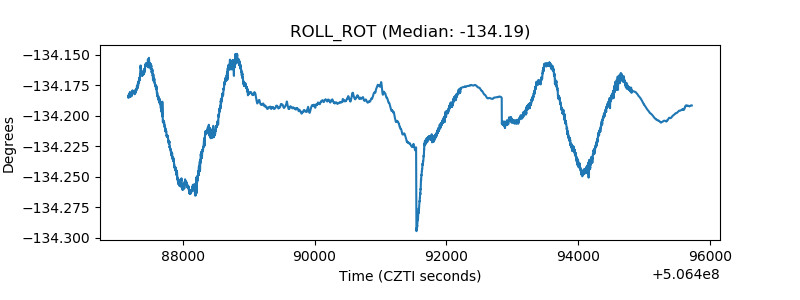 |
| _Roll_DEC | 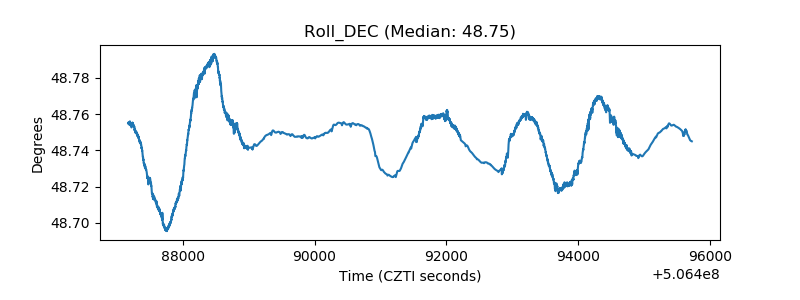 |
| _Roll_RA | 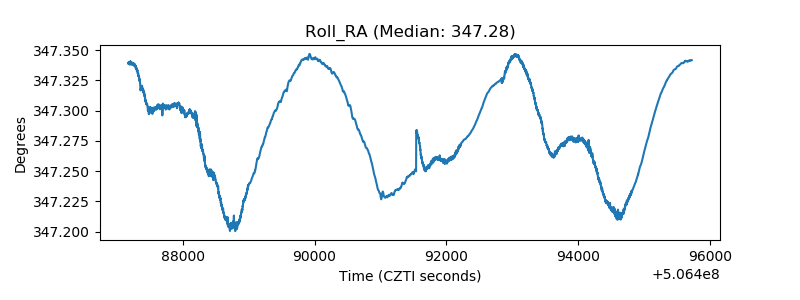 |
| Veto Counter | 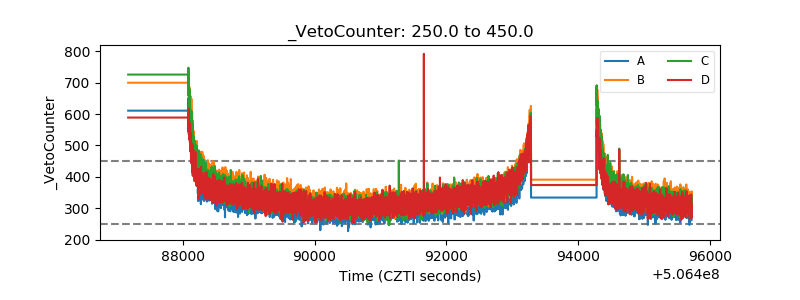 |