| Param | Original file | Final file |
|---|---|---|
| Filename | modeM0/AS1A14_099T04_9000006540_55783cztM0_level2.fits | modeM0/AS1A14_099T04_9000006540_55783cztM0_level2_quad_clean.evt |
| Size (bytes) | 344,030,400 | 49,124,160 |
| Size | 328.1 MB | 46.8 MB |
| Events in quadrant A | 3,437,627 | 313,422 |
| Events in quadrant B | 1,889,942 | 358,711 |
| Events in quadrant C | 1,626,604 | 322,541 |
| Events in quadrant D | 5,495,636 | 233,680 |
| Mode M0 | |||
|---|---|---|---|
| Quadrant | BADHDUFLAG | Total packets | Discarded packets |
| A | 0 | 12783 | 0 |
| B | 0 | 7778 | 0 |
| C | 0 | 8004 | 0 |
| D | 0 | 18848 | 0 |
| Mode SS | |||
|---|---|---|---|
| Quadrant | BADHDUFLAG | Total packets | Discarded packets |
| A | 0 | 74 | 0 |
| B | 0 | 74 | 0 |
| C | 0 | 74 | 0 |
| D | 0 | 74 | 0 |
| Quadrant | Total seconds | Saturated seconds | Saturation percentage |
|---|---|---|---|
| A | 3658 | 277 | 7.572444% |
| B | 3658 | 3 | 0.082012% |
| C | 3659 | 77 | 2.104400% |
| D | 3659 | 1036 | 28.313747% |
Noise dominated data is calculated using 1-second bins in cleaned event files. If a bin has >2000 counts, and if more than 50% of those come from <1% of pixels, then it is considered to be noise-dominated and hence unusable.
| Quadrant | # 1 sec bins | Bins with >0 counts | Bins with >2000 counts | High rate bins dominated by noise | Noise dominated (total time) | Noise dominated (detector-on time) | Marked lightcurve |
|---|---|---|---|---|---|---|---|
| A | 3658 | 3658 | 230 | 230 | 6.29% | 6.29% | 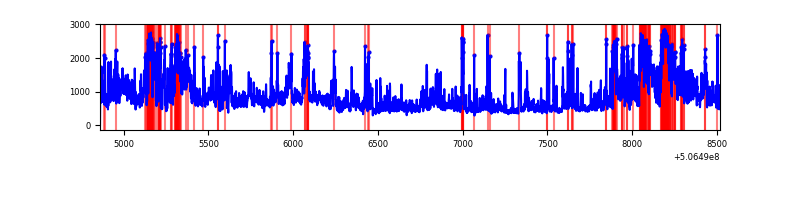 |
| B | 3658 | 3658 | 3 | 3 | 0.08% | 0.08% | 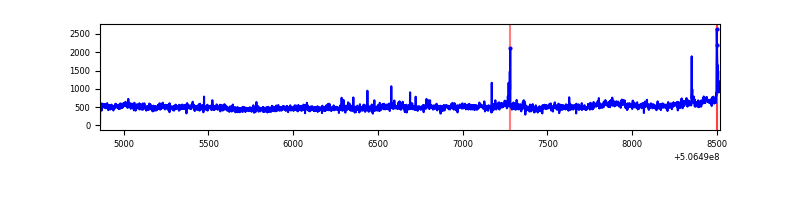 |
| C | 3659 | 3659 | 78 | 78 | 2.13% | 2.13% | 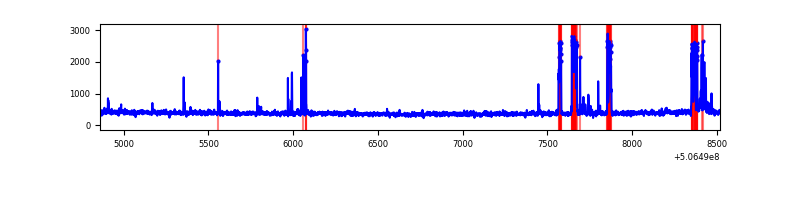 |
| D | 3659 | 3659 | 1152 | 1152 | 31.48% | 31.48% | 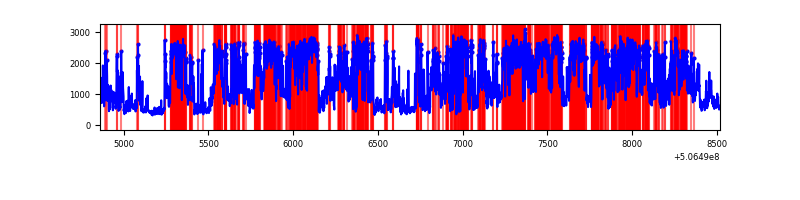 |
Top three noisy pixels from each quadrant. If the there are fewer than three noisy pixels in the level2.evt file, extra rows are filled as -1
| Pixel properties | Quadrant properties | ||||||
|---|---|---|---|---|---|---|---|
| Quadrant | DetID | PixID | Counts | Sigma | Mean | Median | Sigma |
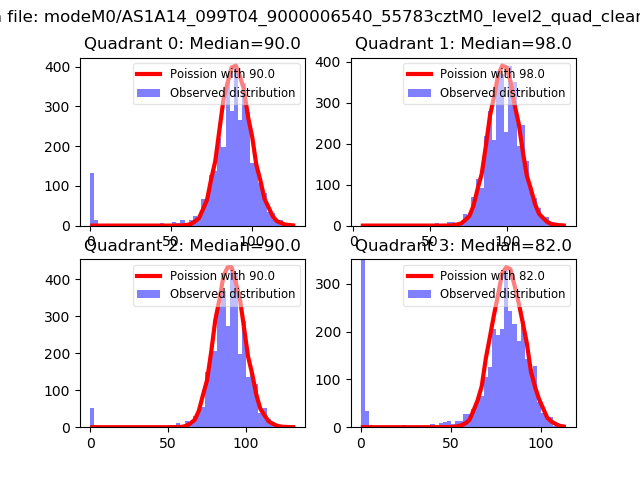
| A | 15 | 32 | 957077 | 11006.86 | 348 | 339 | 86.9 |
| A | 7 | 64 | 649778 | 7471.52 | 348 | 339 | 86.9 |
| A | 12 | 115 | 303287 | 3485.29 | 348 | 339 | 86.9 |
| B | 5 | 172 | 456911 | 5885.28 | 354 | 341 | 77.6 |
| B | 10 | 247 | 17062 | 215.54 | 354 | 341 | 77.6 |
| B | 5 | 236 | 15182 | 191.3 | 354 | 341 | 77.6 |
| C | 15 | 199 | 186289 | 1919.35 | 345 | 340 | 96.9 |
| C | 12 | 250 | 57225 | 587.16 | 345 | 340 | 96.9 |
| C | 6 | 223 | 23000 | 233.89 | 345 | 340 | 96.9 |
| D | 11 | 129 | 3889626 | 43294.22 | 308 | 292 | 89.8 |
| D | 7 | 70 | 207382 | 2305.23 | 308 | 292 | 89.8 |
| D | 8 | 245 | 65576 | 726.71 | 308 | 292 | 89.8 |
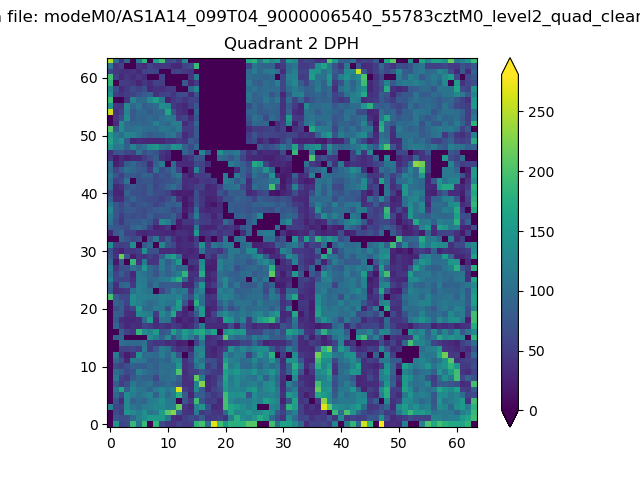
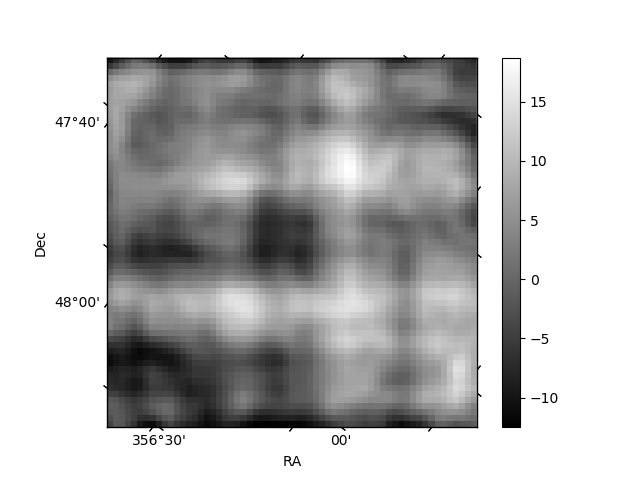
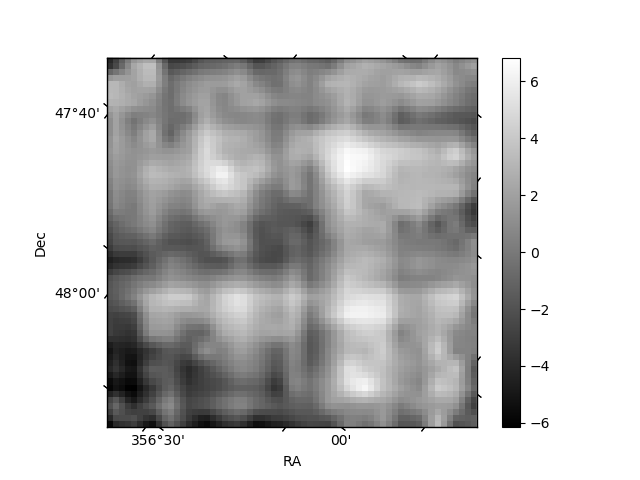
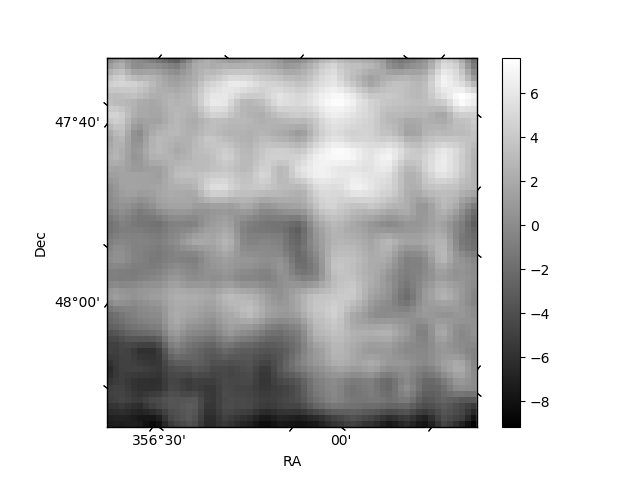
Histogram calculated using DETX and DETY for each event in the final _common_clean file
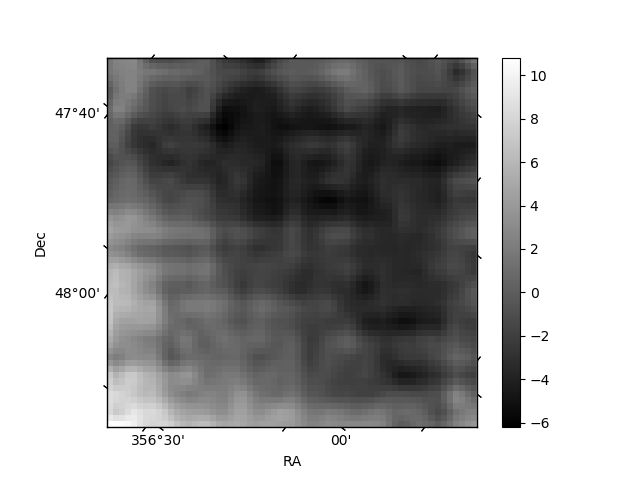
| Quadrant A | 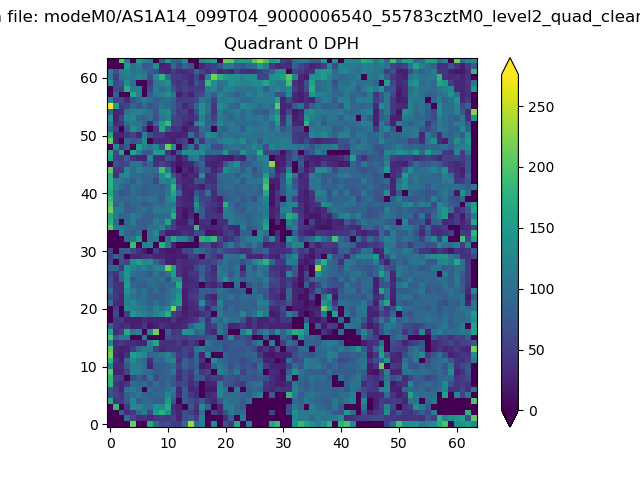 |
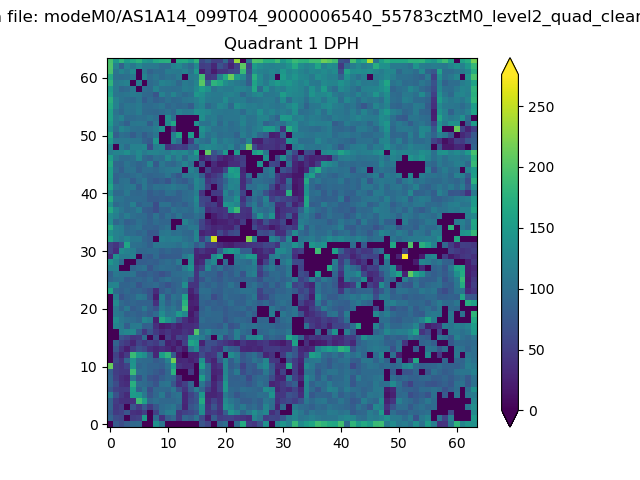 |
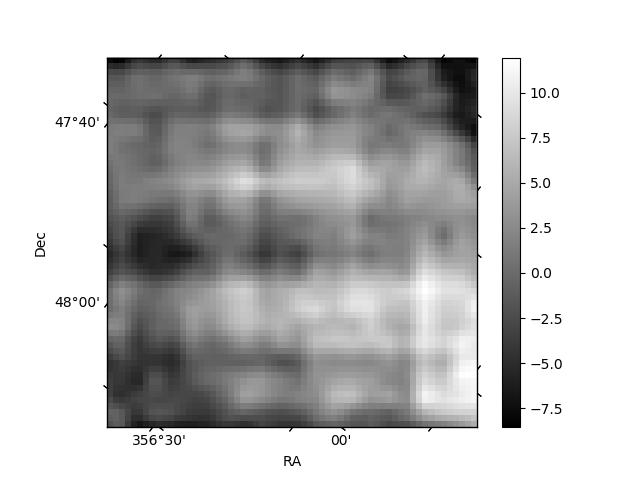
Quadrant B |
|---|---|---|---|
| Quadrant D | 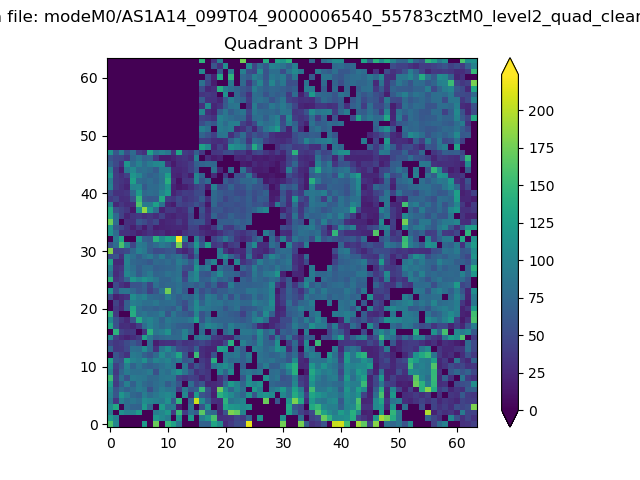 |
 |
Quadrant C |
| Plot type | Count rate plots | Images |
|---|---|---|
| Comparison with Poisson distribution Blue bars denote a histogram of data divided into 1 sec bins. Red curve is a Poisson curve with rate = median count rate of data. |
 |
 |
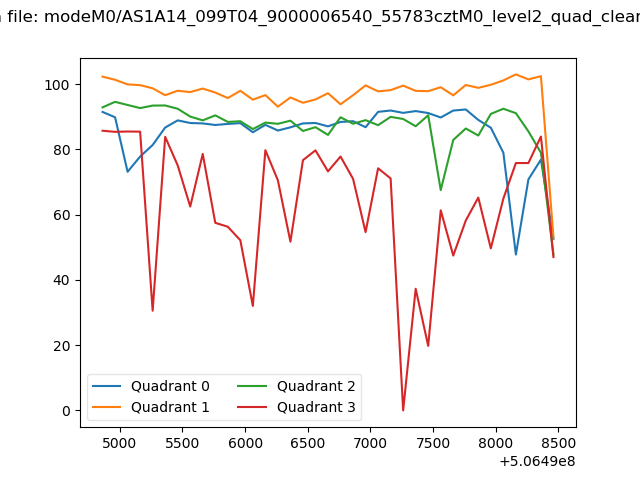
| Quadrant-wise count rates Data is divided into 100 sec bins |
 |
|
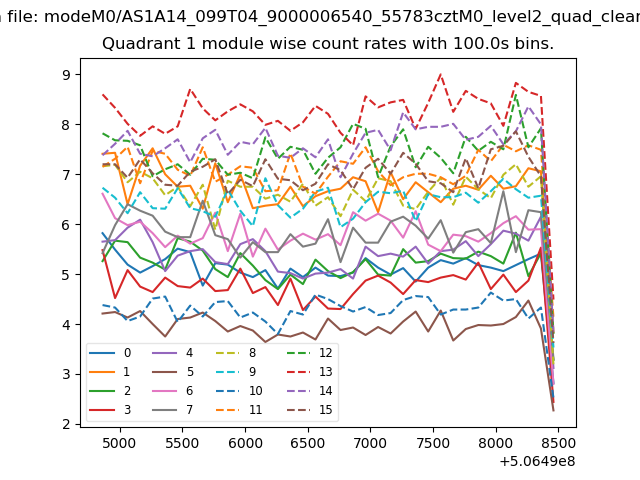
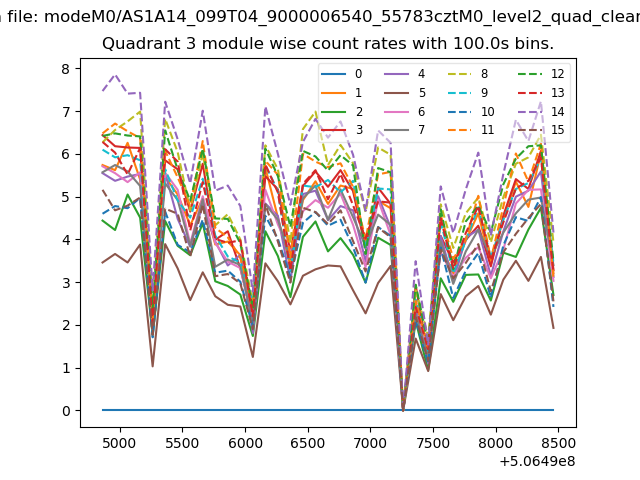
| Module-wise count rates for Quadrant A Data is divided into 100 sec bins |
 |
 |
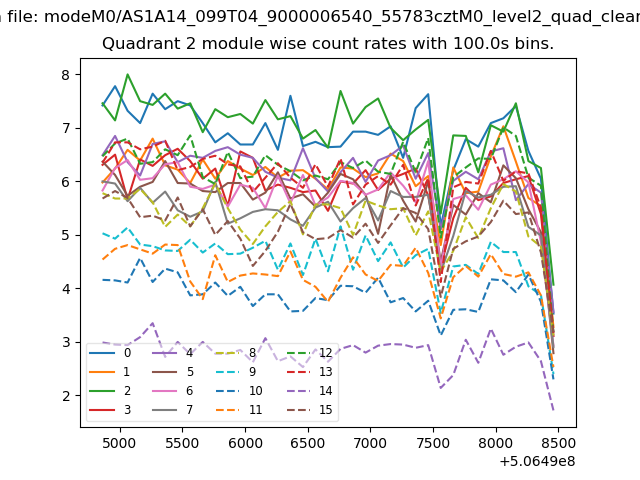
| Module-wise count rates for Quadrant B Data is divided into 100 sec bins |
 |
 |
| Module-wise count rates for Quadrant C Data is divided into 100 sec bins |
 |
 |
| Module-wise count rates for Quadrant D Data is divided into 100 sec bins |
 |
 |
| Parameter | Plot |
|---|---|
| CZT HV Monitor | 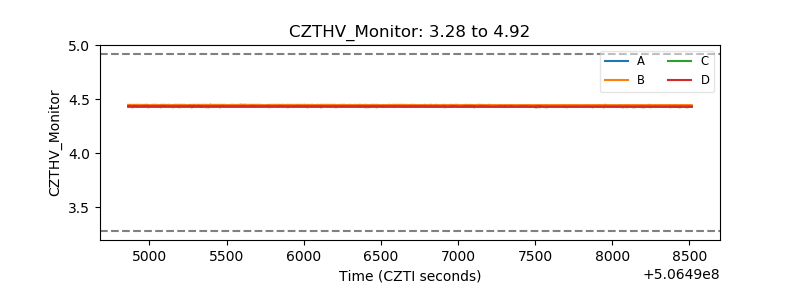 |
| D_VDD | 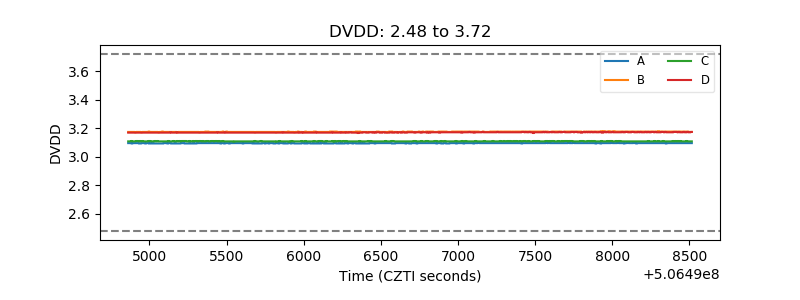 |
| Temperature 1 | 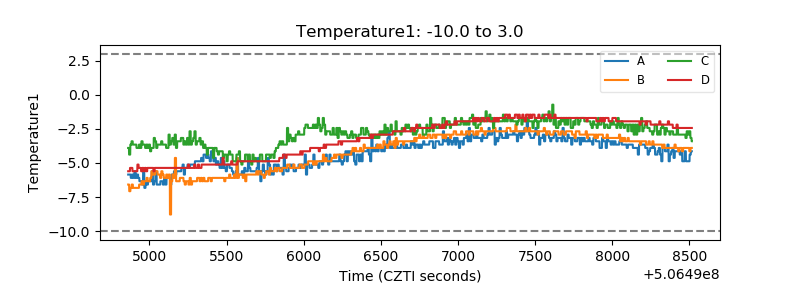 |
| Veto HV Monitor | 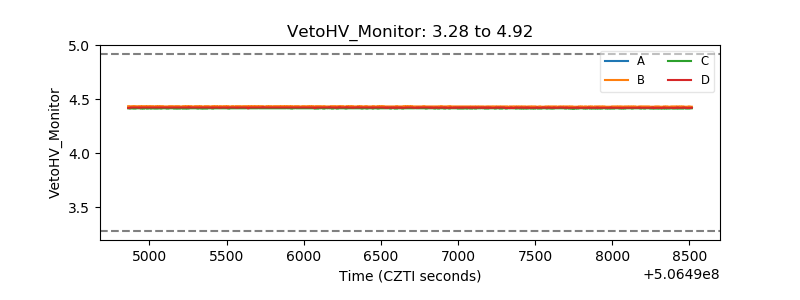 |
| Veto LLD | 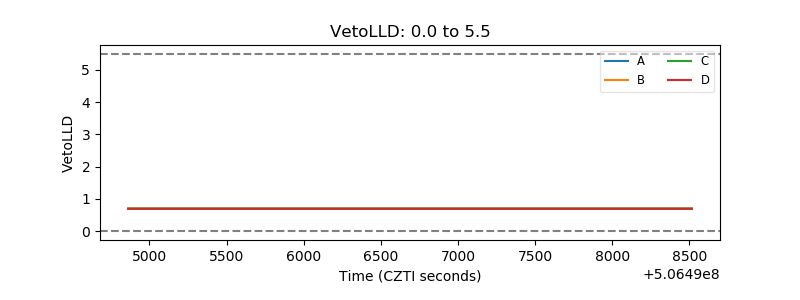 |
| Alpha Counter | 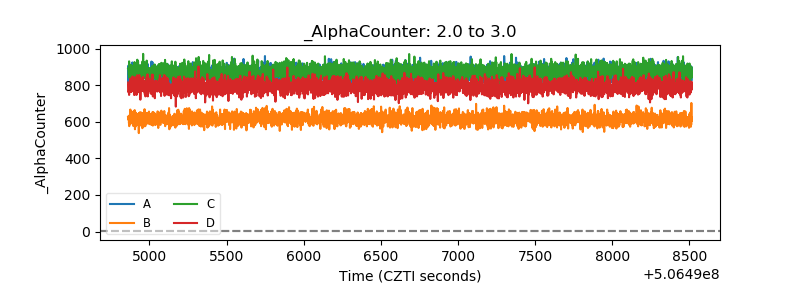 |
| _CPM_Rate | 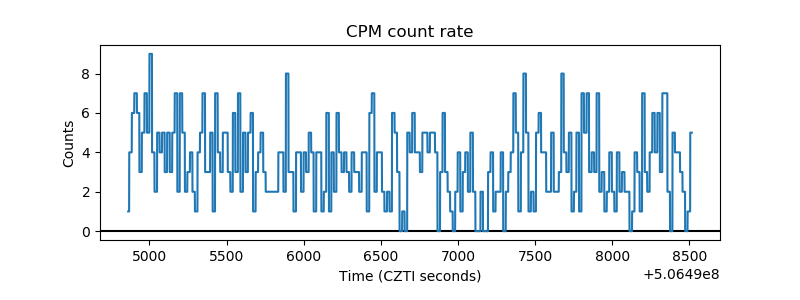 |
| CZT Counter | 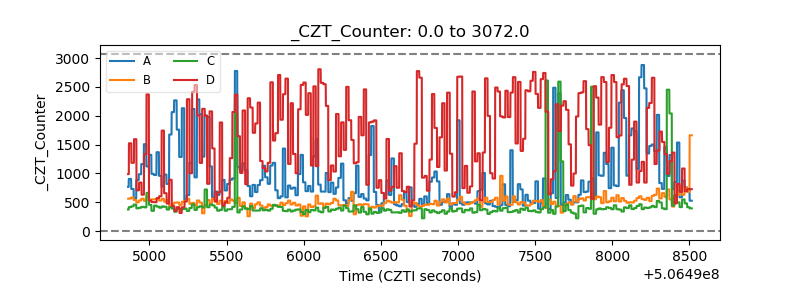 |
| +2.5 Volts monitor |  |
| +5 Volts monitor |  |
| _ROLL_ROT | 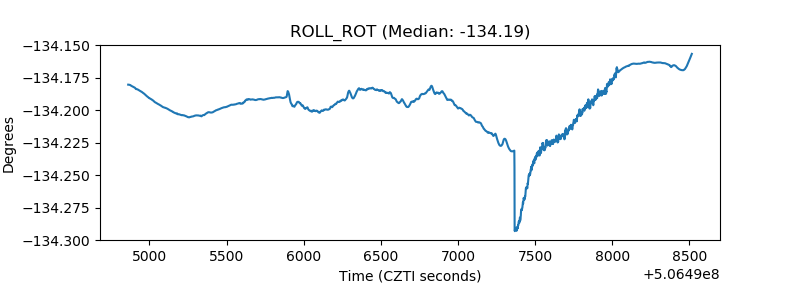 |
| _Roll_DEC | 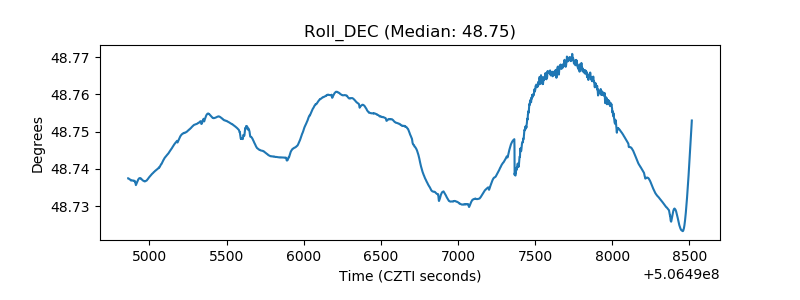 |
| _Roll_RA | 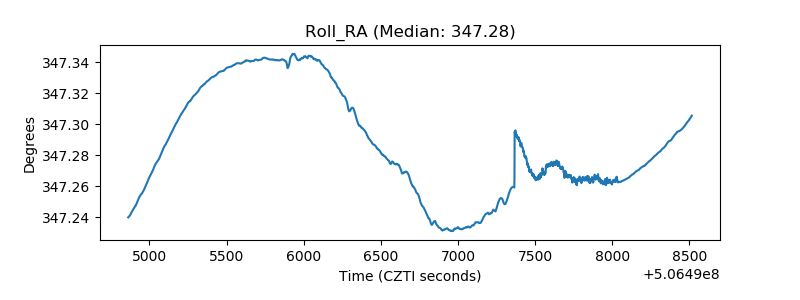 |
| Veto Counter | 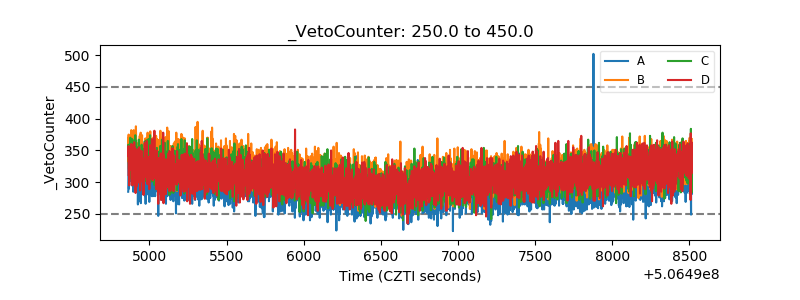 |