| Param | Original file | Final file |
|---|---|---|
| Filename | modeM0/AS1A14_127T10_9000006542cztM0_level2.fits | modeM0/AS1A14_127T10_9000006542cztM0_level2_quad_clean.evt |
| Size (bytes) | 3,011,063,040 | 1,406,283,840 |
| Size | 2.8 GB | 1.3 GB |
| Events in quadrant A | 17,059,868 | 4,088,852 |
| Events in quadrant B | 16,994,368 | 4,960,243 |
| Events in quadrant C | 17,681,076 | 4,480,426 |
| Events in quadrant D | 13,967,300 | 3,600,341 |
| Mode M0 | |||
|---|---|---|---|
| Quadrant | BADHDUFLAG | Total packets | Discarded packets |
| A | 0 | 1251582 | 0 |
| B | 0 | 832498 | 0 |
| C | 0 | 859295 | 0 |
| D | 0 | 1266022 | 0 |
| Mode M9 | |||
|---|---|---|---|
| Quadrant | BADHDUFLAG | Total packets | Discarded packets |
| A | 0 | 413 | 0 |
| B | 0 | 413 | 0 |
| C | 0 | 414 | 0 |
| D | 0 | 414 | 0 |
| Mode SS | |||
|---|---|---|---|
| Quadrant | BADHDUFLAG | Total packets | Discarded packets |
| A | 0 | 7502 | 0 |
| B | 0 | 7502 | 0 |
| C | 0 | 7502 | 0 |
| D | 0 | 7502 | 0 |
| Quadrant | Total seconds | Saturated seconds | Saturation percentage |
|---|---|---|---|
| A | 373698 | 45062 | 12.058400% |
| B | 373699 | 9551 | 2.555800% |
| C | 373699 | 9307 | 2.490507% |
| D | 364820 | 48567 | 13.312593% |
Noise dominated data is calculated using 1-second bins in cleaned event files. If a bin has >2000 counts, and if more than 50% of those come from <1% of pixels, then it is considered to be noise-dominated and hence unusable.
| Quadrant | # 1 sec bins | Bins with >0 counts | Bins with >2000 counts | High rate bins dominated by noise | Noise dominated (total time) | Noise dominated (detector-on time) | Marked lightcurve |
|---|---|---|---|---|---|---|---|
| A | 420140 | 371880 | 0 | 0 | 0.00% | 0.00% | 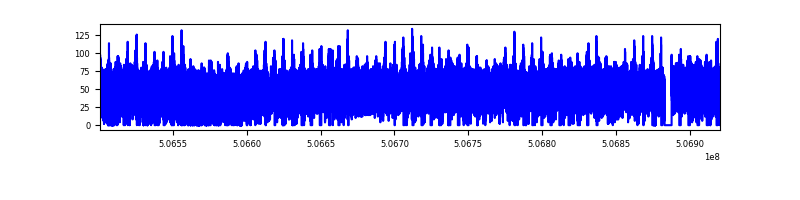 |
| B | 420141 | 373163 | 0 | 0 | 0.00% | 0.00% | 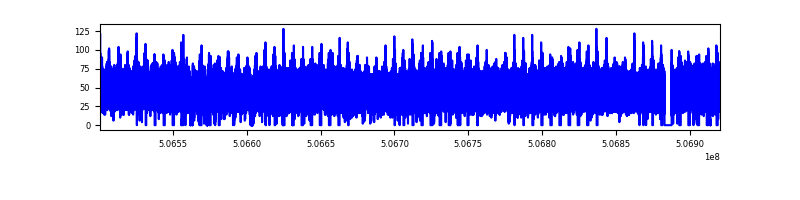 |
| C | 420141 | 373158 | 0 | 0 | 0.00% | 0.00% | 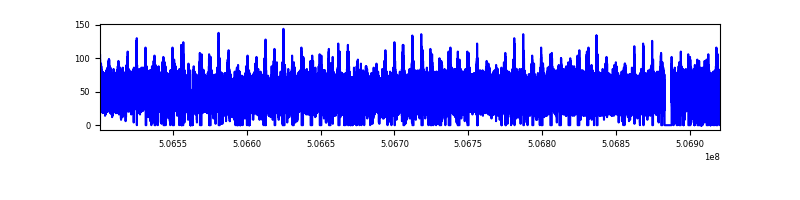 |
| D | 420140 | 362250 | 0 | 0 | 0.00% | 0.00% | 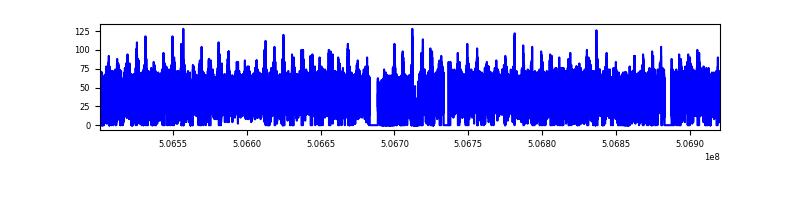 |
Top three noisy pixels from each quadrant. If the there are fewer than three noisy pixels in the level2.evt file, extra rows are filled as -1
| Pixel properties | Quadrant properties | ||||||
|---|---|---|---|---|---|---|---|
| Quadrant | DetID | PixID | Counts | Sigma | Mean | Median | Sigma |
| A | 14 | 188 | 18894 | 9.83 | 4464 | 4096 | 1505.9 |
| A | 9 | 255 | 17107 | 8.64 | 4464 | 4096 | 1505.9 |
| A | 14 | 204 | 15154 | 7.34 | 4464 | 4096 | 1505.9 |
| B | 2 | 9 | 19687 | 14.59 | 4484 | 4228 | 1059.8 |
| B | 2 | 8 | 17642 | 12.66 | 4484 | 4228 | 1059.8 |
| B | 3 | 25 | 14179 | 9.39 | 4484 | 4228 | 1059.8 |
| C | 15 | 175 | 14974 | 6.44 | 4711 | 4262 | 1662.7 |
| C | 2 | 31 | 14340 | 6.06 | 4711 | 4262 | 1662.7 |
| C | 15 | 127 | 13944 | 5.82 | 4711 | 4262 | 1662.7 |
| D | 6 | 218 | 17862 | 10.56 | 3973 | 3509 | 1359.2 |
| D | 15 | 11 | 13459 | 7.32 | 3973 | 3509 | 1359.2 |
| D | 8 | 12 | 13011 | 6.99 | 3973 | 3509 | 1359.2 |
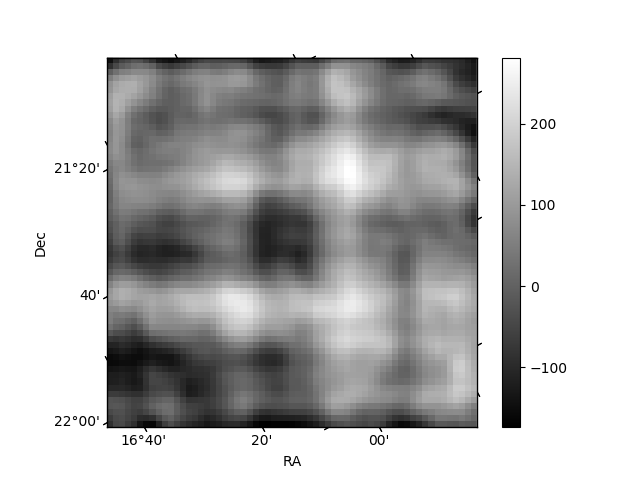
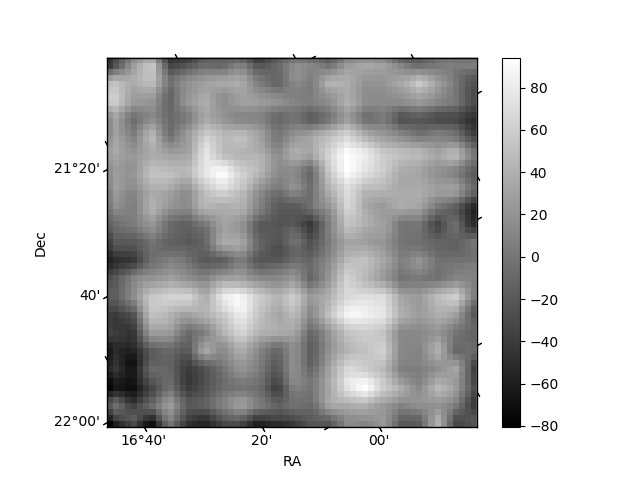
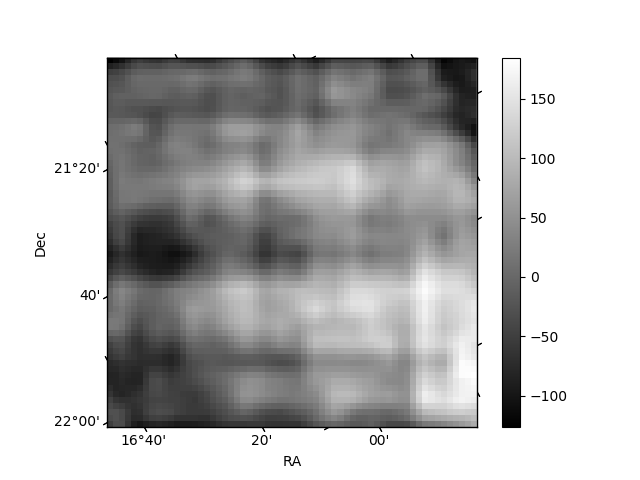
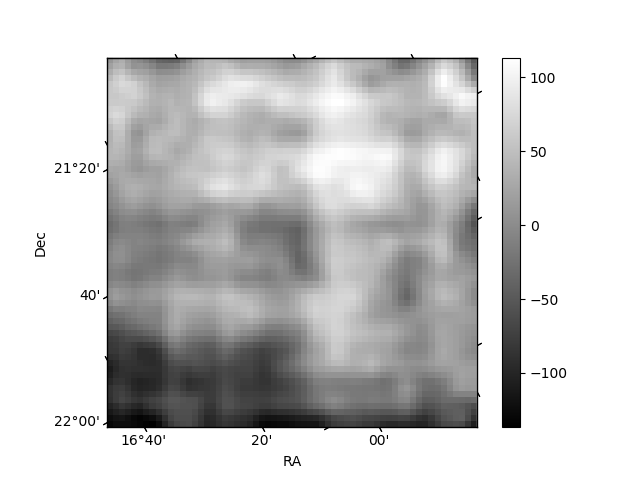
Histogram calculated using DETX and DETY for each event in the final _common_clean file
| Quadrant A | 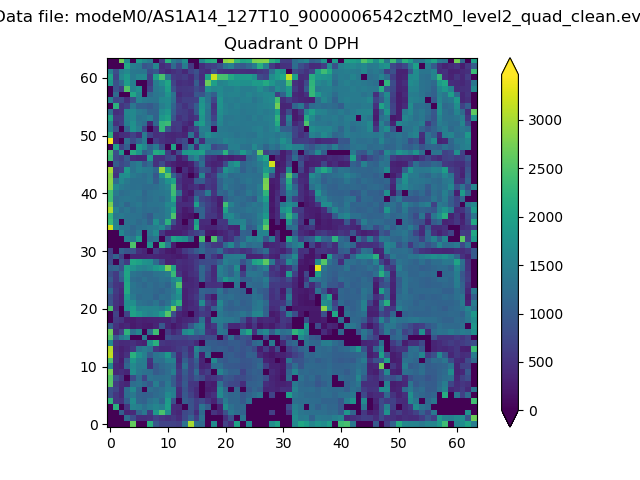 |
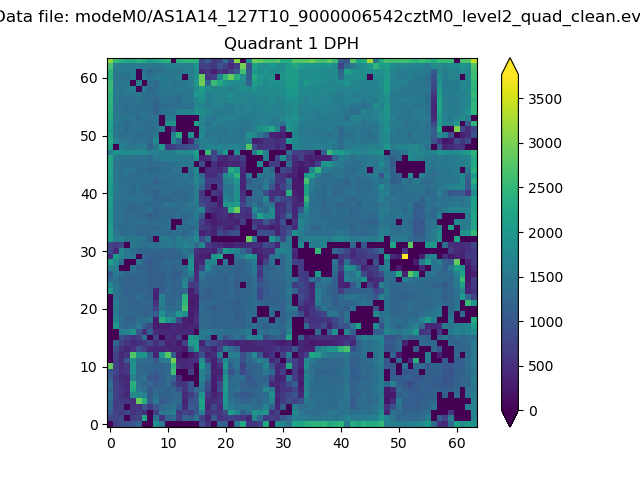 |
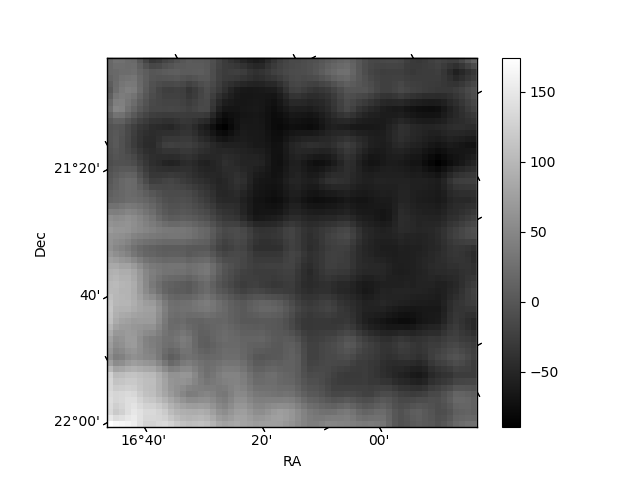
Quadrant B |
|---|---|---|---|
| Quadrant D | 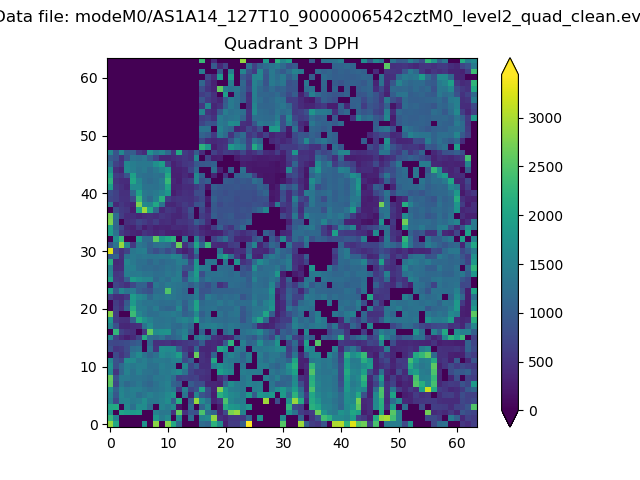 |
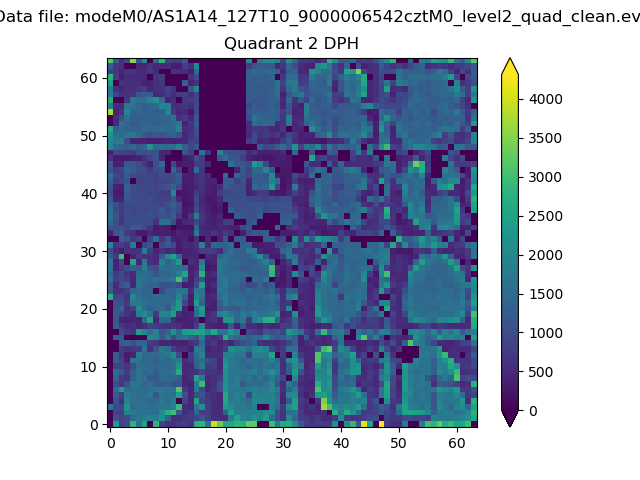 |
Quadrant C |
| Plot type | Count rate plots | Images |
|---|---|---|
| Comparison with Poisson distribution Blue bars denote a histogram of data divided into 1 sec bins. Red curve is a Poisson curve with rate = median count rate of data. |
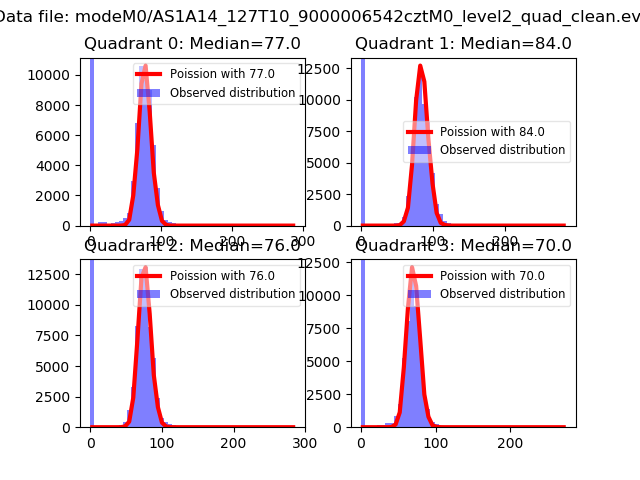 |
 |
| Quadrant-wise count rates Data is divided into 100 sec bins |
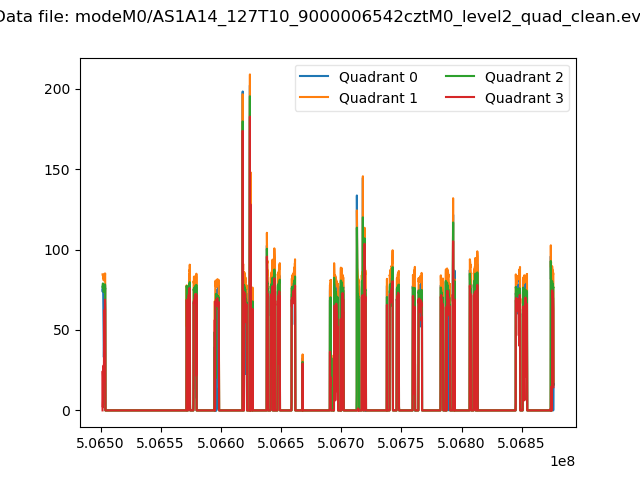 |
|
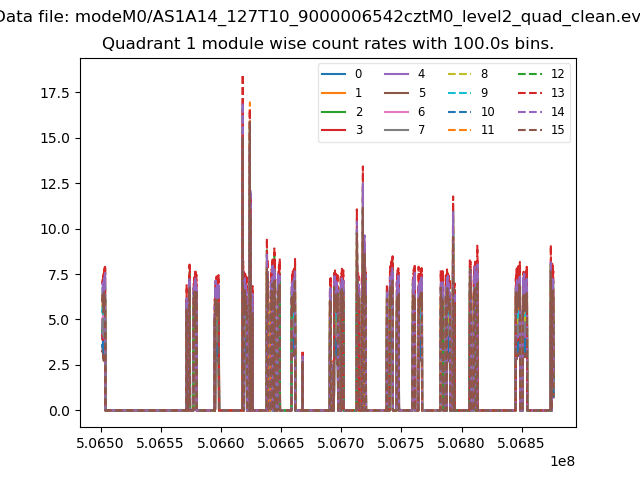
| Module-wise count rates for Quadrant A Data is divided into 100 sec bins |
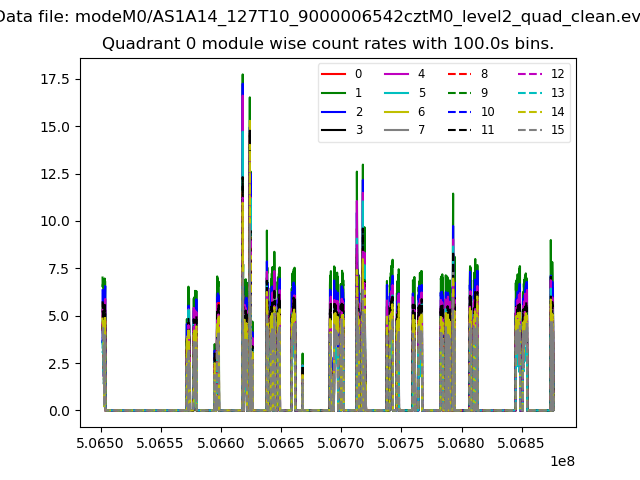 |
 |
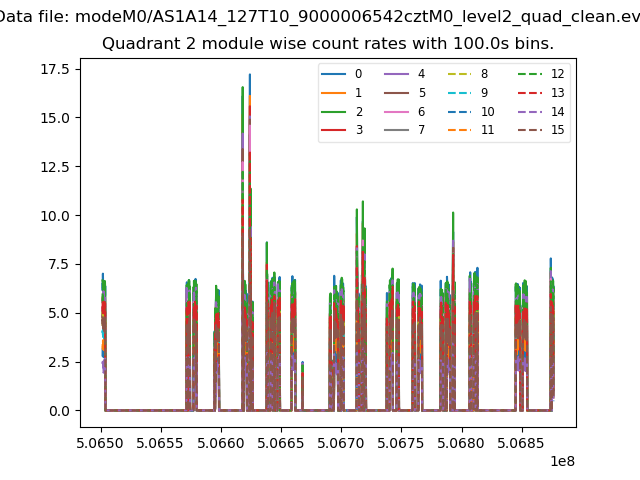
| Module-wise count rates for Quadrant B Data is divided into 100 sec bins |
 |
 |
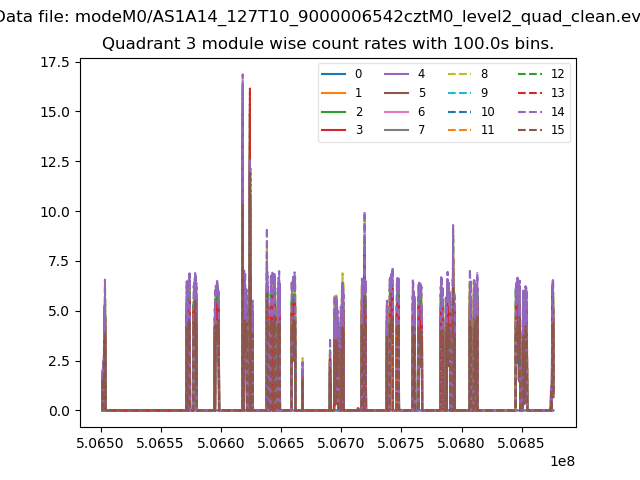
| Module-wise count rates for Quadrant C Data is divided into 100 sec bins |
 |
 |
| Module-wise count rates for Quadrant D Data is divided into 100 sec bins |
 |
 |
| Parameter | Plot |
|---|---|
| CZT HV Monitor | 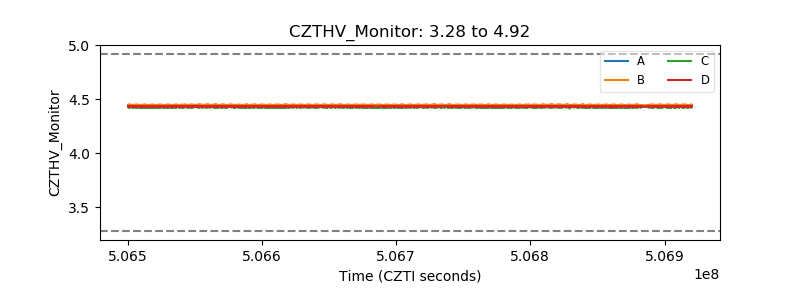 |
| D_VDD | 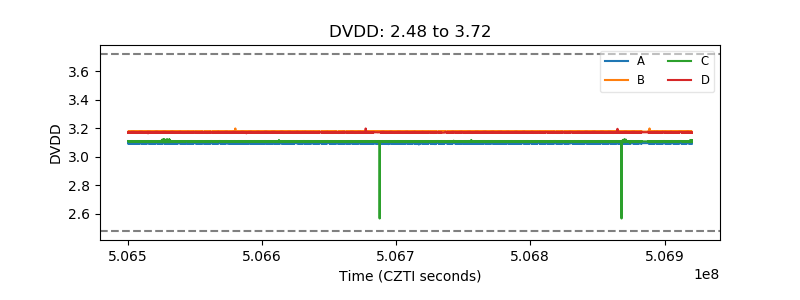 |
| Temperature 1 | 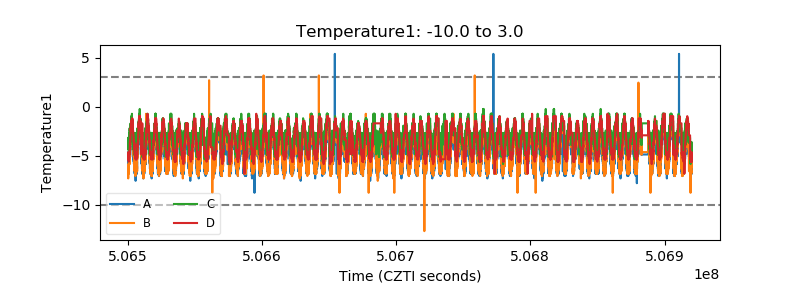 |
| Veto HV Monitor | 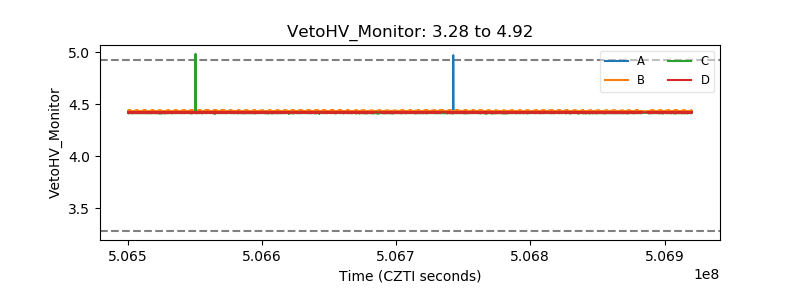 |
| Veto LLD | 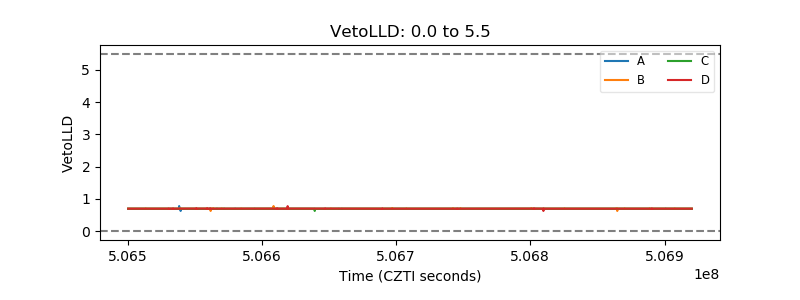 |
| Alpha Counter | 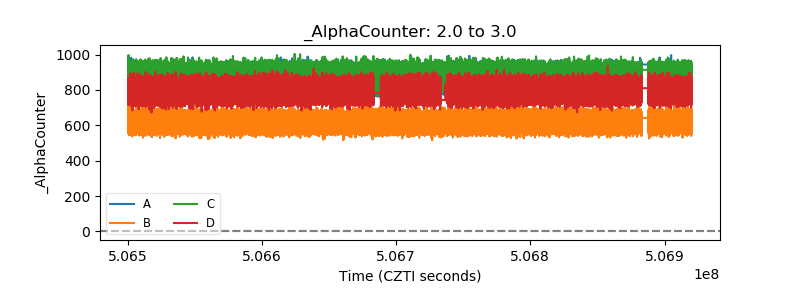 |
| _CPM_Rate | 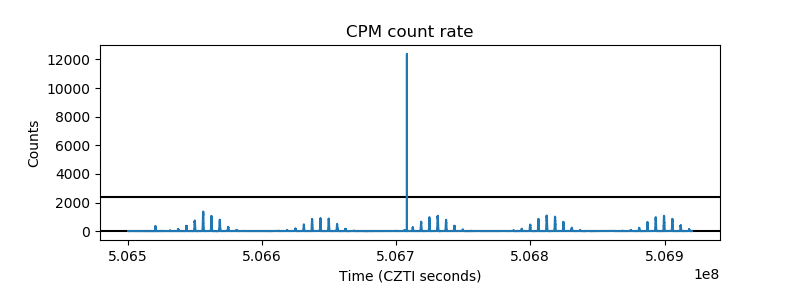 |
| CZT Counter | 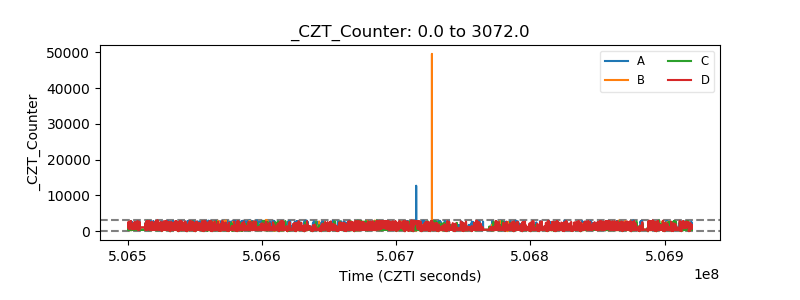 |
| +2.5 Volts monitor | 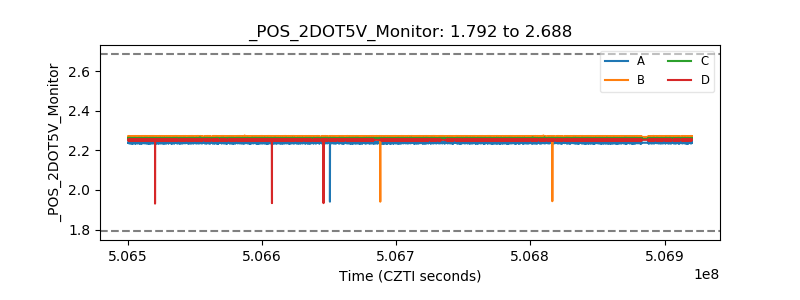 |
| +5 Volts monitor | 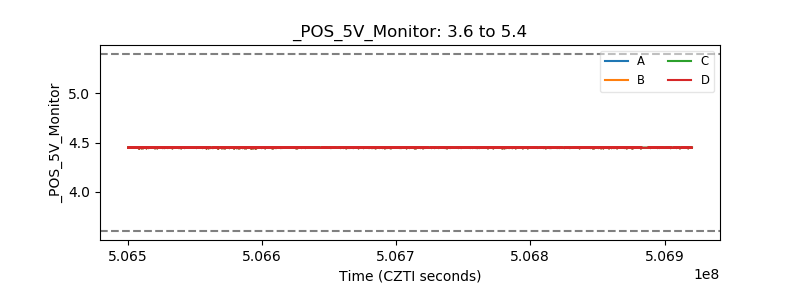 |
| _ROLL_ROT | 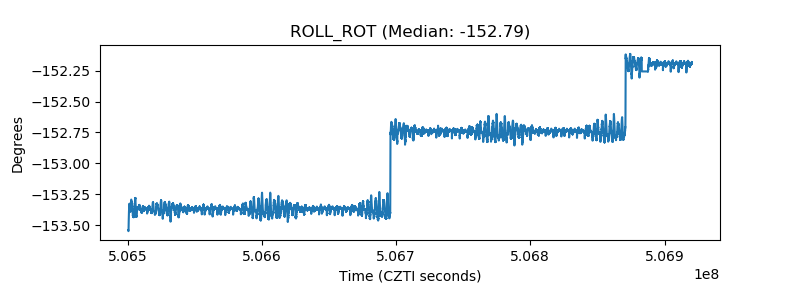 |
| _Roll_DEC | 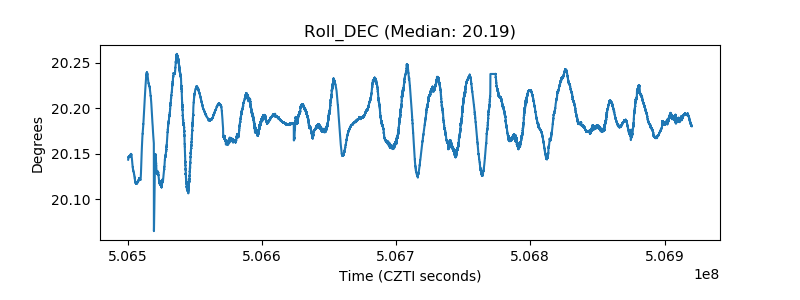 |
| _Roll_RA | 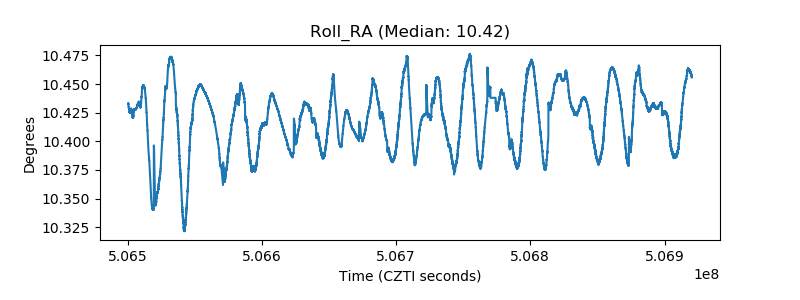 |
| Veto Counter | 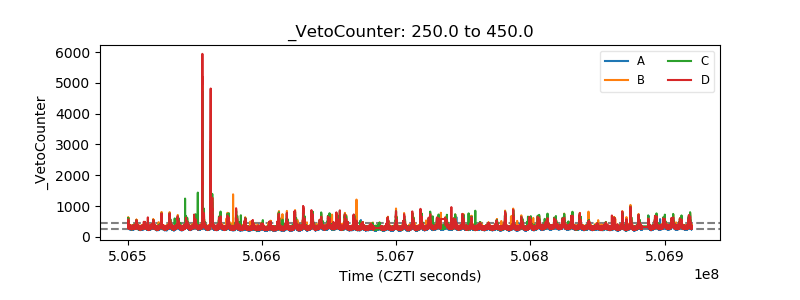 |