| Param | Original file | Final file |
|---|---|---|
| Filename | modeM0/AS1A14_127T10_9000006542_55784cztM0_level2.fits | modeM0/AS1A14_127T10_9000006542_55784cztM0_level2_quad_clean.evt |
| Size (bytes) | 850,003,200 | 100,661,760 |
| Size | 810.6 MB | 96.0 MB |
| Events in quadrant A | 10,661,380 | 544,100 |
| Events in quadrant B | 3,903,625 | 803,823 |
| Events in quadrant C | 3,521,219 | 724,794 |
| Events in quadrant D | 12,767,266 | 426,515 |
| Mode M0 | |||
|---|---|---|---|
| Quadrant | BADHDUFLAG | Total packets | Discarded packets |
| A | 0 | 37109 | 1 |
| B | 0 | 16703 | 1 |
| C | 0 | 16673 | 1 |
| D | 0 | 43376 | 1 |
| Mode SS | |||
|---|---|---|---|
| Quadrant | BADHDUFLAG | Total packets | Discarded packets |
| A | 0 | 158 | 0 |
| B | 0 | 158 | 0 |
| C | 0 | 158 | 0 |
| D | 0 | 158 | 0 |
| Quadrant | Total seconds | Saturated seconds | Saturation percentage |
|---|---|---|---|
| A | 7884 | 2408 | 30.542872% |
| B | 7885 | 117 | 1.483830% |
| C | 7885 | 29 | 0.367787% |
| D | 7885 | 3239 | 41.077996% |
Noise dominated data is calculated using 1-second bins in cleaned event files. If a bin has >2000 counts, and if more than 50% of those come from <1% of pixels, then it is considered to be noise-dominated and hence unusable.
| Quadrant | # 1 sec bins | Bins with >0 counts | Bins with >2000 counts | High rate bins dominated by noise | Noise dominated (total time) | Noise dominated (detector-on time) | Marked lightcurve |
|---|---|---|---|---|---|---|---|
| A | 7884 | 7884 | 2101 | 2101 | 26.65% | 26.65% | 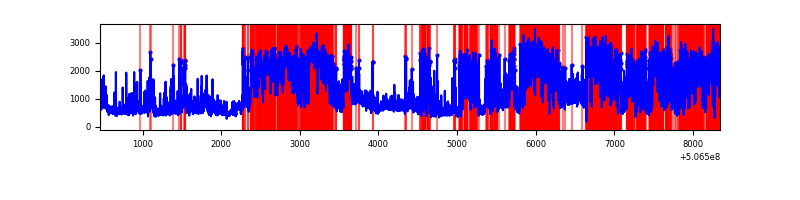 |
| B | 7885 | 7885 | 0 | 0 | 0.00% | 0.00% | 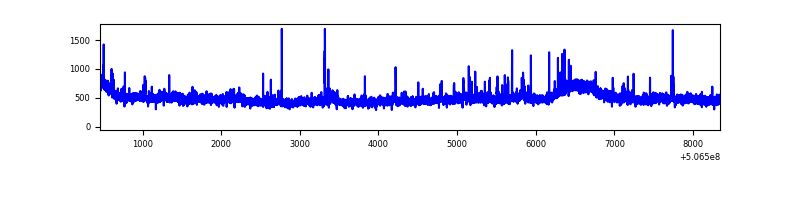 |
| C | 7885 | 7885 | 24 | 24 | 0.30% | 0.30% | 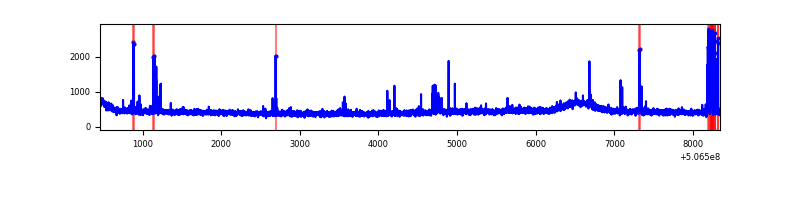 |
| D | 7885 | 7885 | 3109 | 3109 | 39.43% | 39.43% | 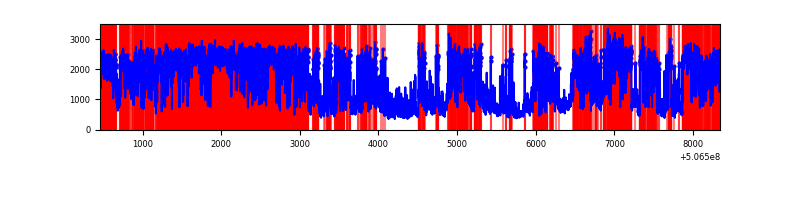 |
Top three noisy pixels from each quadrant. If the there are fewer than three noisy pixels in the level2.evt file, extra rows are filled as -1
| Pixel properties | Quadrant properties | ||||||
|---|---|---|---|---|---|---|---|
| Quadrant | DetID | PixID | Counts | Sigma | Mean | Median | Sigma |
| A | 15 | 32 | 5399948 | 29303.56 | 746 | 727 | 184.3 |
| A | 12 | 115 | 1377804 | 7473.9 | 746 | 727 | 184.3 |
| A | 7 | 64 | 440796 | 2388.42 | 746 | 727 | 184.3 |
| B | 5 | 172 | 386254 | 2069.69 | 860 | 828 | 186.2 |
| B | 7 | 252 | 29889 | 156.05 | 860 | 828 | 186.2 |
| B | 0 | 199 | 28529 | 148.75 | 860 | 828 | 186.2 |
| C | 12 | 250 | 142599 | 611.12 | 848 | 842 | 232.0 |
| C | 14 | 96 | 30847 | 129.35 | 848 | 842 | 232.0 |
| C | 6 | 223 | 29740 | 124.58 | 848 | 842 | 232.0 |
| D | 11 | 129 | 8488250 | 44154.76 | 680 | 650 | 192.2 |
| D | 8 | 245 | 959374 | 4987.54 | 680 | 650 | 192.2 |
| D | 7 | 70 | 319044 | 1656.37 | 680 | 650 | 192.2 |
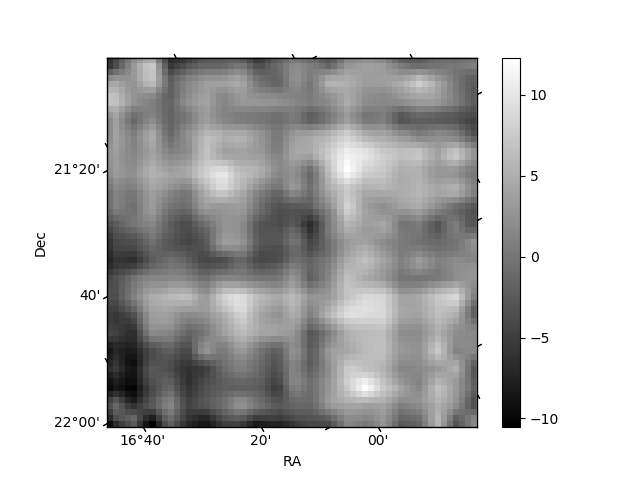
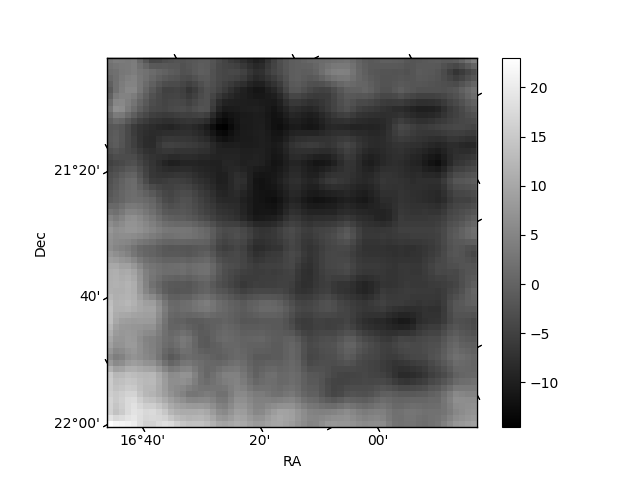
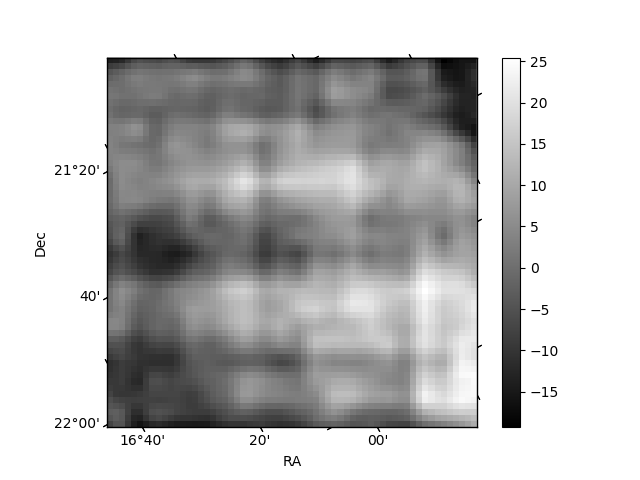
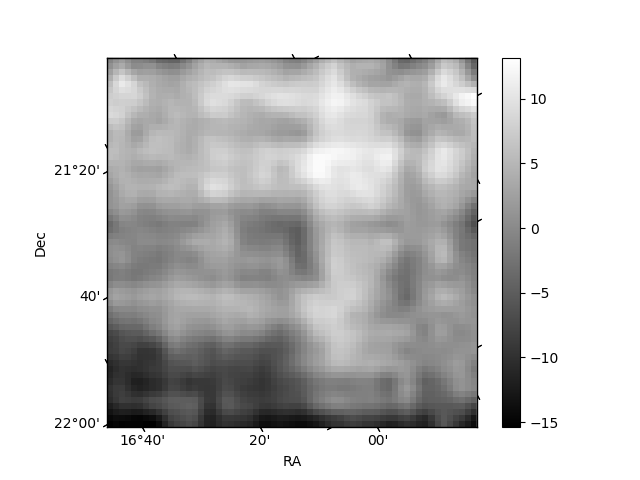
Histogram calculated using DETX and DETY for each event in the final _common_clean file
| Quadrant A | 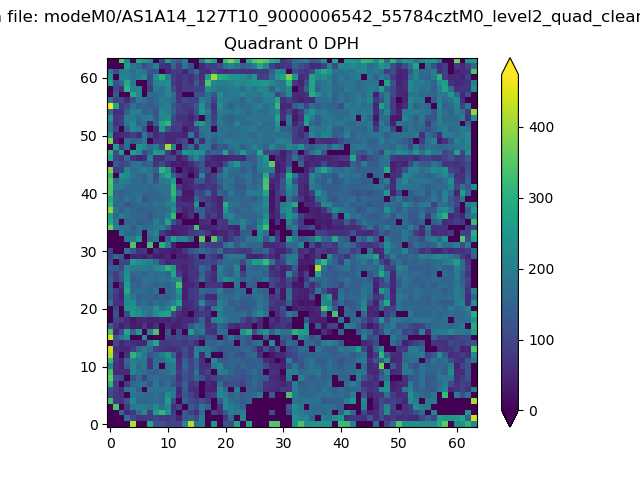 |
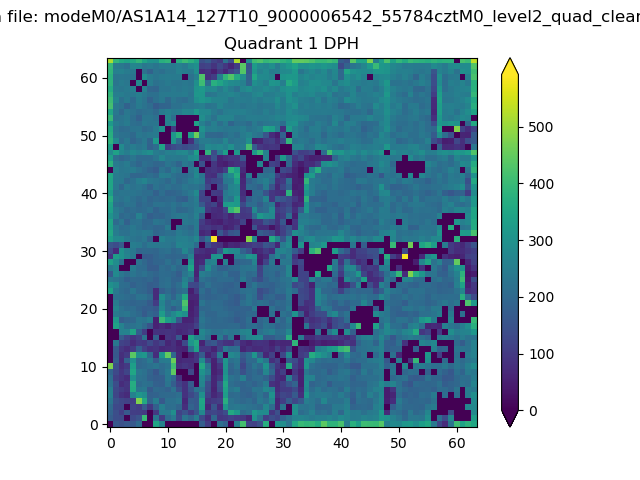 |
Quadrant B |
|---|---|---|---|
| Quadrant D | 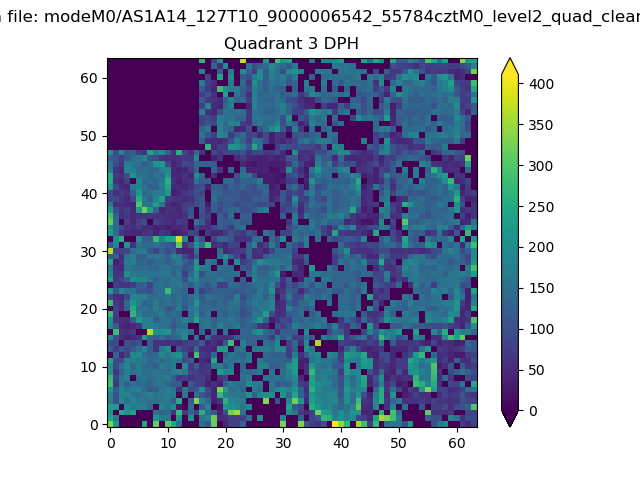 |
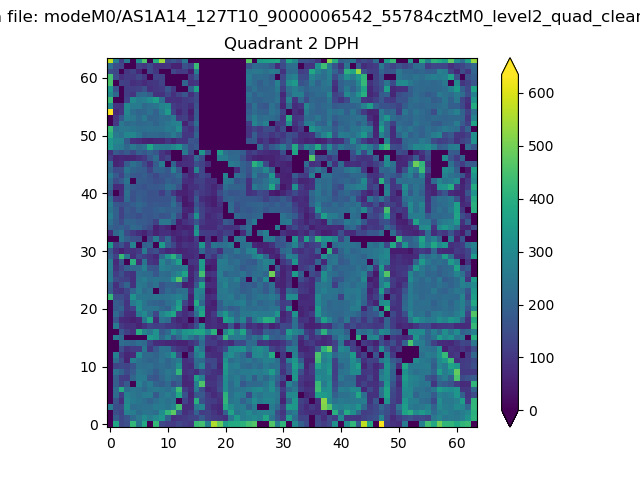 |
Quadrant C |
| Plot type | Count rate plots | Images |
|---|---|---|
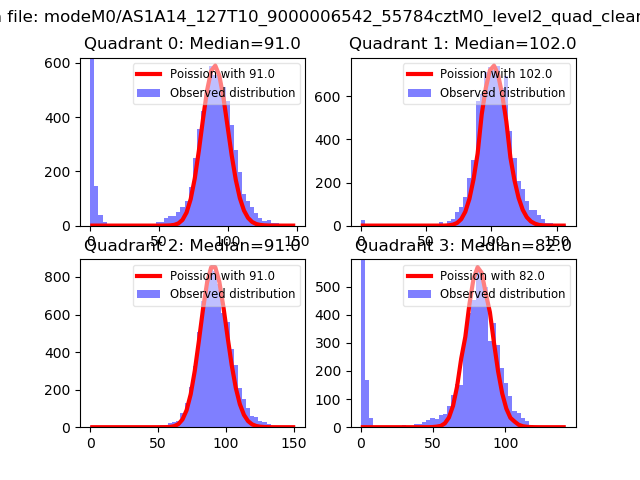
| Comparison with Poisson distribution Blue bars denote a histogram of data divided into 1 sec bins. Red curve is a Poisson curve with rate = median count rate of data. |
 |
 |
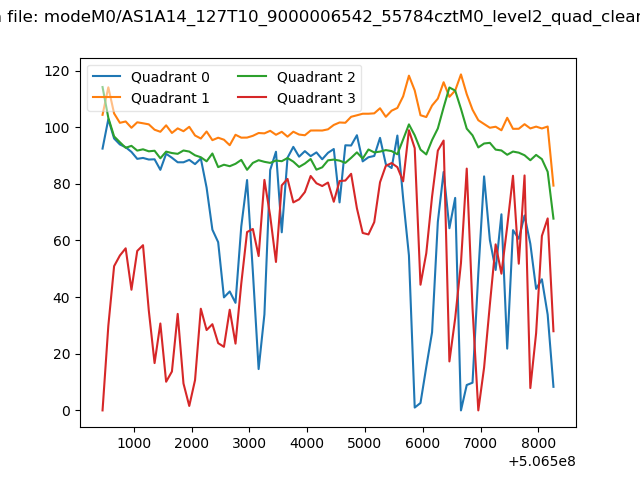
| Quadrant-wise count rates Data is divided into 100 sec bins |
 |
|
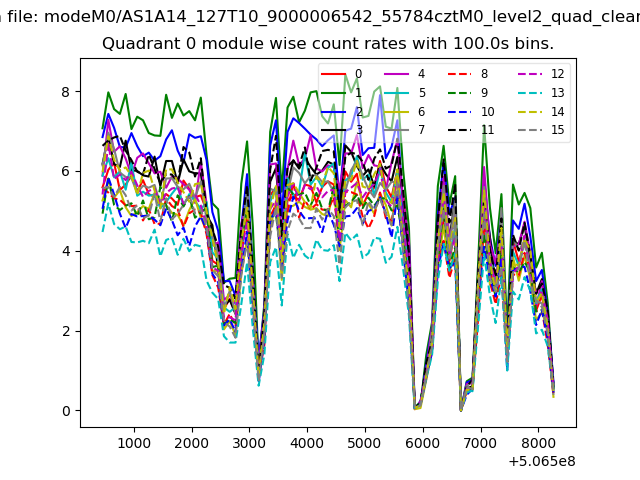
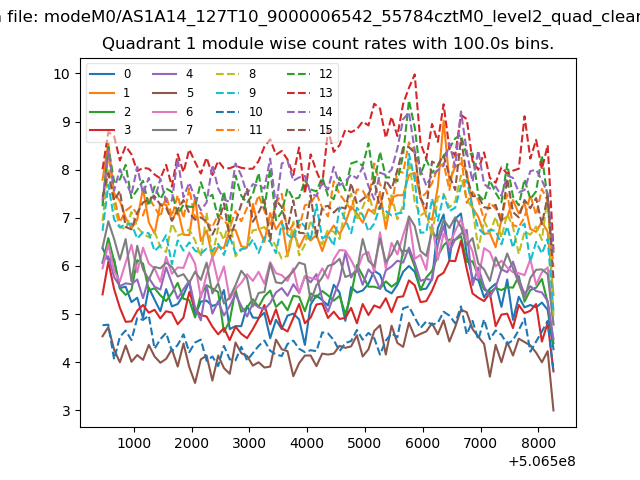
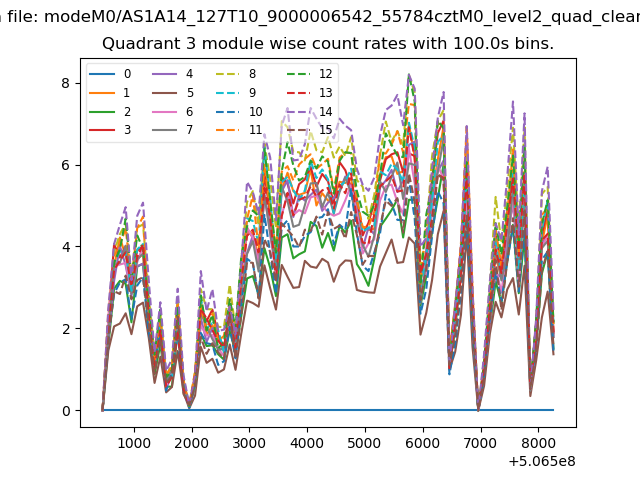
| Module-wise count rates for Quadrant A Data is divided into 100 sec bins |
 |
 |
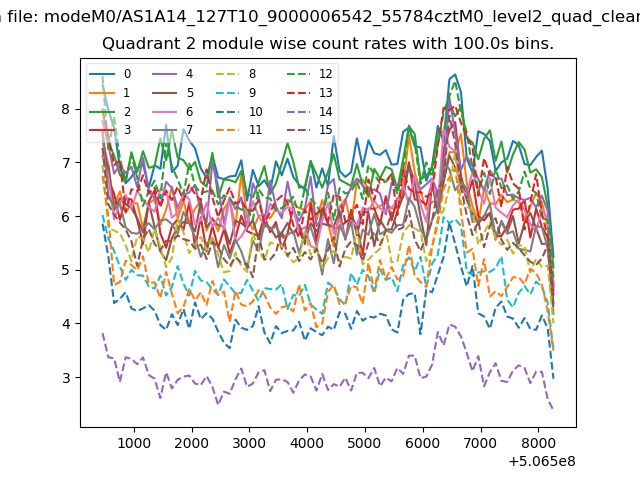
| Module-wise count rates for Quadrant B Data is divided into 100 sec bins |
 |
 |
| Module-wise count rates for Quadrant C Data is divided into 100 sec bins |
 |
 |
| Module-wise count rates for Quadrant D Data is divided into 100 sec bins |
 |
 |
| Parameter | Plot |
|---|---|
| CZT HV Monitor |  |
| D_VDD | 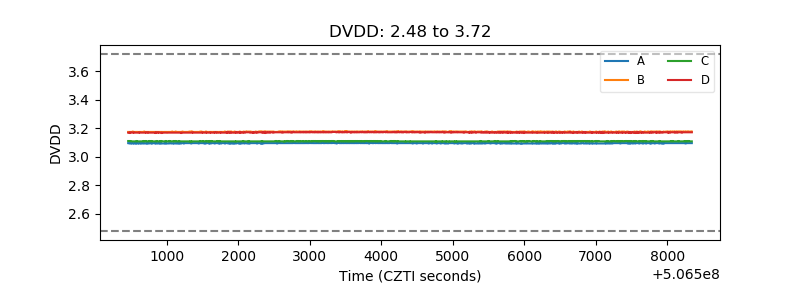 |
| Temperature 1 | 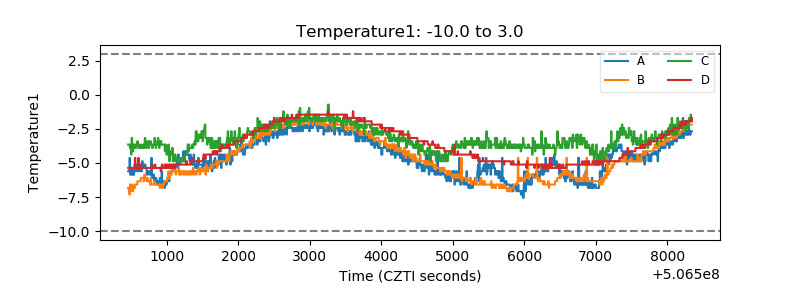 |
| Veto HV Monitor | 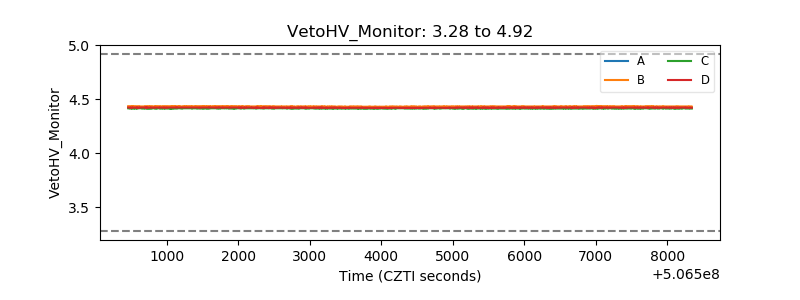 |
| Veto LLD | 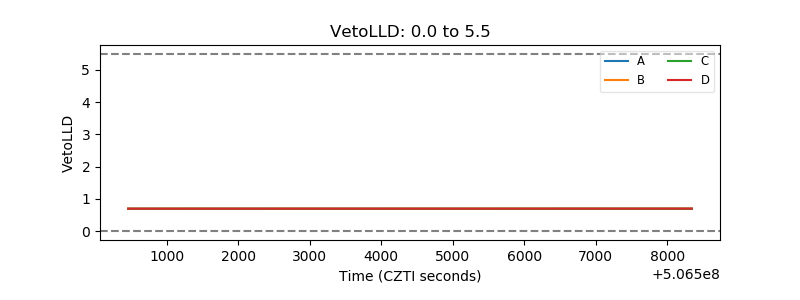 |
| Alpha Counter | 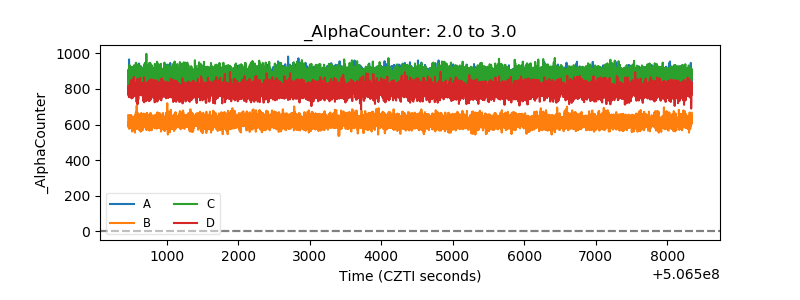 |
| _CPM_Rate | 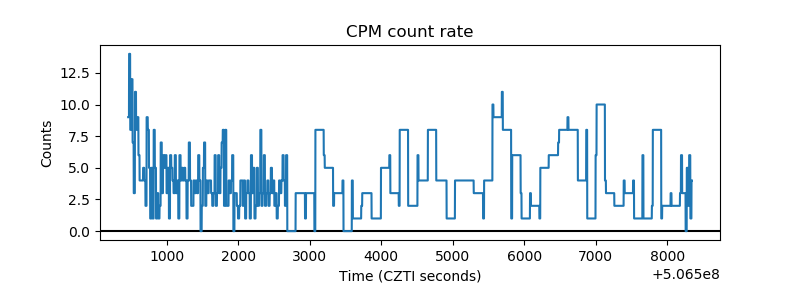 |
| CZT Counter | 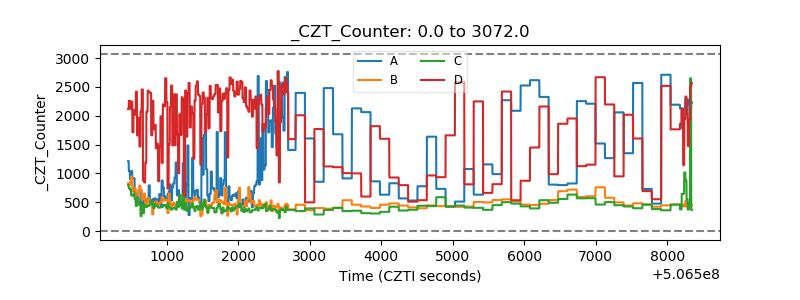 |
| +2.5 Volts monitor |  |
| +5 Volts monitor |  |
| _ROLL_ROT | 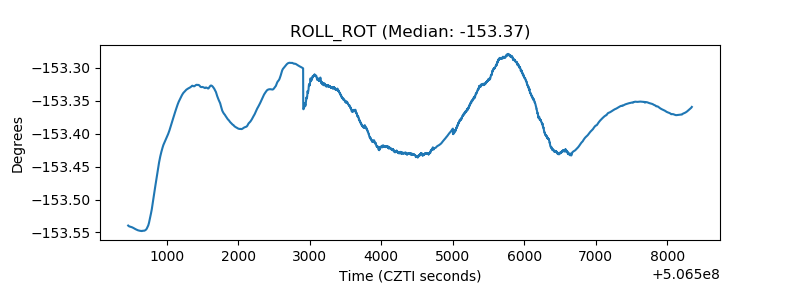 |
| _Roll_DEC | 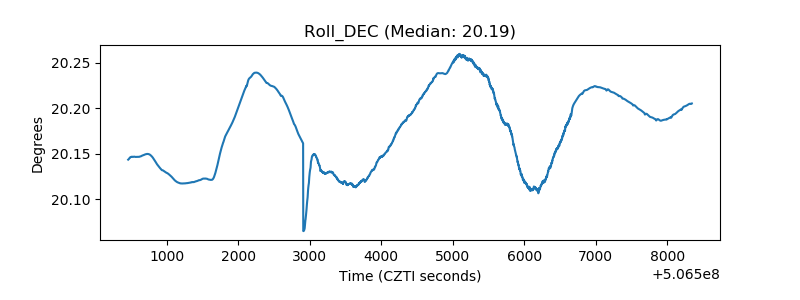 |
| _Roll_RA | 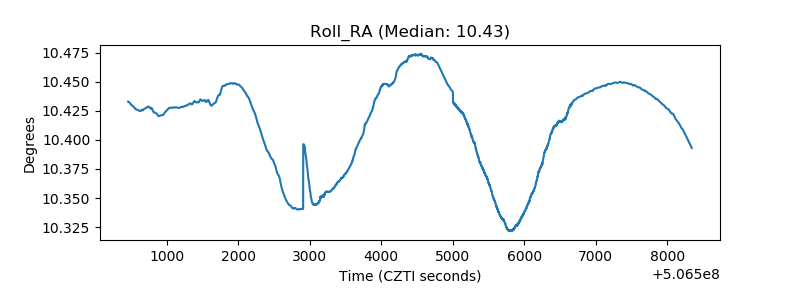 |
| Veto Counter | 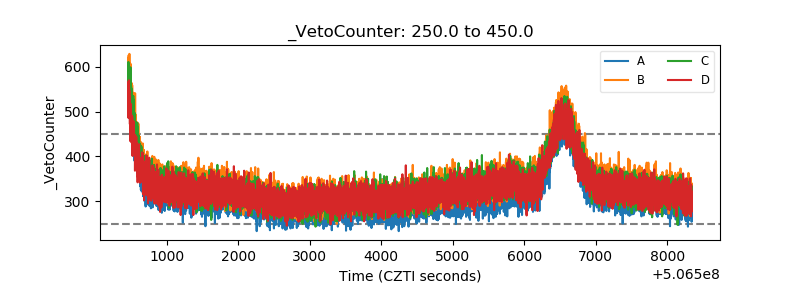 |