| Param | Original file | Final file |
|---|---|---|
| Filename | modeM0/AS1A14_127T10_9000006542_55785cztM0_level2.fits | modeM0/AS1A14_127T10_9000006542_55785cztM0_level2_quad_clean.evt |
| Size (bytes) | 712,759,680 | 89,841,600 |
| Size | 679.7 MB | 85.7 MB |
| Events in quadrant A | 10,065,272 | 403,169 |
| Events in quadrant B | 3,511,862 | 706,828 |
| Events in quadrant C | 3,440,146 | 633,837 |
| Events in quadrant D | 8,822,112 | 486,722 |
| Mode M0 | |||
|---|---|---|---|
| Quadrant | BADHDUFLAG | Total packets | Discarded packets |
| A | 0 | 34685 | 0 |
| B | 0 | 15024 | 0 |
| C | 0 | 15698 | 0 |
| D | 0 | 31070 | 0 |
| Mode SS | |||
|---|---|---|---|
| Quadrant | BADHDUFLAG | Total packets | Discarded packets |
| A | 0 | 142 | 0 |
| B | 0 | 142 | 0 |
| C | 0 | 142 | 0 |
| D | 0 | 142 | 0 |
| Quadrant | Total seconds | Saturated seconds | Saturation percentage |
|---|---|---|---|
| A | 7023 | 2943 | 41.905169% |
| B | 7023 | 19 | 0.270540% |
| C | 7023 | 36 | 0.512601% |
| D | 7023 | 1543 | 21.970668% |
Noise dominated data is calculated using 1-second bins in cleaned event files. If a bin has >2000 counts, and if more than 50% of those come from <1% of pixels, then it is considered to be noise-dominated and hence unusable.
| Quadrant | # 1 sec bins | Bins with >0 counts | Bins with >2000 counts | High rate bins dominated by noise | Noise dominated (total time) | Noise dominated (detector-on time) | Marked lightcurve |
|---|---|---|---|---|---|---|---|
| A | 7023 | 7023 | 2345 | 2345 | 33.39% | 33.39% | 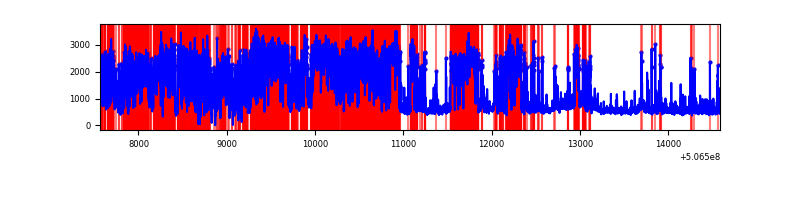 |
| B | 7023 | 7023 | 5 | 5 | 0.07% | 0.07% | 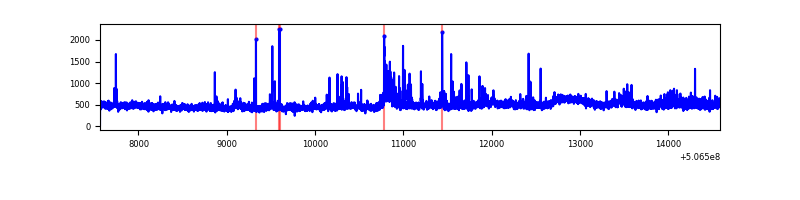 |
| C | 7023 | 7023 | 36 | 36 | 0.51% | 0.51% | 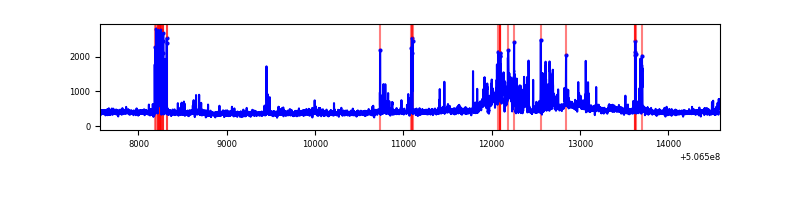 |
| D | 7023 | 7023 | 1554 | 1554 | 22.13% | 22.13% | 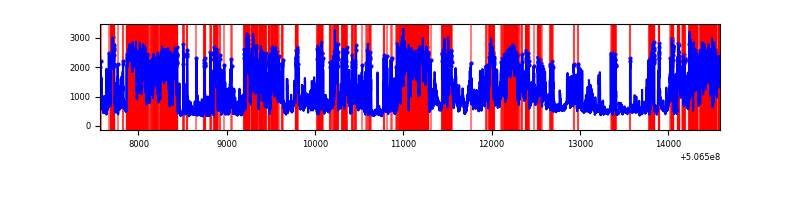 |
Top three noisy pixels from each quadrant. If the there are fewer than three noisy pixels in the level2.evt file, extra rows are filled as -1
| Pixel properties | Quadrant properties | ||||||
|---|---|---|---|---|---|---|---|
| Quadrant | DetID | PixID | Counts | Sigma | Mean | Median | Sigma |
| A | 15 | 32 | 6712735 | 46809.88 | 576 | 561 | 143.4 |
| A | 0 | 8 | 429964 | 2994.6 | 576 | 561 | 143.4 |
| A | 7 | 64 | 354107 | 2465.59 | 576 | 561 | 143.4 |
| B | 5 | 172 | 352143 | 2194.6 | 738 | 711 | 160.1 |
| B | 0 | 199 | 76745 | 474.81 | 738 | 711 | 160.1 |
| B | 7 | 252 | 49648 | 305.6 | 738 | 711 | 160.1 |
| C | 14 | 96 | 421050 | 2118.01 | 725 | 719 | 198.5 |
| C | 12 | 250 | 153170 | 768.19 | 725 | 719 | 198.5 |
| C | 15 | 200 | 15956 | 76.78 | 725 | 719 | 198.5 |
| D | 11 | 129 | 5030312 | 26651.61 | 665 | 635 | 188.7 |
| D | 8 | 245 | 564711 | 2988.96 | 665 | 635 | 188.7 |
| D | 2 | 249 | 259654 | 1372.51 | 665 | 635 | 188.7 |
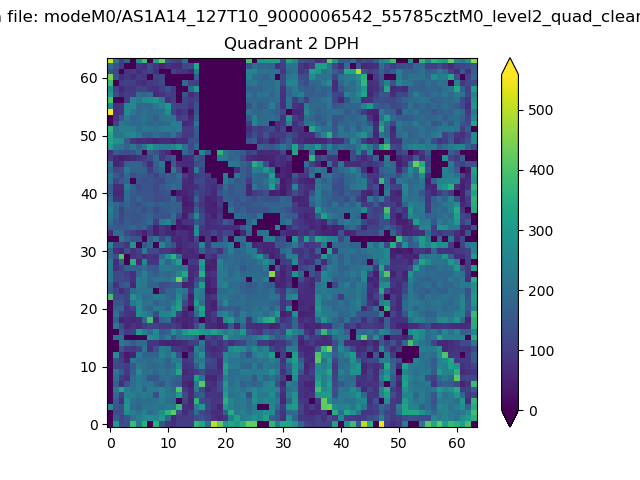
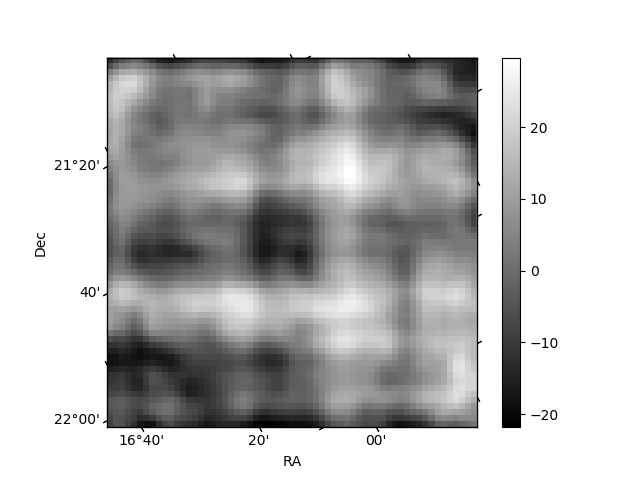
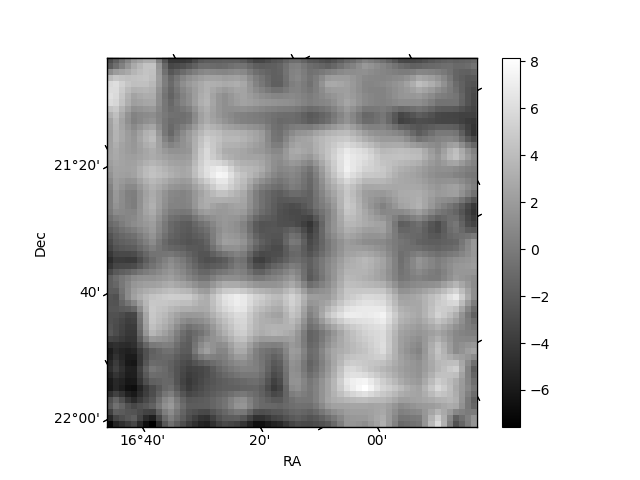
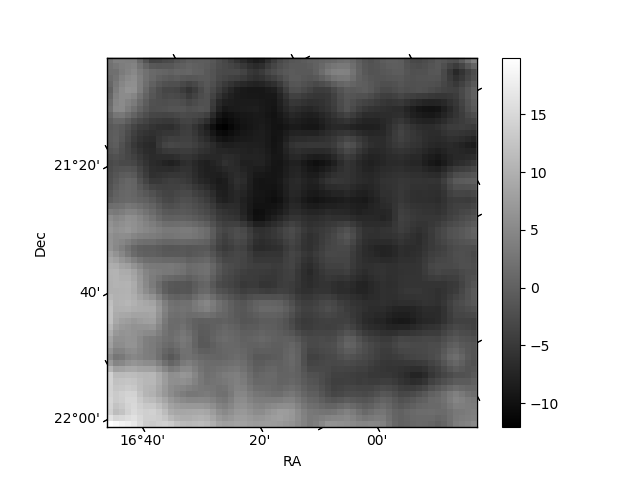
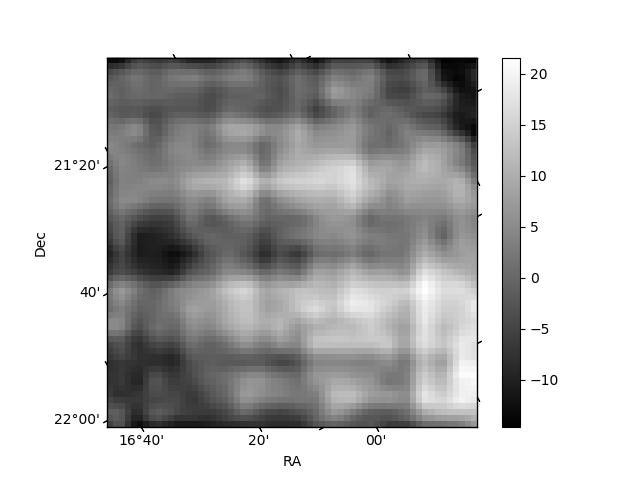
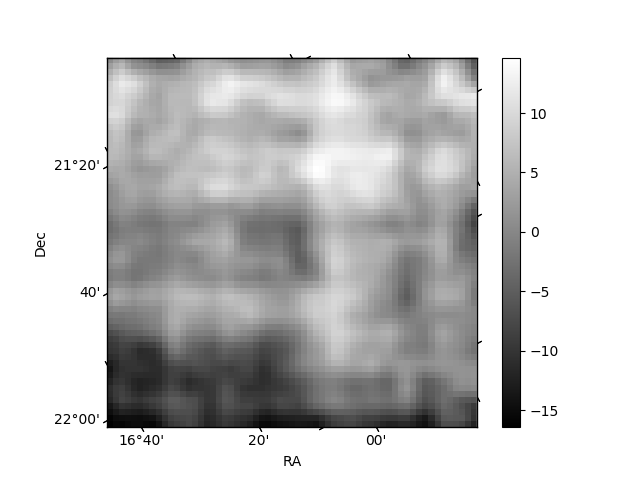
Histogram calculated using DETX and DETY for each event in the final _common_clean file
| Quadrant A | 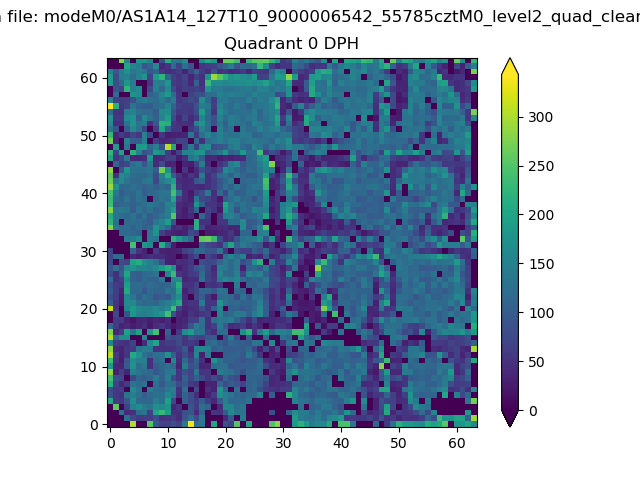 |
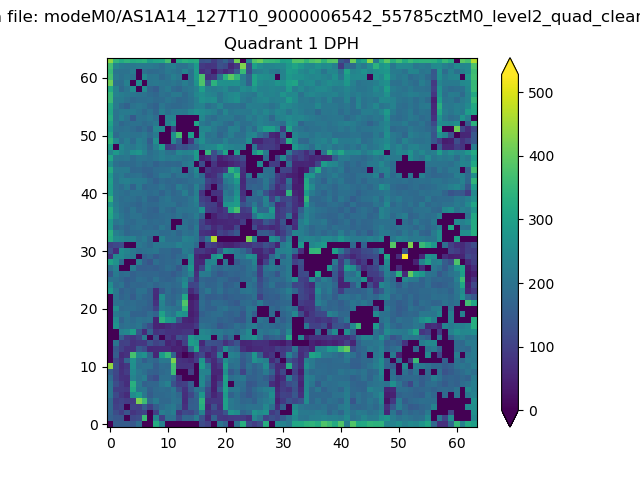 |
Quadrant B |
|---|---|---|---|
| Quadrant D | 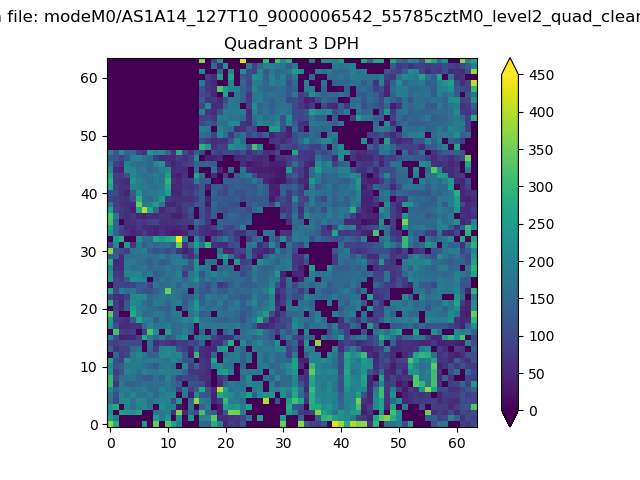 |
 |
Quadrant C |
| Plot type | Count rate plots | Images |
|---|---|---|
| Comparison with Poisson distribution Blue bars denote a histogram of data divided into 1 sec bins. Red curve is a Poisson curve with rate = median count rate of data. |
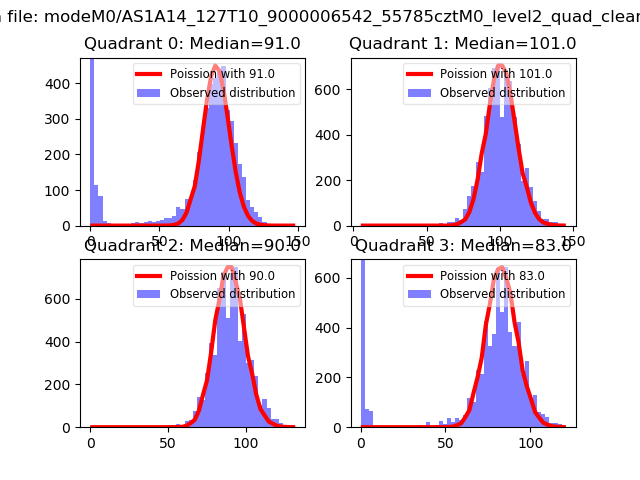 |
 |
| Quadrant-wise count rates Data is divided into 100 sec bins |
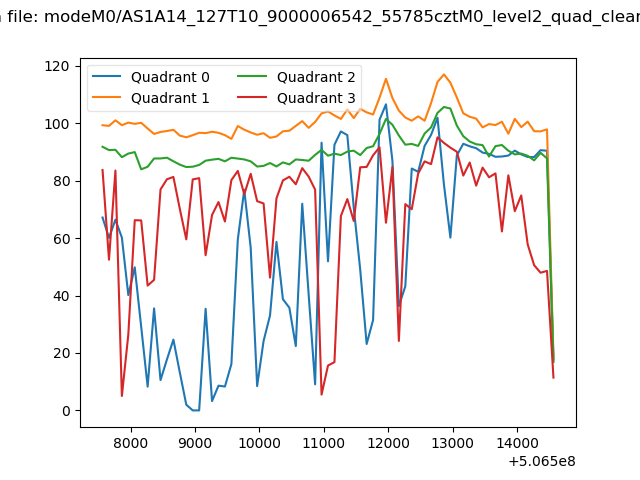 |
|
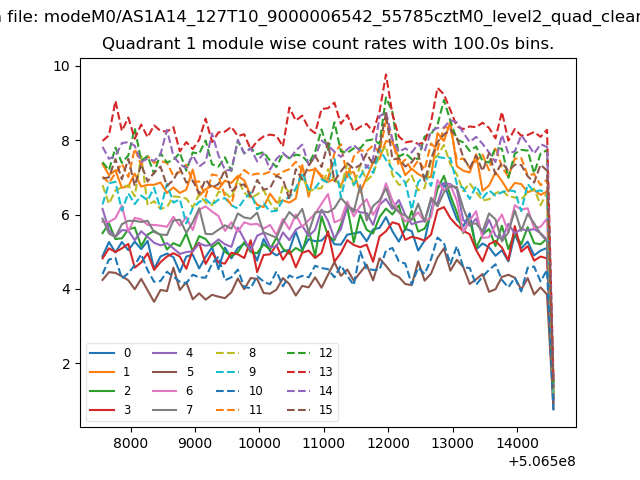
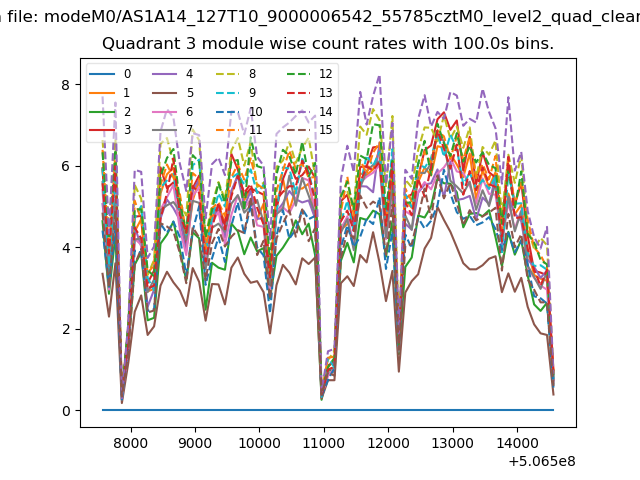
| Module-wise count rates for Quadrant A Data is divided into 100 sec bins |
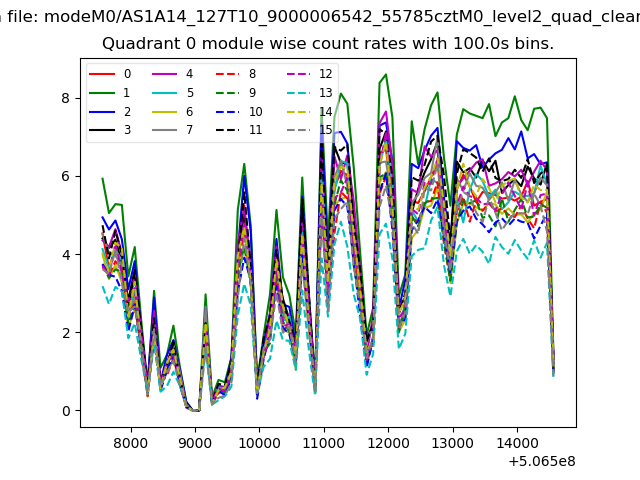 |
 |
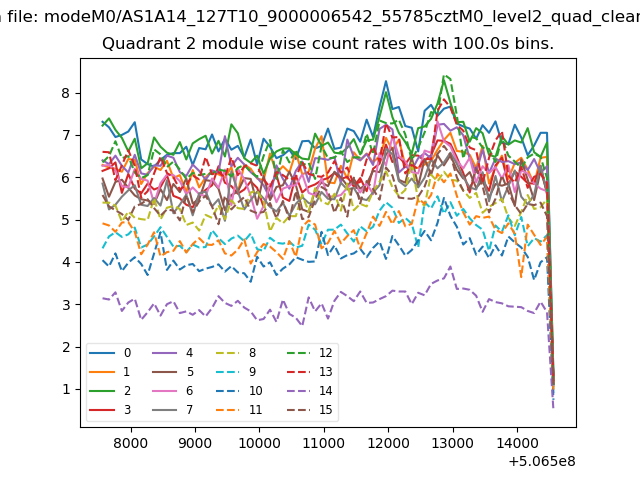
| Module-wise count rates for Quadrant B Data is divided into 100 sec bins |
 |
 |
| Module-wise count rates for Quadrant C Data is divided into 100 sec bins |
 |
 |
| Module-wise count rates for Quadrant D Data is divided into 100 sec bins |
 |
 |
| Parameter | Plot |
|---|---|
| CZT HV Monitor | 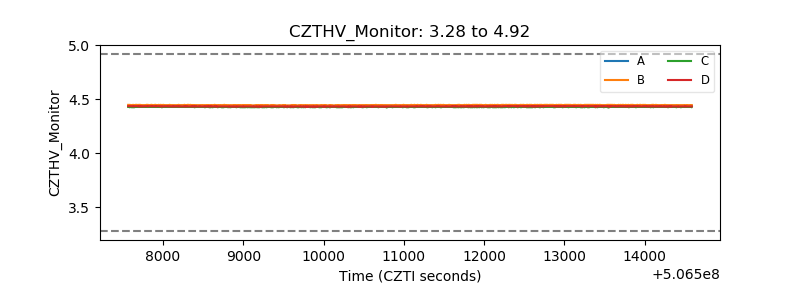 |
| D_VDD | 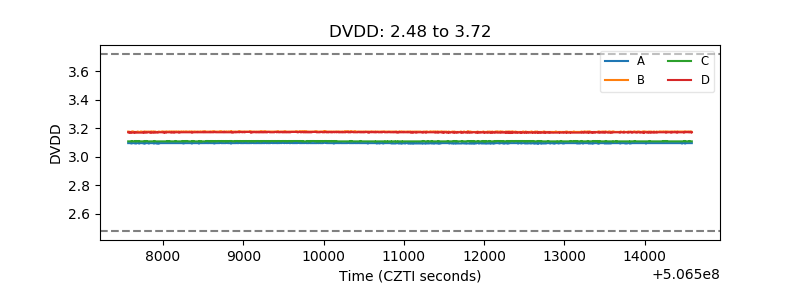 |
| Temperature 1 | 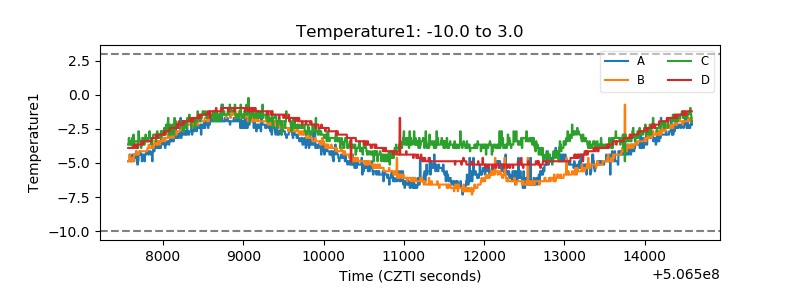 |
| Veto HV Monitor | 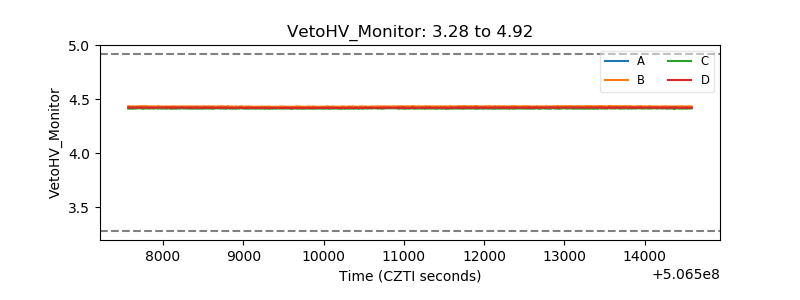 |
| Veto LLD | 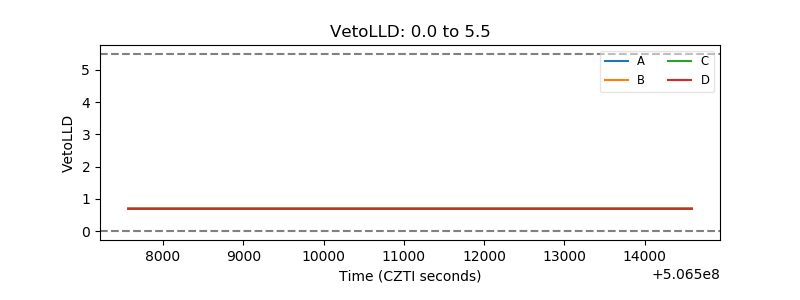 |
| Alpha Counter | 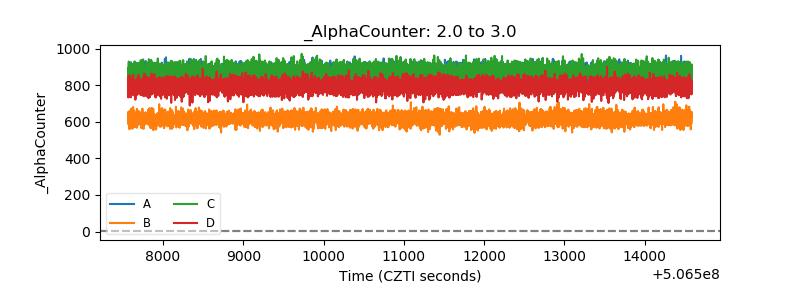 |
| _CPM_Rate | 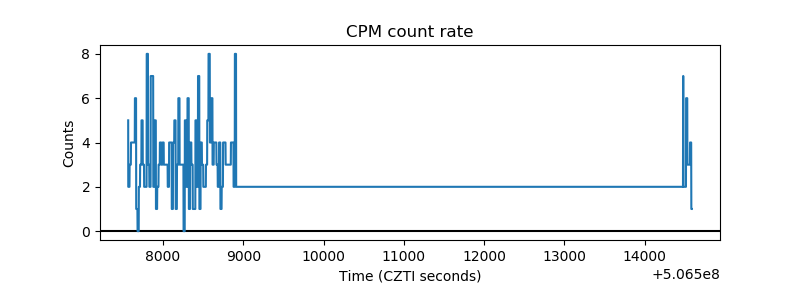 |
| CZT Counter | 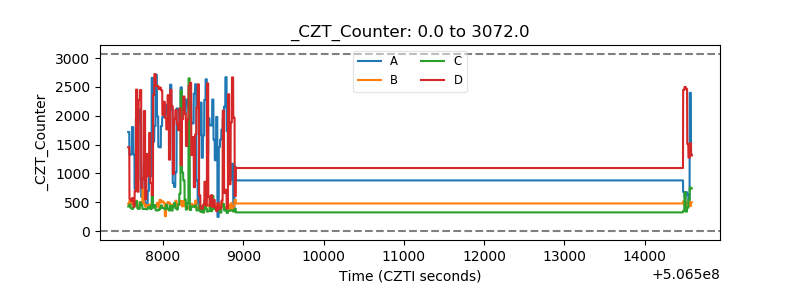 |
| +2.5 Volts monitor |  |
| +5 Volts monitor |  |
| _ROLL_ROT | 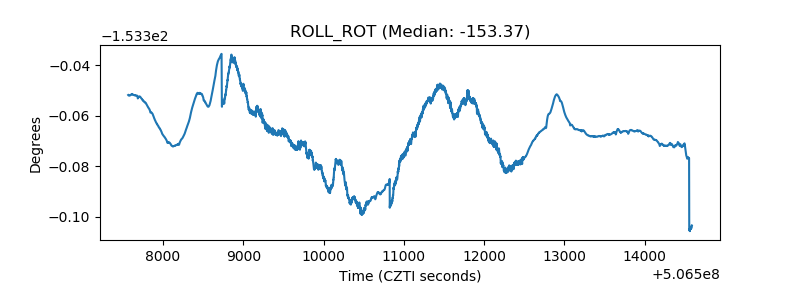 |
| _Roll_DEC | 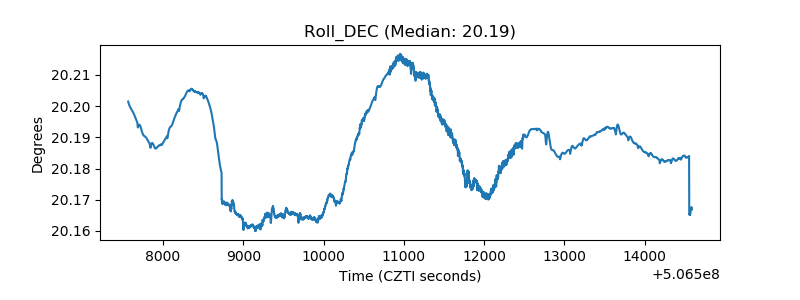 |
| _Roll_RA | 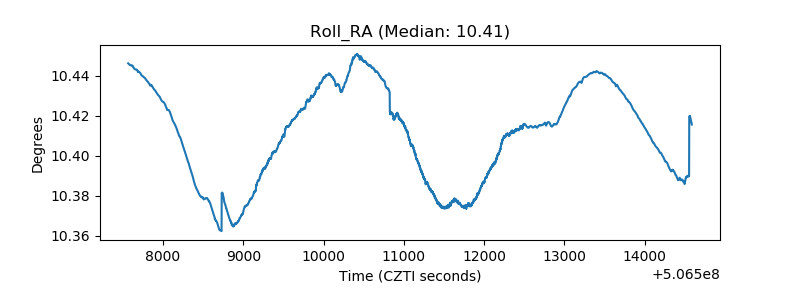 |
| Veto Counter | 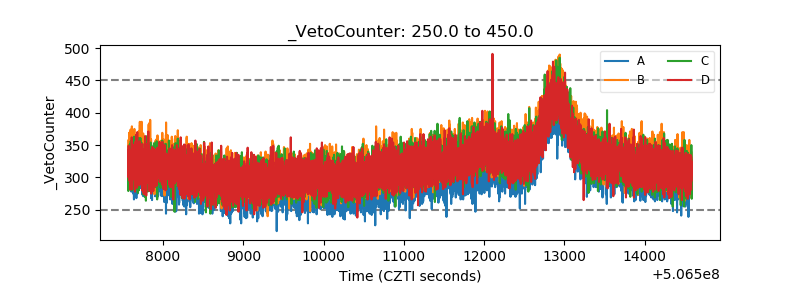 |