| Param | Original file | Final file |
|---|---|---|
| Filename | modeM0/AS1A14_127T10_9000006542_55786cztM0_level2.fits | modeM0/AS1A14_127T10_9000006542_55786cztM0_level2_quad_clean.evt |
| Size (bytes) | 602,438,400 | 101,577,600 |
| Size | 574.5 MB | 96.9 MB |
| Events in quadrant A | 6,587,738 | 614,588 |
| Events in quadrant B | 3,733,914 | 740,346 |
| Events in quadrant C | 3,481,412 | 660,006 |
| Events in quadrant D | 7,929,010 | 550,754 |
| Mode M0 | |||
|---|---|---|---|
| Quadrant | BADHDUFLAG | Total packets | Discarded packets |
| A | 0 | 24480 | 0 |
| B | 0 | 15551 | 0 |
| C | 0 | 16104 | 0 |
| D | 0 | 28523 | 0 |
| Mode SS | |||
|---|---|---|---|
| Quadrant | BADHDUFLAG | Total packets | Discarded packets |
| A | 0 | 146 | 0 |
| B | 0 | 146 | 0 |
| C | 0 | 146 | 0 |
| D | 0 | 146 | 0 |
| Quadrant | Total seconds | Saturated seconds | Saturation percentage |
|---|---|---|---|
| A | 7324 | 892 | 12.179137% |
| B | 7325 | 37 | 0.505119% |
| C | 7325 | 74 | 1.010239% |
| D | 7325 | 1134 | 15.481229% |
Noise dominated data is calculated using 1-second bins in cleaned event files. If a bin has >2000 counts, and if more than 50% of those come from <1% of pixels, then it is considered to be noise-dominated and hence unusable.
| Quadrant | # 1 sec bins | Bins with >0 counts | Bins with >2000 counts | High rate bins dominated by noise | Noise dominated (total time) | Noise dominated (detector-on time) | Marked lightcurve |
|---|---|---|---|---|---|---|---|
| A | 7324 | 7324 | 736 | 736 | 10.05% | 10.05% | 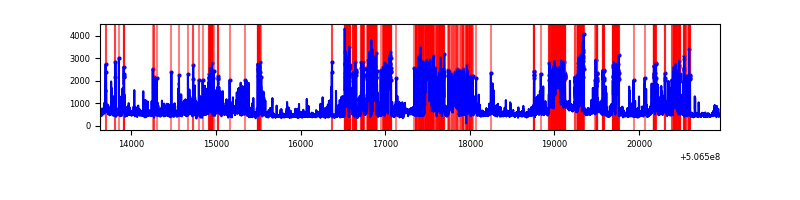 |
| B | 7325 | 7325 | 7 | 7 | 0.10% | 0.10% | 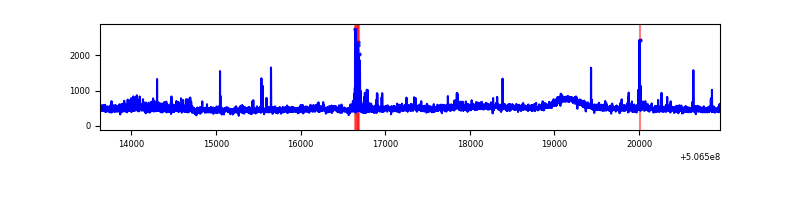 |
| C | 7325 | 7325 | 70 | 70 | 0.96% | 0.96% | 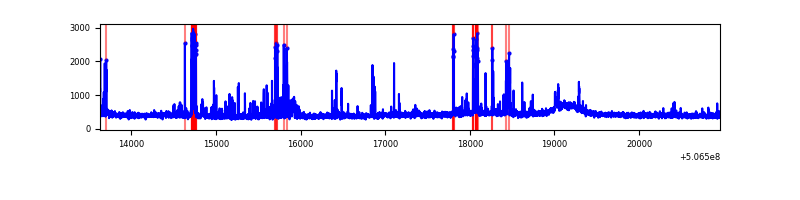 |
| D | 7325 | 7325 | 997 | 997 | 13.61% | 13.61% | 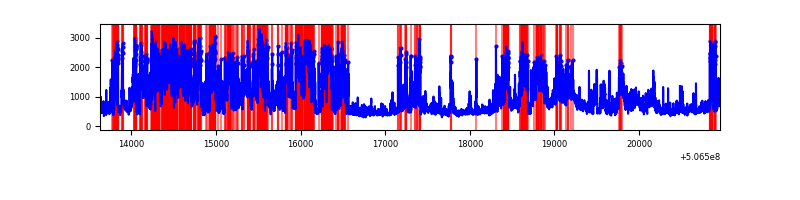 |
Top three noisy pixels from each quadrant. If the there are fewer than three noisy pixels in the level2.evt file, extra rows are filled as -1
| Pixel properties | Quadrant properties | ||||||
|---|---|---|---|---|---|---|---|
| Quadrant | DetID | PixID | Counts | Sigma | Mean | Median | Sigma |
| A | 15 | 32 | 2961399 | 15953.3 | 740 | 719 | 185.6 |
| A | 0 | 8 | 280830 | 1509.35 | 740 | 719 | 185.6 |
| A | 8 | 192 | 260068 | 1397.47 | 740 | 719 | 185.6 |
| B | 5 | 172 | 555646 | 3287.63 | 776 | 747 | 168.8 |
| B | 7 | 252 | 60540 | 354.26 | 776 | 747 | 168.8 |
| B | 10 | 247 | 22369 | 128.1 | 776 | 747 | 168.8 |
| C | 14 | 96 | 250474 | 1192.17 | 762 | 754 | 209.5 |
| C | 10 | 22 | 115989 | 550.13 | 762 | 754 | 209.5 |
| C | 15 | 200 | 70433 | 332.65 | 762 | 754 | 209.5 |
| D | 11 | 129 | 3606122 | 17658.66 | 726 | 697 | 204.2 |
| D | 8 | 245 | 843188 | 4126.36 | 726 | 697 | 204.2 |
| D | 11 | 224 | 299004 | 1461.05 | 726 | 697 | 204.2 |
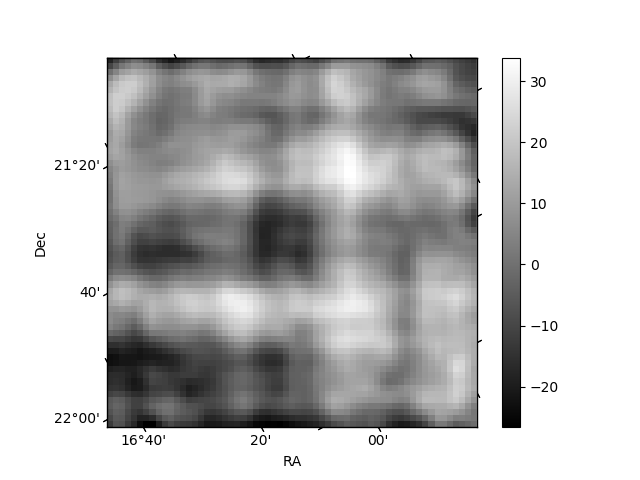
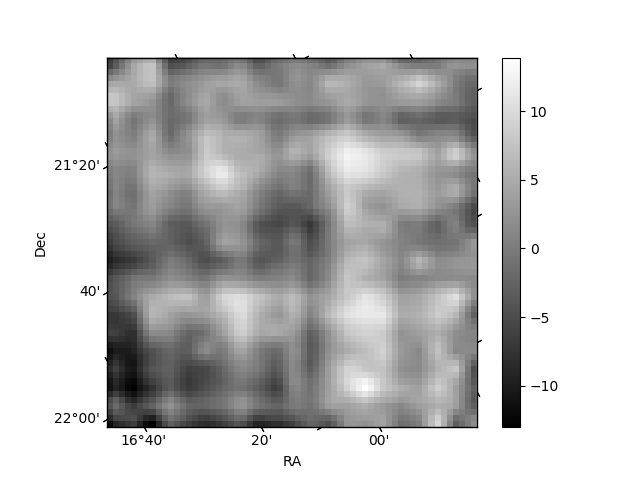
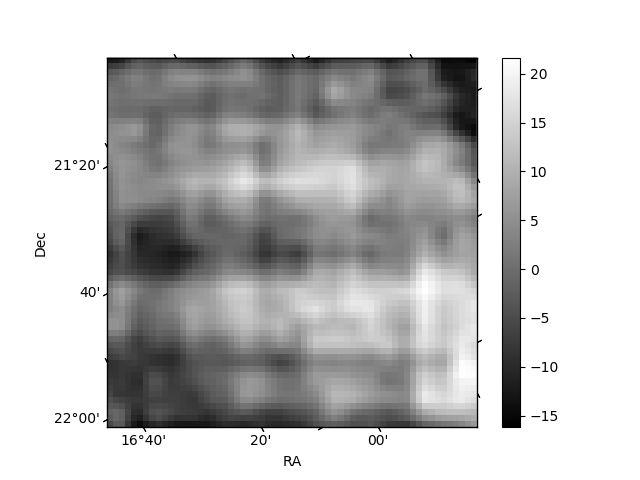
Histogram calculated using DETX and DETY for each event in the final _common_clean file
| Quadrant A | 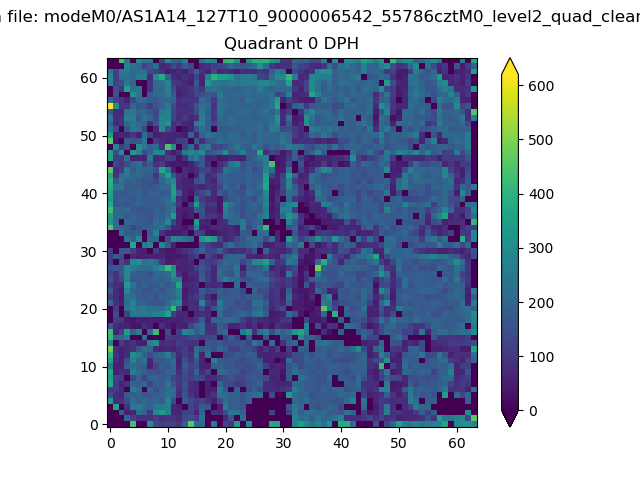 |
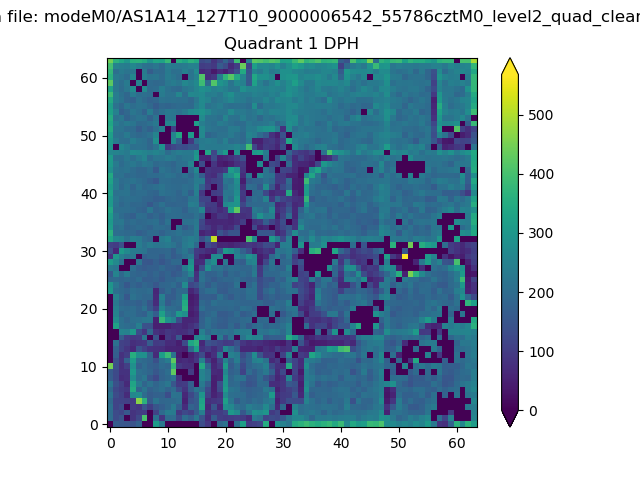 |
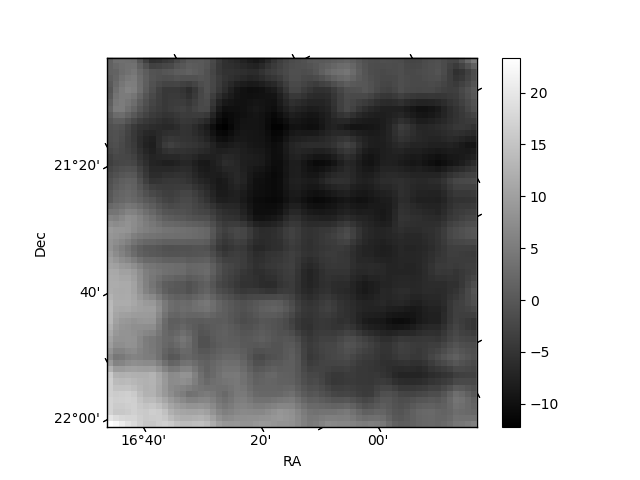
Quadrant B |
|---|---|---|---|
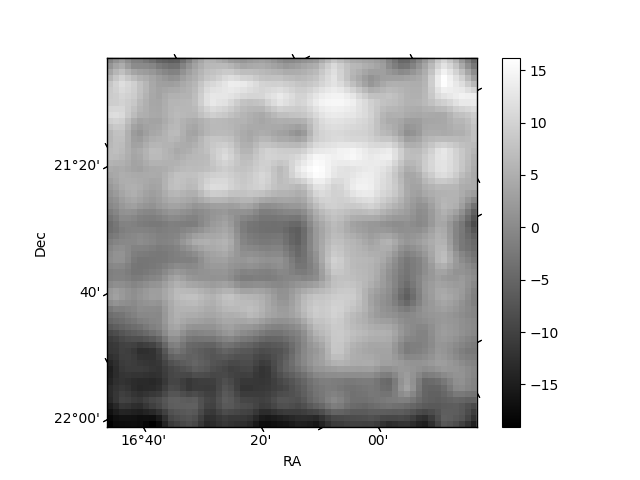
| Quadrant D | 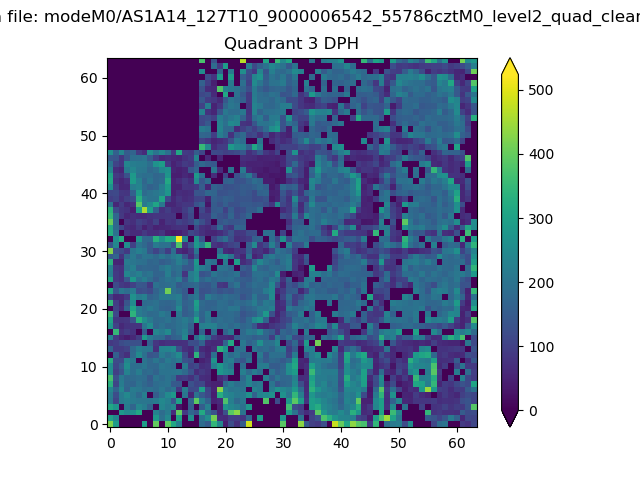 |
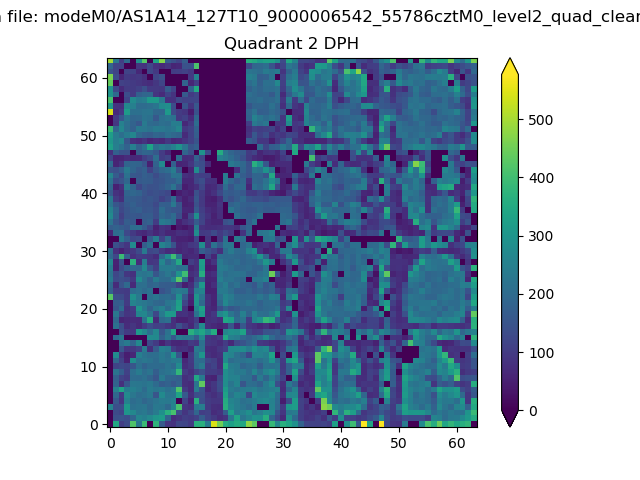 |
Quadrant C |
| Plot type | Count rate plots | Images |
|---|---|---|
| Comparison with Poisson distribution Blue bars denote a histogram of data divided into 1 sec bins. Red curve is a Poisson curve with rate = median count rate of data. |
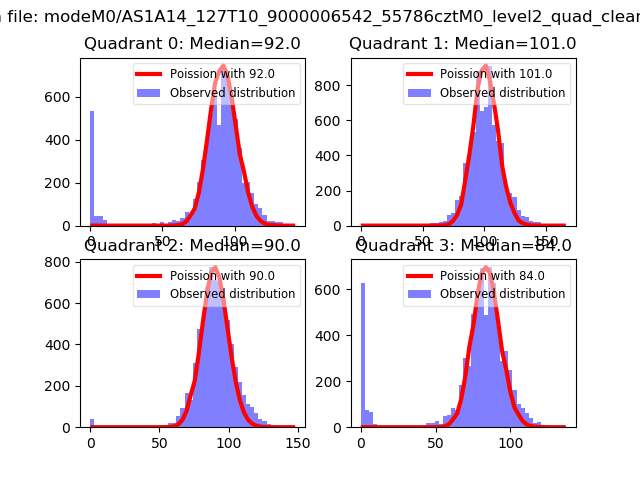 |
 |
| Quadrant-wise count rates Data is divided into 100 sec bins |
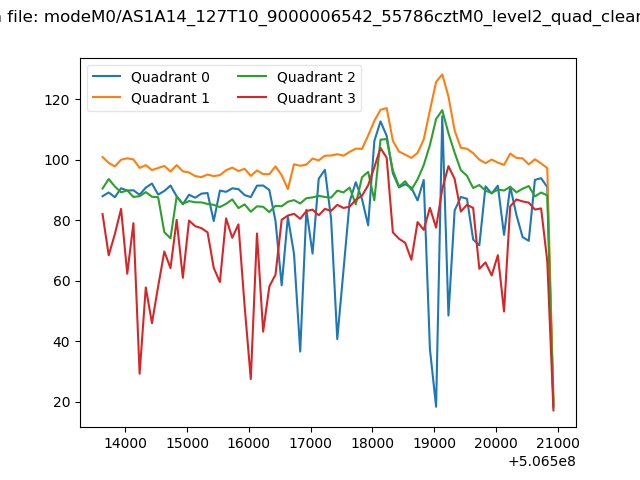 |
|
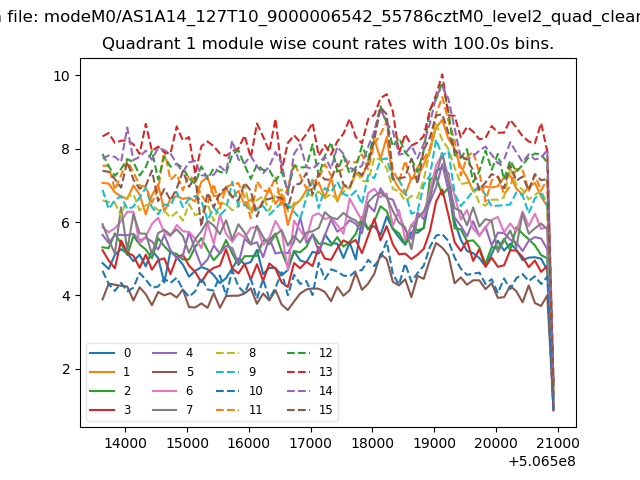
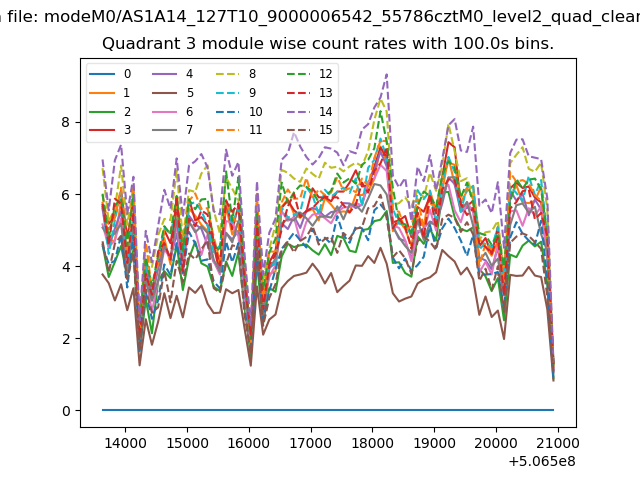
| Module-wise count rates for Quadrant A Data is divided into 100 sec bins |
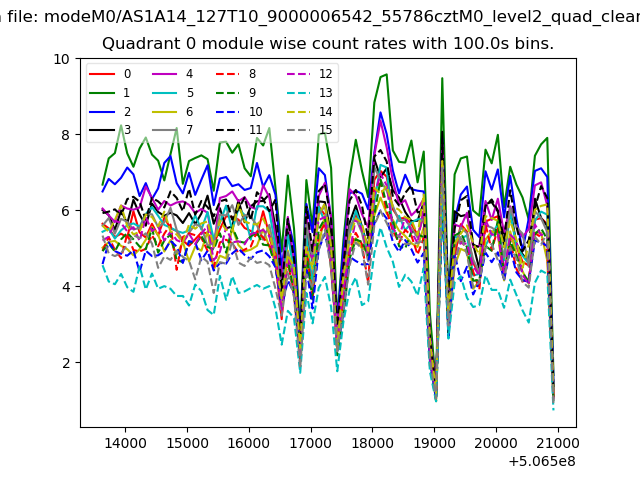 |
 |
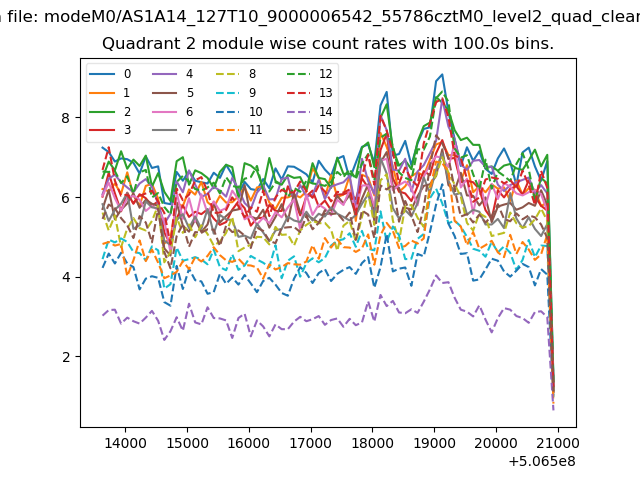
| Module-wise count rates for Quadrant B Data is divided into 100 sec bins |
 |
 |
| Module-wise count rates for Quadrant C Data is divided into 100 sec bins |
 |
 |
| Module-wise count rates for Quadrant D Data is divided into 100 sec bins |
 |
 |
| Parameter | Plot |
|---|---|
| CZT HV Monitor | 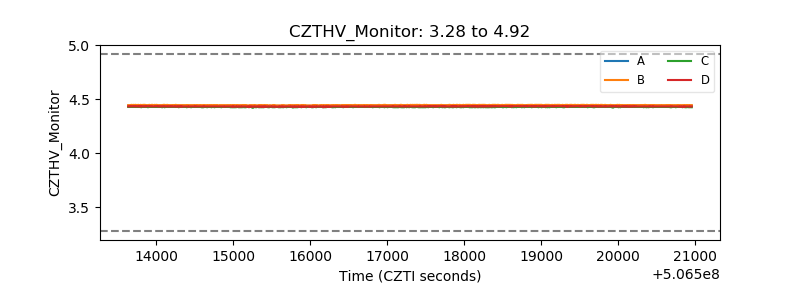 |
| D_VDD | 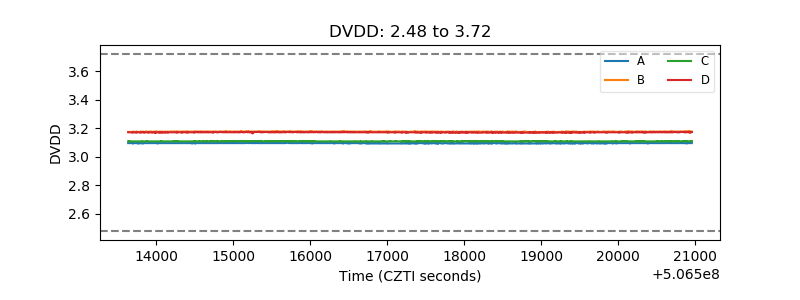 |
| Temperature 1 | 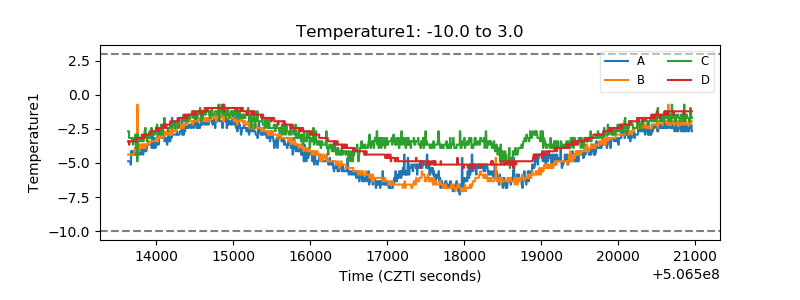 |
| Veto HV Monitor | 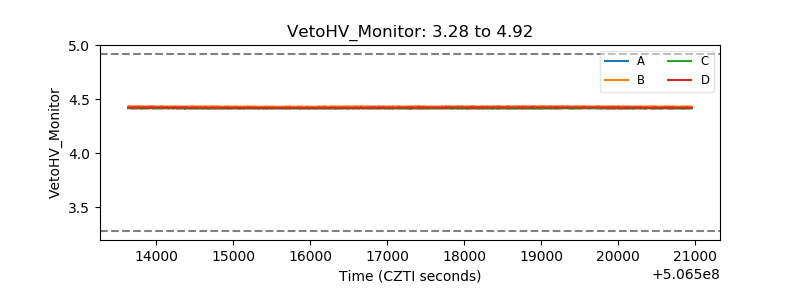 |
| Veto LLD | 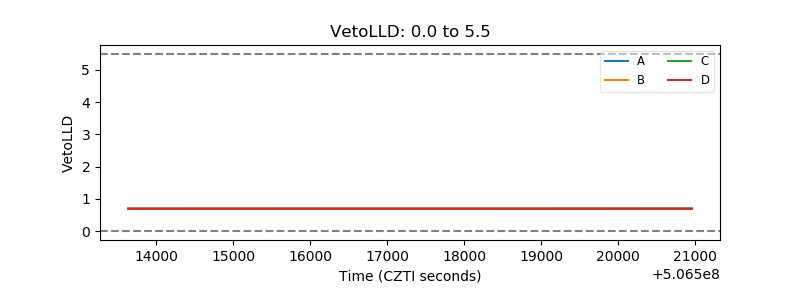 |
| Alpha Counter | 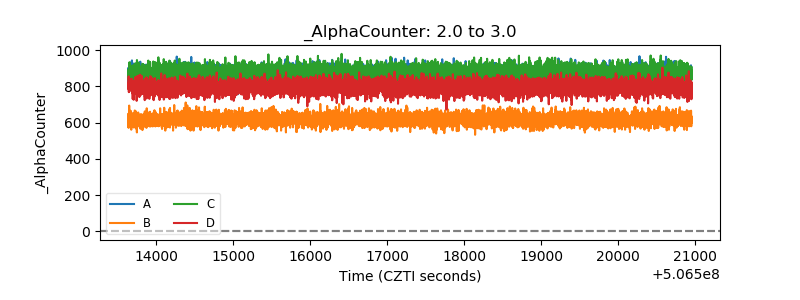 |
| _CPM_Rate | 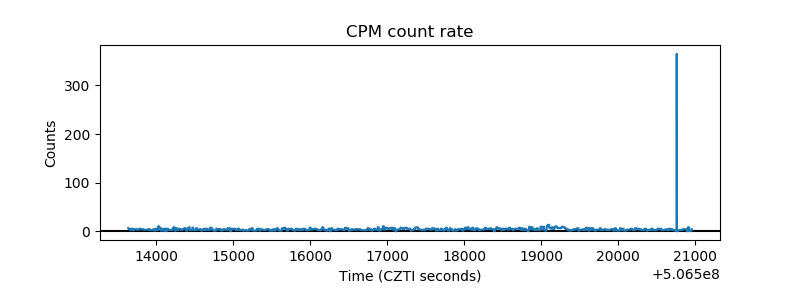 |
| CZT Counter | 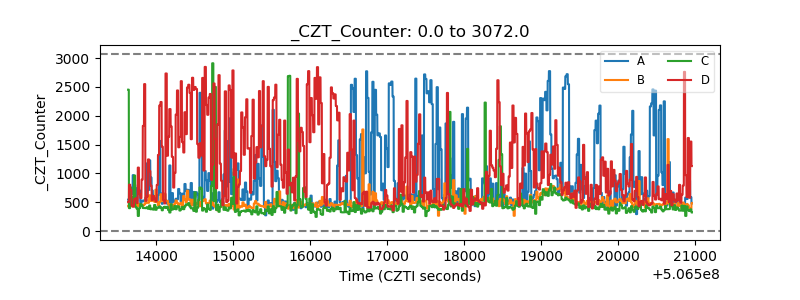 |
| +2.5 Volts monitor |  |
| +5 Volts monitor |  |
| _ROLL_ROT | 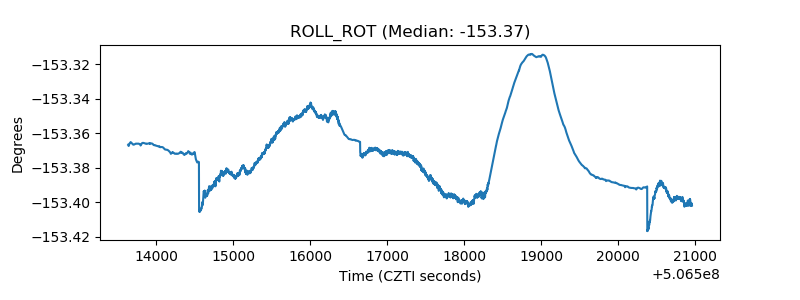 |
| _Roll_DEC | 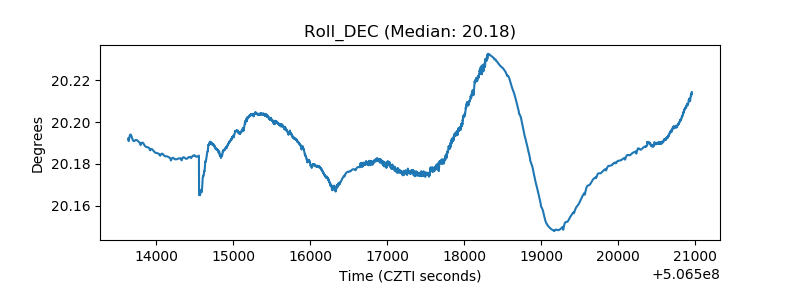 |
| _Roll_RA | 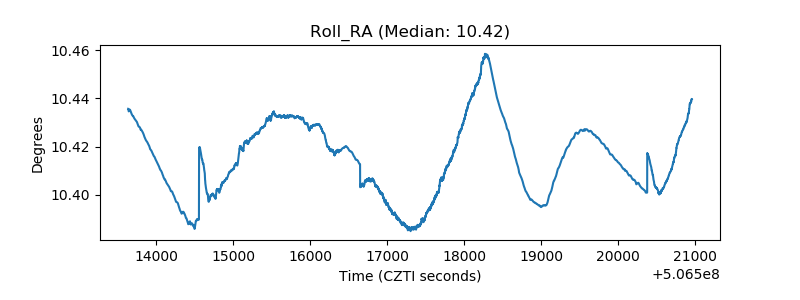 |
| Veto Counter | 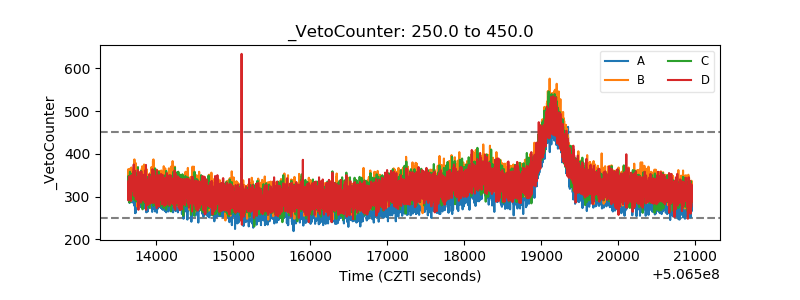 |