| Param | Original file | Final file |
|---|---|---|
| Filename | modeM0/AS1A14_127T10_9000006542_55790cztM0_level2.fits | modeM0/AS1A14_127T10_9000006542_55790cztM0_level2_quad_clean.evt |
| Size (bytes) | 650,206,080 | 96,321,600 |
| Size | 620.1 MB | 91.9 MB |
| Events in quadrant A | 9,478,173 | 526,641 |
| Events in quadrant B | 4,030,182 | 709,404 |
| Events in quadrant C | 3,273,142 | 635,476 |
| Events in quadrant D | 6,744,990 | 557,286 |
| Mode M0 | |||
|---|---|---|---|
| Quadrant | BADHDUFLAG | Total packets | Discarded packets |
| A | 0 | 32986 | 3 |
| B | 0 | 16579 | 2 |
| C | 0 | 15091 | 2 |
| D | 0 | 24914 | 2 |
| Mode M9 | |||
|---|---|---|---|
| Quadrant | BADHDUFLAG | Total packets | Discarded packets |
| A | 0 | 11 | 0 |
| B | 0 | 12 | 0 |
| C | 0 | 12 | 0 |
| D | 0 | 12 | 0 |
| Mode SS | |||
|---|---|---|---|
| Quadrant | BADHDUFLAG | Total packets | Discarded packets |
| A | 0 | 142 | 0 |
| B | 0 | 142 | 0 |
| C | 0 | 142 | 0 |
| D | 0 | 142 | 0 |
| Quadrant | Total seconds | Saturated seconds | Saturation percentage |
|---|---|---|---|
| A | 6998 | 1687 | 24.106888% |
| B | 6998 | 112 | 1.600457% |
| C | 6998 | 68 | 0.971706% |
| D | 6998 | 675 | 9.645613% |
Noise dominated data is calculated using 1-second bins in cleaned event files. If a bin has >2000 counts, and if more than 50% of those come from <1% of pixels, then it is considered to be noise-dominated and hence unusable.
| Quadrant | # 1 sec bins | Bins with >0 counts | Bins with >2000 counts | High rate bins dominated by noise | Noise dominated (total time) | Noise dominated (detector-on time) | Marked lightcurve |
|---|---|---|---|---|---|---|---|
| A | 7898 | 6999 | 1722 | 1722 | 21.80% | 24.60% | 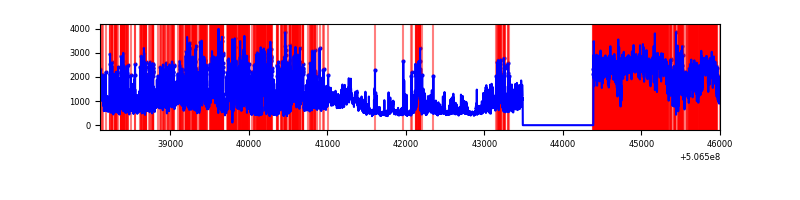 |
| B | 7898 | 6999 | 50 | 50 | 0.63% | 0.71% | 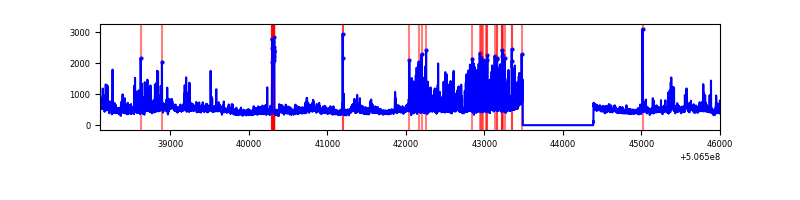 |
| C | 7898 | 6999 | 55 | 55 | 0.70% | 0.79% | 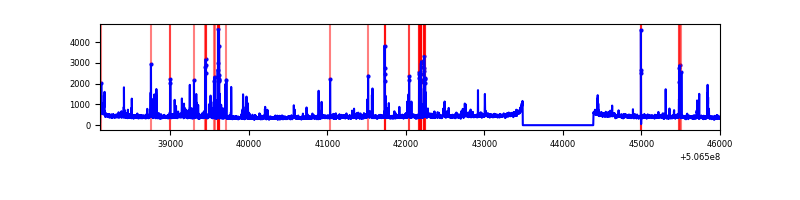 |
| D | 7898 | 6999 | 697 | 697 | 8.83% | 9.96% | 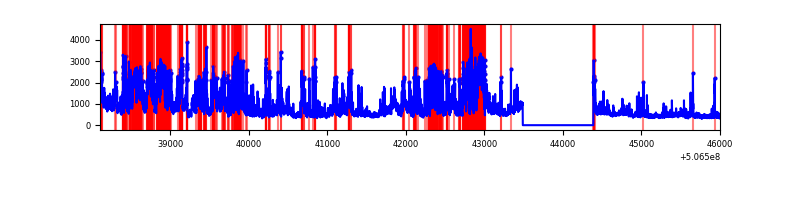 |
Top three noisy pixels from each quadrant. If the there are fewer than three noisy pixels in the level2.evt file, extra rows are filled as -1
| Pixel properties | Quadrant properties | ||||||
|---|---|---|---|---|---|---|---|
| Quadrant | DetID | PixID | Counts | Sigma | Mean | Median | Sigma |
| A | 15 | 32 | 3476755 | 20647.24 | 673 | 656 | 168.4 |
| A | 12 | 115 | 2865579 | 17016.99 | 673 | 656 | 168.4 |
| A | 8 | 192 | 261673 | 1550.38 | 673 | 656 | 168.4 |
| B | 5 | 172 | 558599 | 3541.14 | 729 | 701 | 157.5 |
| B | 7 | 0 | 424153 | 2687.77 | 729 | 701 | 157.5 |
| B | 0 | 173 | 59842 | 375.38 | 729 | 701 | 157.5 |
| C | 13 | 3 | 322719 | 1631.31 | 721 | 715 | 197.4 |
| C | 9 | 38 | 57577 | 288.07 | 721 | 715 | 197.4 |
| C | 12 | 250 | 33416 | 165.67 | 721 | 715 | 197.4 |
| D | 11 | 129 | 3333040 | 17083.48 | 690 | 662 | 195.1 |
| D | 3 | 12 | 371017 | 1898.63 | 690 | 662 | 195.1 |
| D | 8 | 245 | 97020 | 493.98 | 690 | 662 | 195.1 |
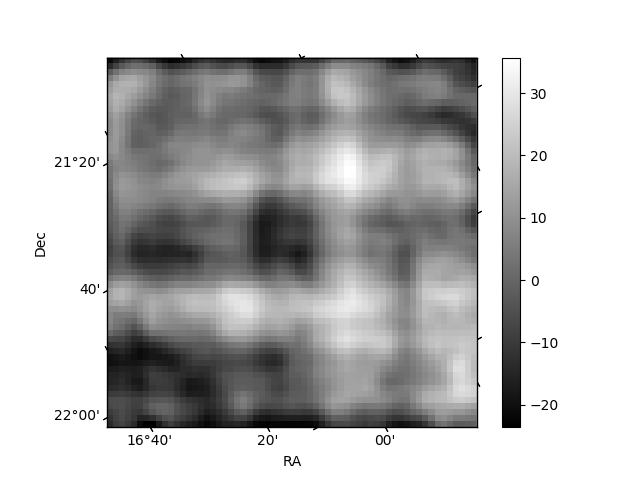
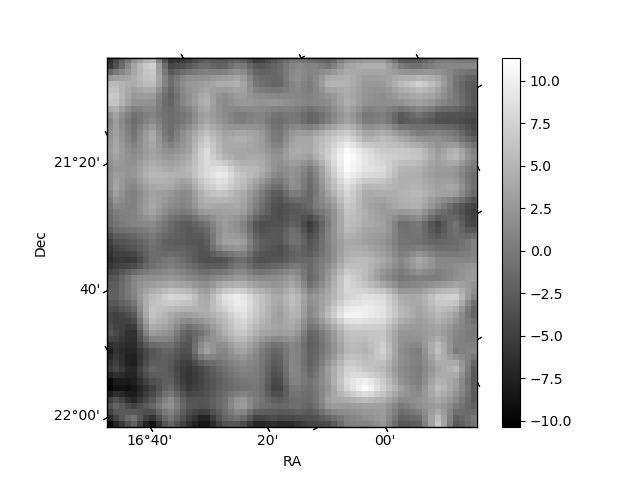
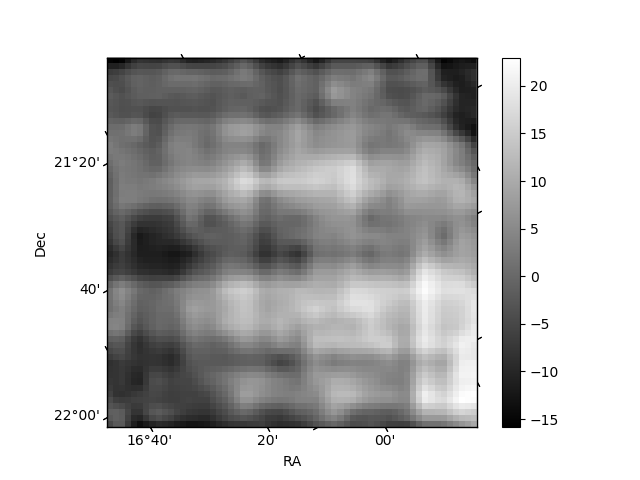
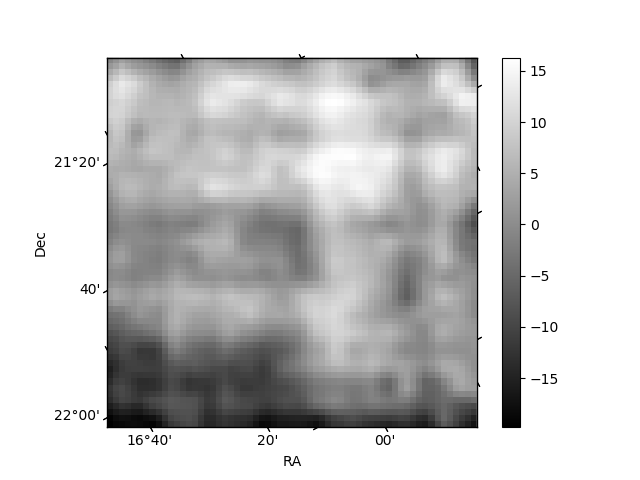
Histogram calculated using DETX and DETY for each event in the final _common_clean file
| Quadrant A | 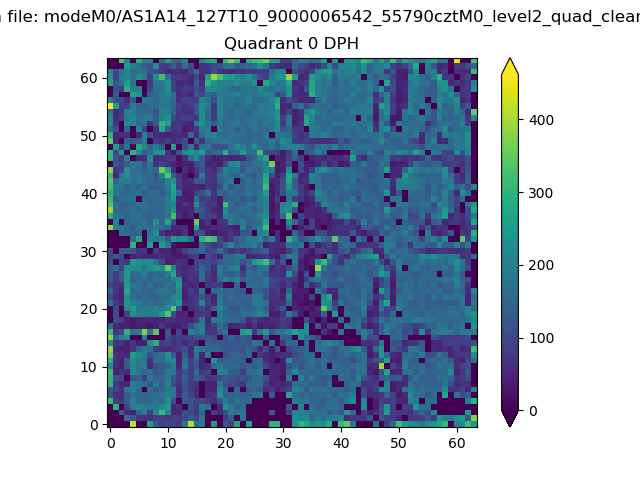 |
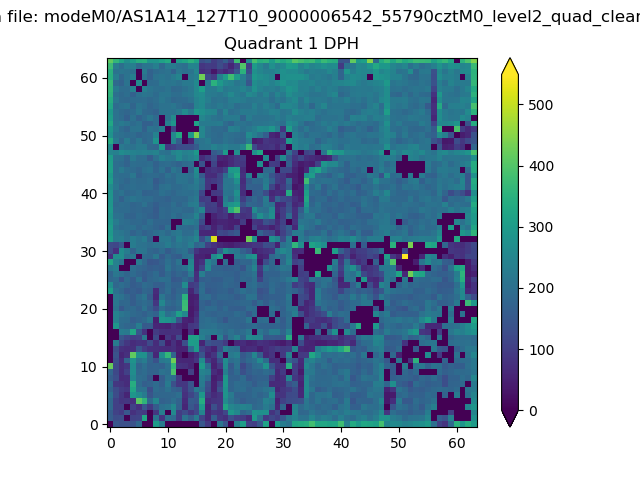 |
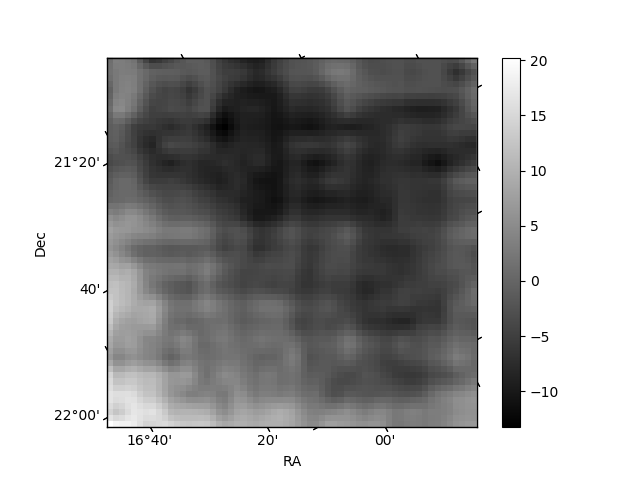
Quadrant B |
|---|---|---|---|
| Quadrant D | 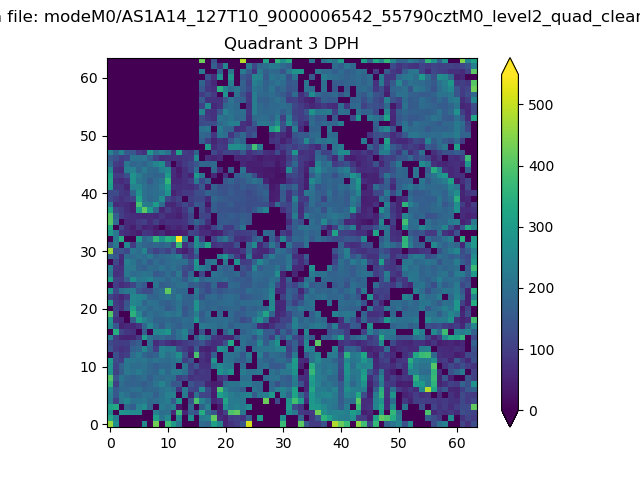 |
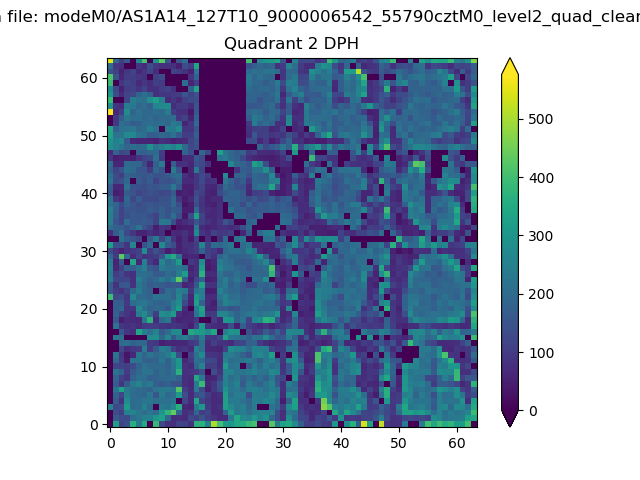 |
Quadrant C |
| Plot type | Count rate plots | Images |
|---|---|---|
| Comparison with Poisson distribution Blue bars denote a histogram of data divided into 1 sec bins. Red curve is a Poisson curve with rate = median count rate of data. |
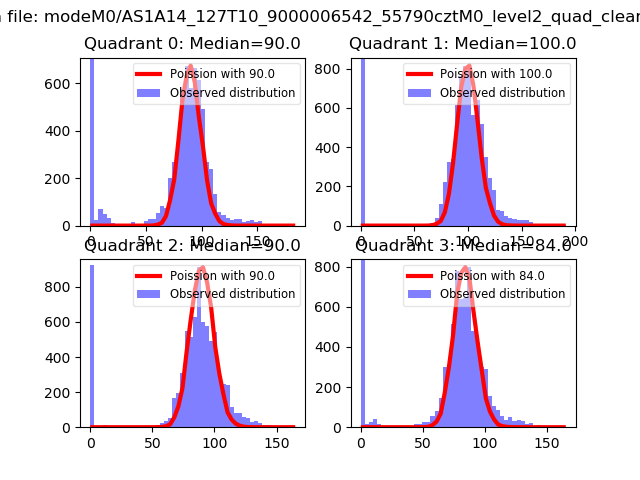 |
 |
| Quadrant-wise count rates Data is divided into 100 sec bins |
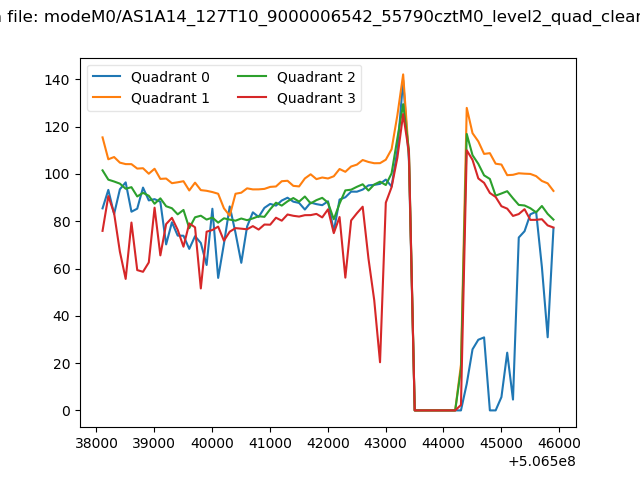 |
|
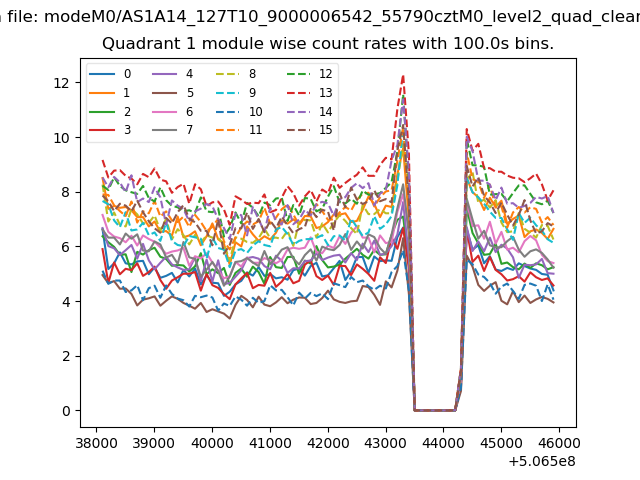
| Module-wise count rates for Quadrant A Data is divided into 100 sec bins |
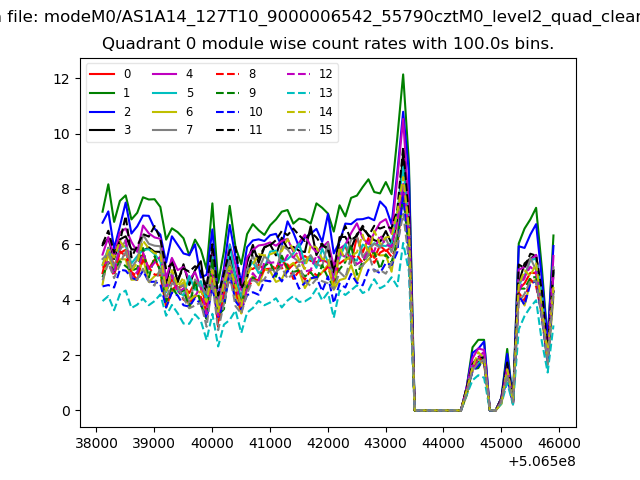 |
 |
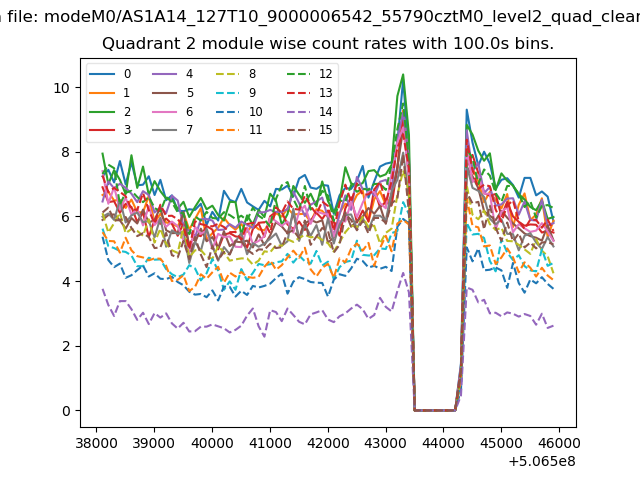
| Module-wise count rates for Quadrant B Data is divided into 100 sec bins |
 |
 |
| Module-wise count rates for Quadrant C Data is divided into 100 sec bins |
 |
 |
| Module-wise count rates for Quadrant D Data is divided into 100 sec bins |
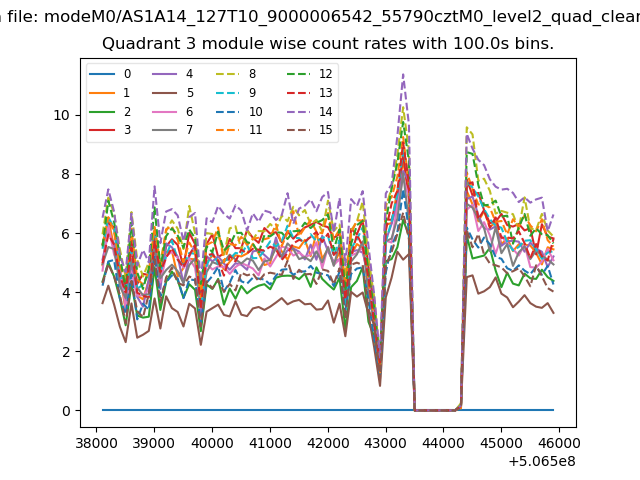 |
 |
| Parameter | Plot |
|---|---|
| CZT HV Monitor | 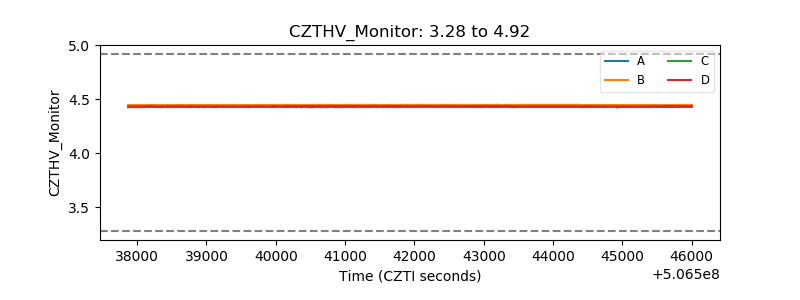 |
| D_VDD | 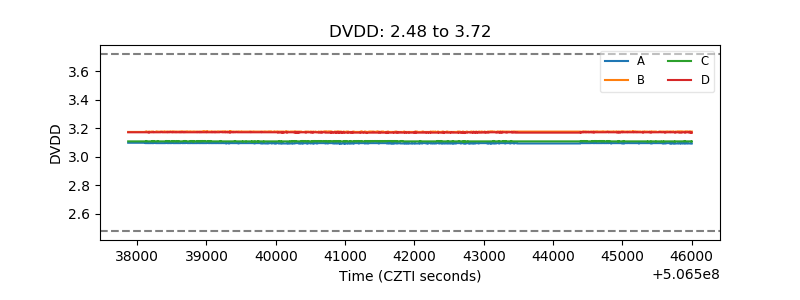 |
| Temperature 1 | 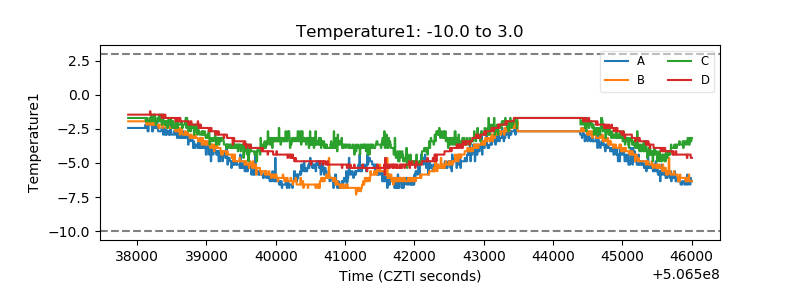 |
| Veto HV Monitor | 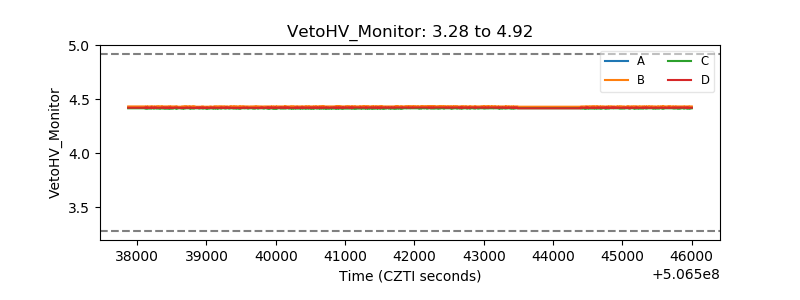 |
| Veto LLD | 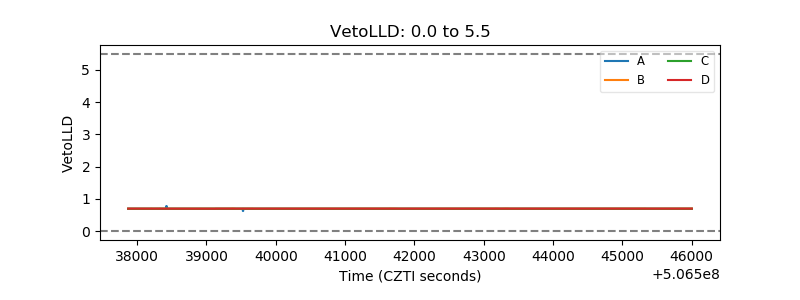 |
| Alpha Counter | 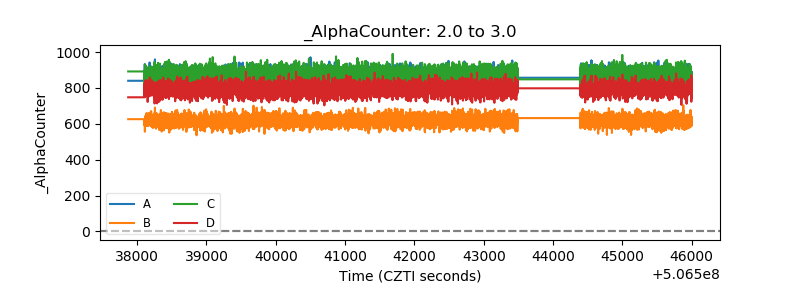 |
| _CPM_Rate | 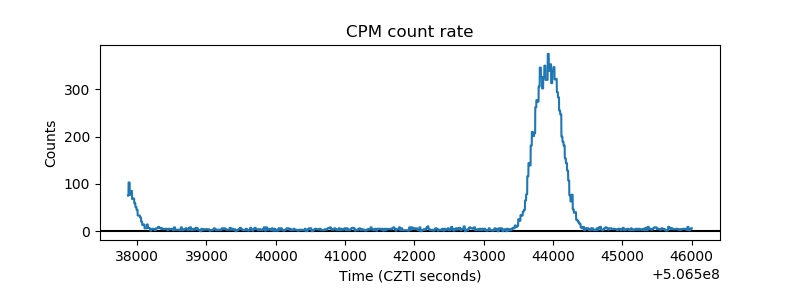 |
| CZT Counter | 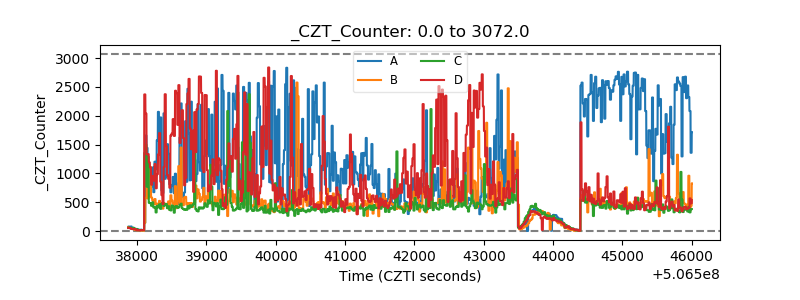 |
| +2.5 Volts monitor |  |
| +5 Volts monitor |  |
| _ROLL_ROT | 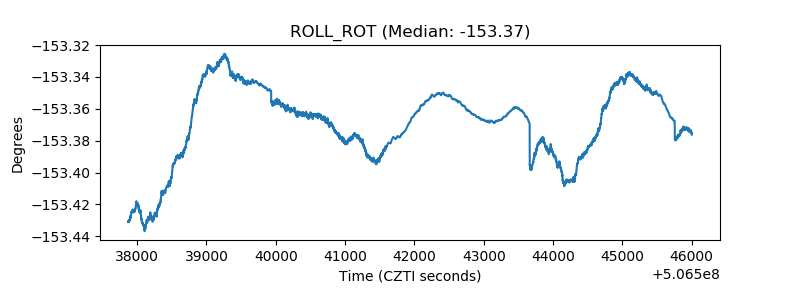 |
| _Roll_DEC |  |
| _Roll_RA | 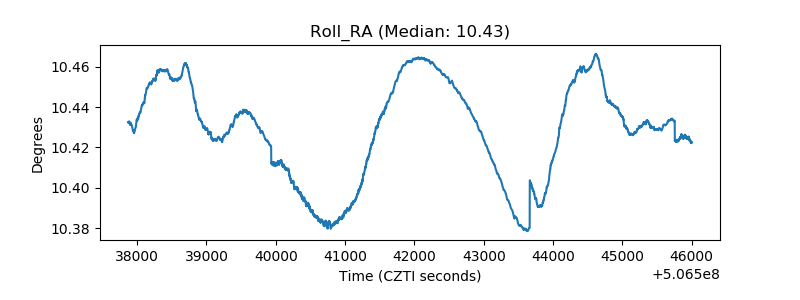 |
| Veto Counter | 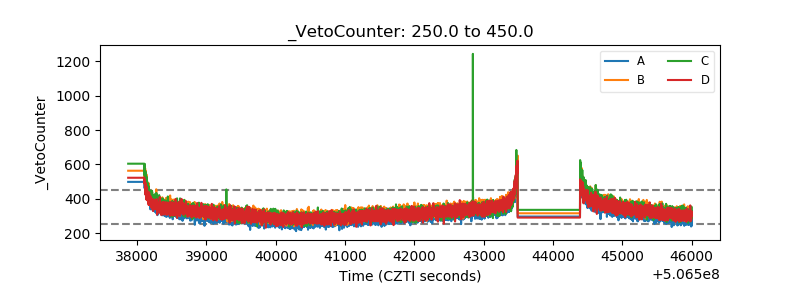 |