| Param | Original file | Final file |
|---|---|---|
| Filename | modeM0/AS1A14_127T10_9000006542_55792cztM0_level2.fits | modeM0/AS1A14_127T10_9000006542_55792cztM0_level2_quad_clean.evt |
| Size (bytes) | 590,402,880 | 91,258,560 |
| Size | 563.1 MB | 87.0 MB |
| Events in quadrant A | 8,300,537 | 520,544 |
| Events in quadrant B | 3,084,904 | 678,107 |
| Events in quadrant C | 3,242,736 | 604,303 |
| Events in quadrant D | 6,716,606 | 501,427 |
| Mode M0 | |||
|---|---|---|---|
| Quadrant | BADHDUFLAG | Total packets | Discarded packets |
| A | 0 | 29182 | 1 |
| B | 0 | 13947 | 1 |
| C | 0 | 14691 | 1 |
| D | 0 | 24520 | 1 |
| Mode M9 | |||
|---|---|---|---|
| Quadrant | BADHDUFLAG | Total packets | Discarded packets |
| A | 0 | 10 | 0 |
| B | 0 | 10 | 0 |
| C | 0 | 10 | 0 |
| D | 0 | 10 | 0 |
| Mode SS | |||
|---|---|---|---|
| Quadrant | BADHDUFLAG | Total packets | Discarded packets |
| A | 0 | 134 | 0 |
| B | 0 | 134 | 0 |
| C | 0 | 134 | 0 |
| D | 0 | 134 | 0 |
| Quadrant | Total seconds | Saturated seconds | Saturation percentage |
|---|---|---|---|
| A | 6575 | 1404 | 21.353612% |
| B | 6575 | 44 | 0.669202% |
| C | 6576 | 80 | 1.216545% |
| D | 6576 | 987 | 15.009124% |
Noise dominated data is calculated using 1-second bins in cleaned event files. If a bin has >2000 counts, and if more than 50% of those come from <1% of pixels, then it is considered to be noise-dominated and hence unusable.
| Quadrant | # 1 sec bins | Bins with >0 counts | Bins with >2000 counts | High rate bins dominated by noise | Noise dominated (total time) | Noise dominated (detector-on time) | Marked lightcurve |
|---|---|---|---|---|---|---|---|
| A | 7611 | 6576 | 1445 | 1445 | 18.99% | 21.97% | 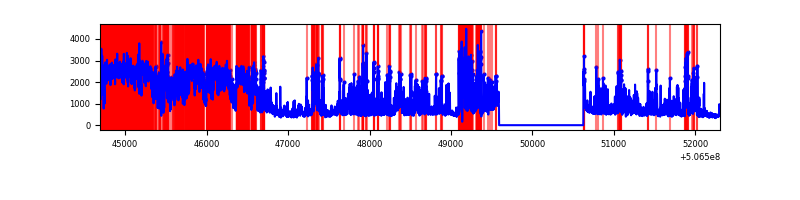 |
| B | 7611 | 6576 | 1 | 1 | 0.01% | 0.02% | 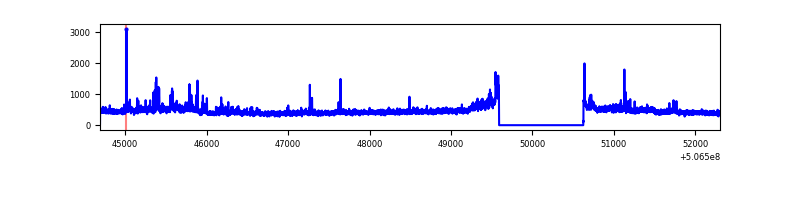 |
| C | 7612 | 6577 | 69 | 69 | 0.91% | 1.05% | 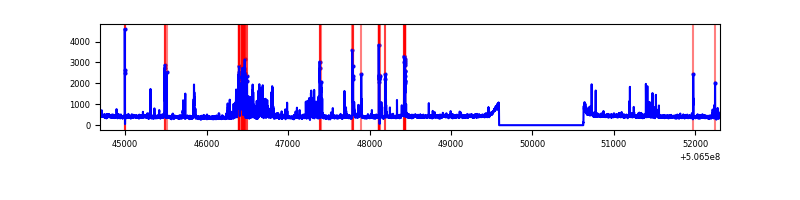 |
| D | 7612 | 6577 | 869 | 869 | 11.42% | 13.21% | 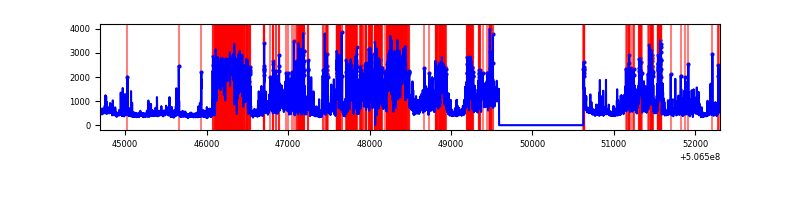 |
Top three noisy pixels from each quadrant. If the there are fewer than three noisy pixels in the level2.evt file, extra rows are filled as -1
| Pixel properties | Quadrant properties | ||||||
|---|---|---|---|---|---|---|---|
| Quadrant | DetID | PixID | Counts | Sigma | Mean | Median | Sigma |
| A | 12 | 115 | 2905503 | 17941.55 | 643 | 625 | 161.9 |
| A | 15 | 32 | 2460676 | 15194.14 | 643 | 625 | 161.9 |
| A | 8 | 192 | 300627 | 1852.92 | 643 | 625 | 161.9 |
| B | 7 | 0 | 246157 | 1646.83 | 690 | 663 | 149.1 |
| B | 0 | 199 | 45355 | 299.8 | 690 | 663 | 149.1 |
| B | 7 | 252 | 26272 | 171.79 | 690 | 663 | 149.1 |
| C | 12 | 250 | 336440 | 1796.65 | 681 | 675 | 186.9 |
| C | 9 | 38 | 116005 | 617.12 | 681 | 675 | 186.9 |
| C | 15 | 200 | 52105 | 275.2 | 681 | 675 | 186.9 |
| D | 11 | 129 | 3580798 | 19759.39 | 637 | 609 | 181.2 |
| D | 15 | 125 | 214752 | 1181.87 | 637 | 609 | 181.2 |
| D | 3 | 12 | 101054 | 554.37 | 637 | 609 | 181.2 |
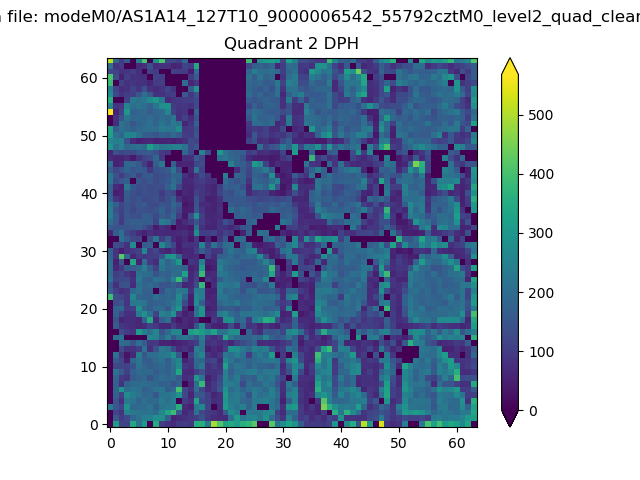
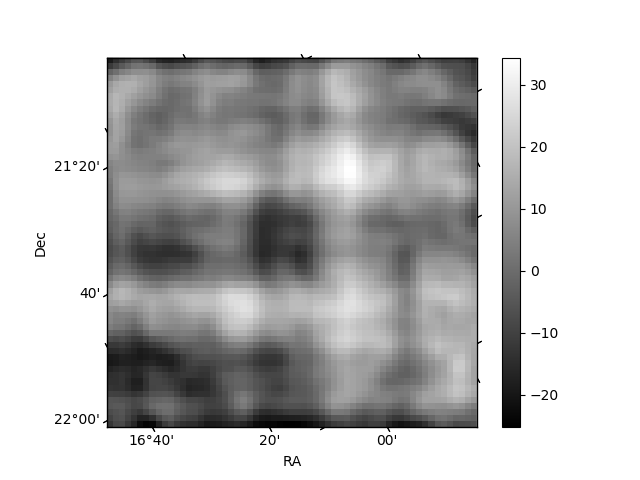
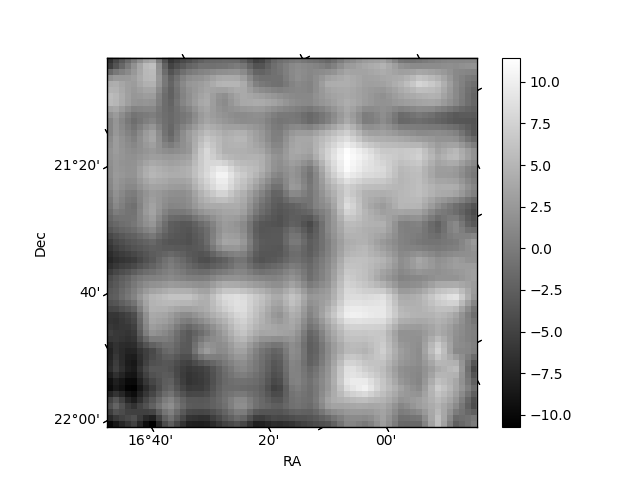
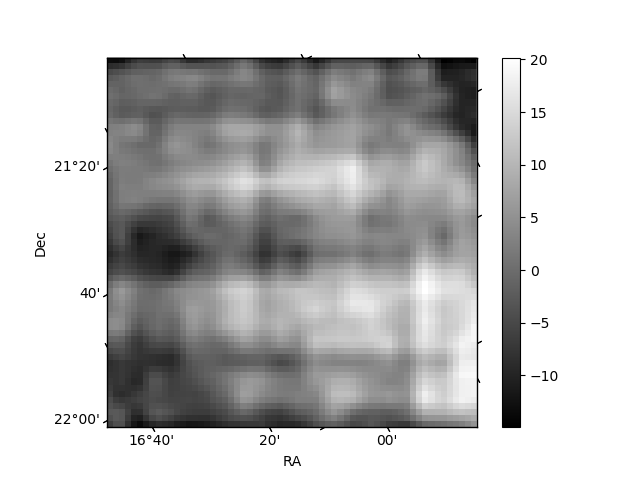
Histogram calculated using DETX and DETY for each event in the final _common_clean file
| Quadrant A | 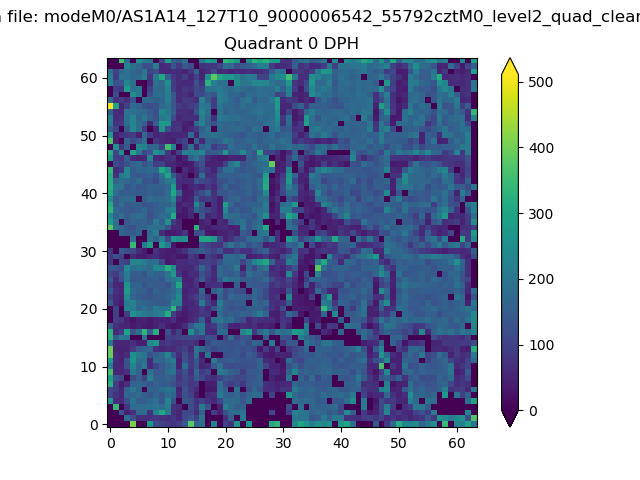 |
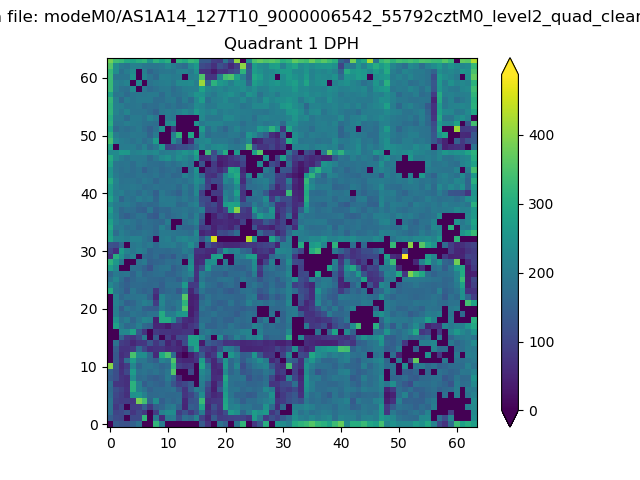 |
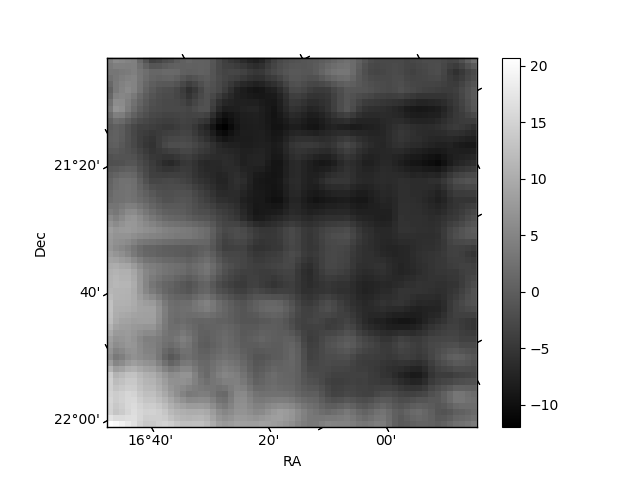
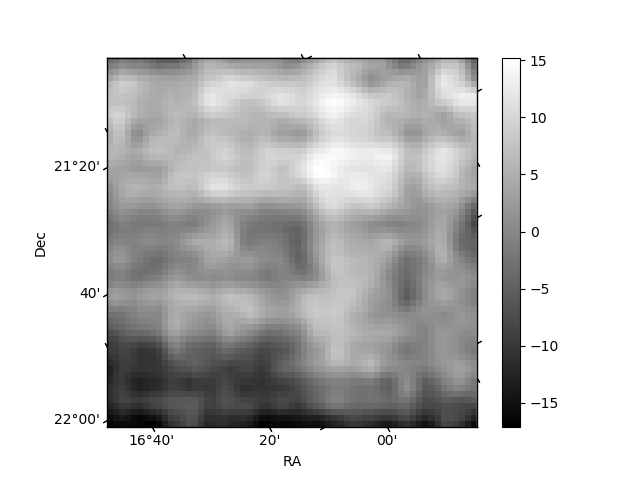
Quadrant B |
|---|---|---|---|
| Quadrant D | 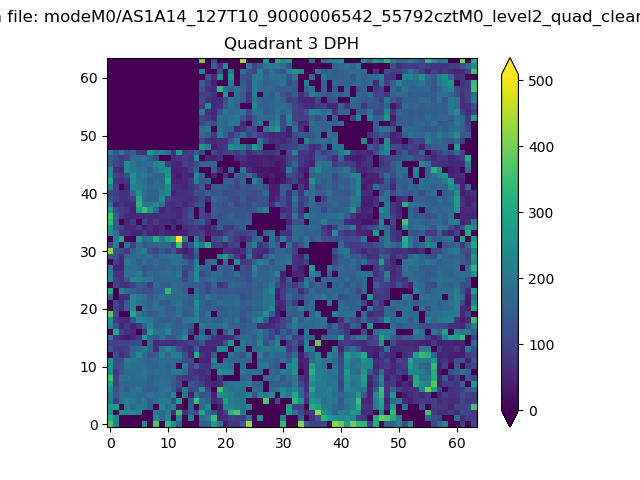 |
 |
Quadrant C |
| Plot type | Count rate plots | Images |
|---|---|---|
| Comparison with Poisson distribution Blue bars denote a histogram of data divided into 1 sec bins. Red curve is a Poisson curve with rate = median count rate of data. |
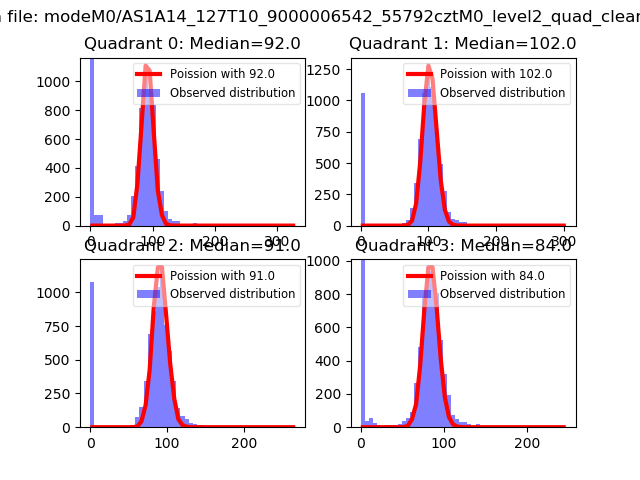 |
 |
| Quadrant-wise count rates Data is divided into 100 sec bins |
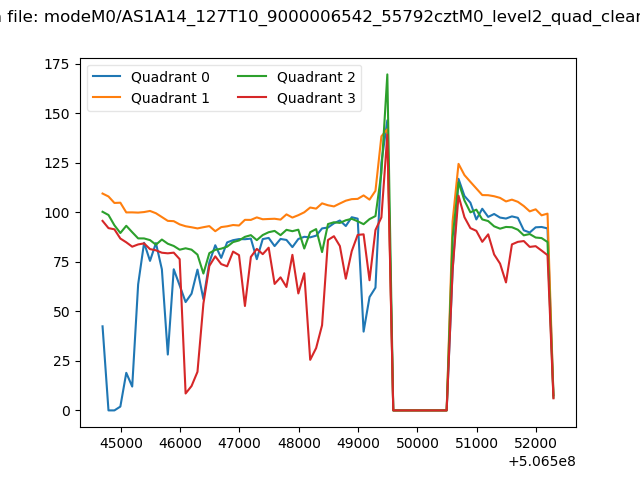 |
|
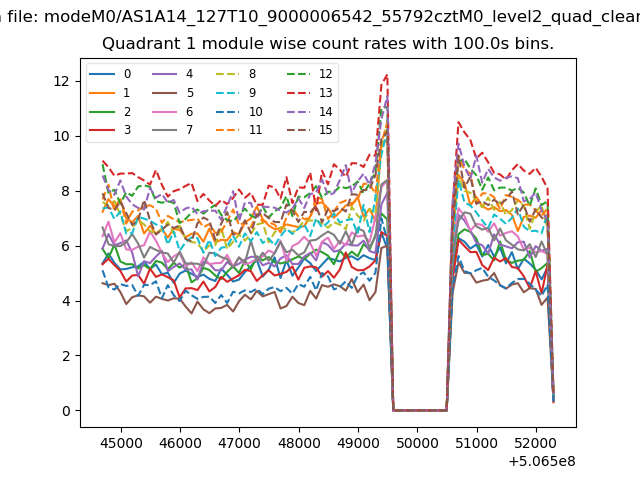
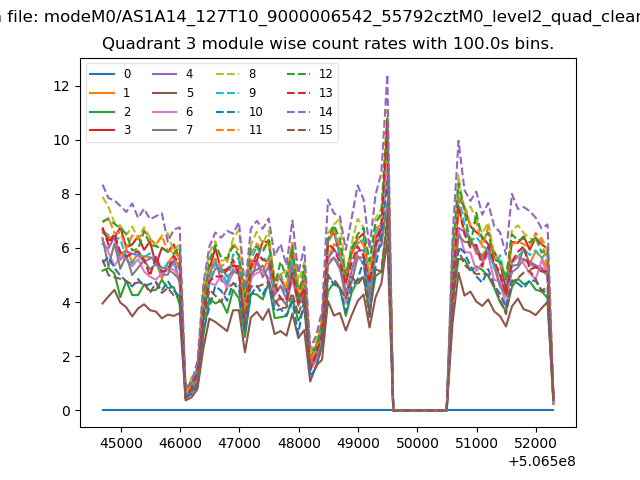
| Module-wise count rates for Quadrant A Data is divided into 100 sec bins |
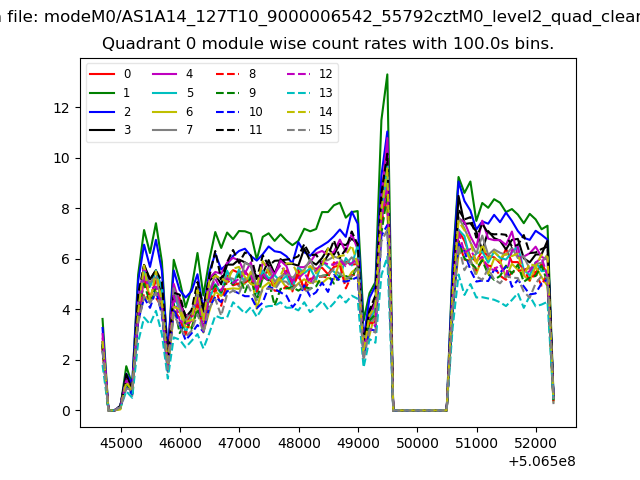 |
 |
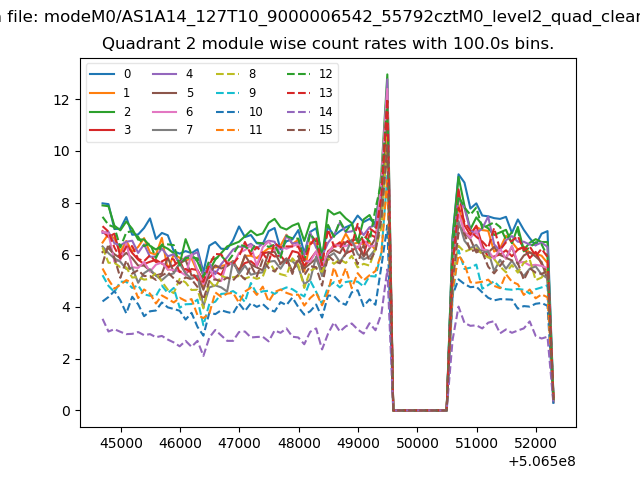
| Module-wise count rates for Quadrant B Data is divided into 100 sec bins |
 |
 |
| Module-wise count rates for Quadrant C Data is divided into 100 sec bins |
 |
 |
| Module-wise count rates for Quadrant D Data is divided into 100 sec bins |
 |
 |
| Parameter | Plot |
|---|---|
| CZT HV Monitor | 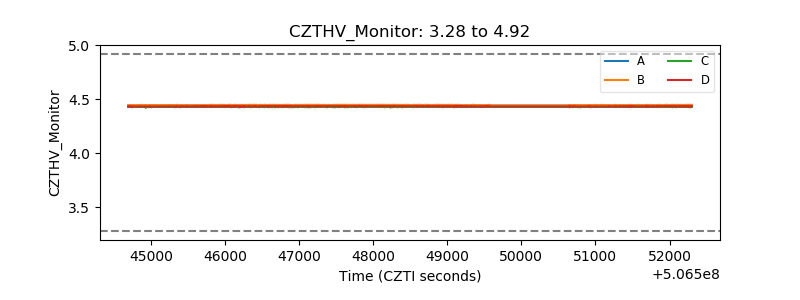 |
| D_VDD | 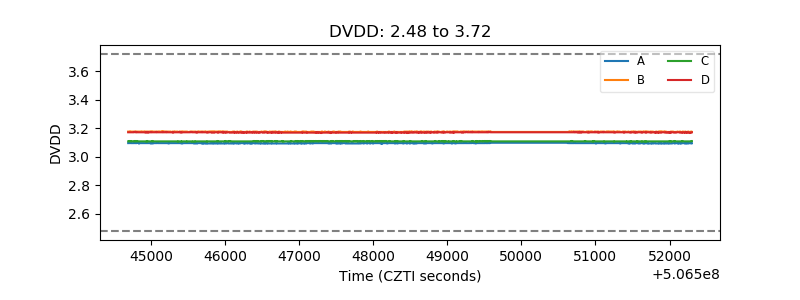 |
| Temperature 1 | 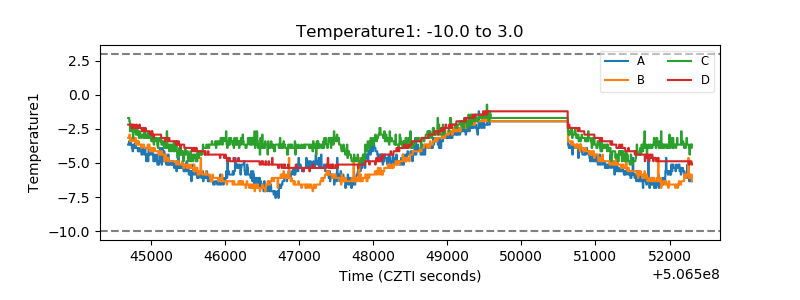 |
| Veto HV Monitor | 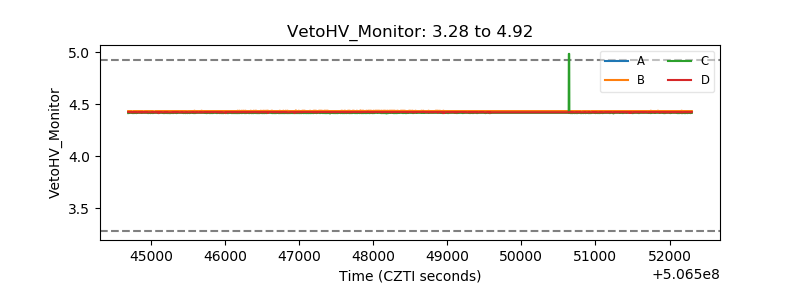 |
| Veto LLD | 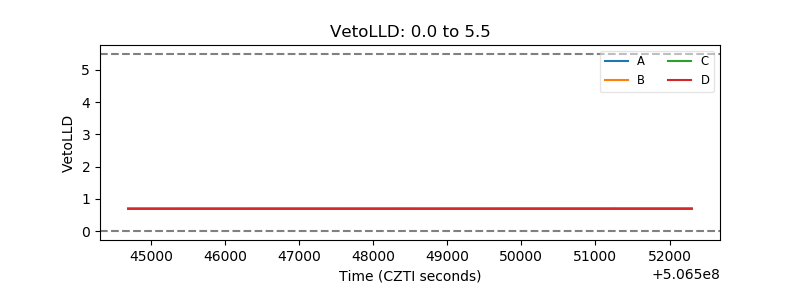 |
| Alpha Counter | 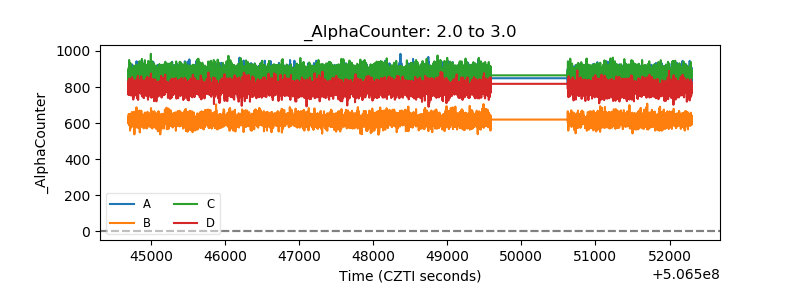 |
| _CPM_Rate | 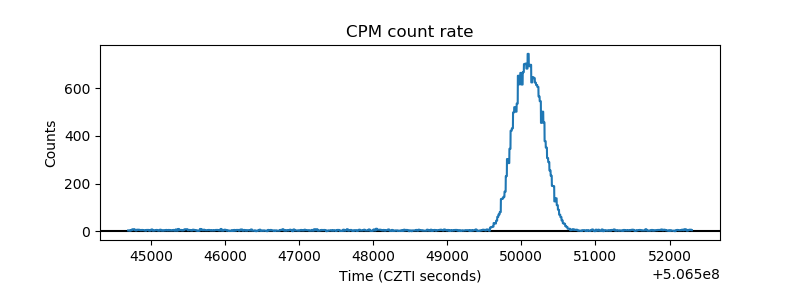 |
| CZT Counter | 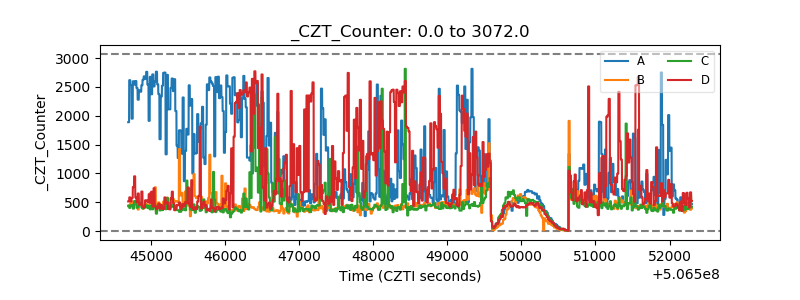 |
| +2.5 Volts monitor |  |
| +5 Volts monitor |  |
| _ROLL_ROT | 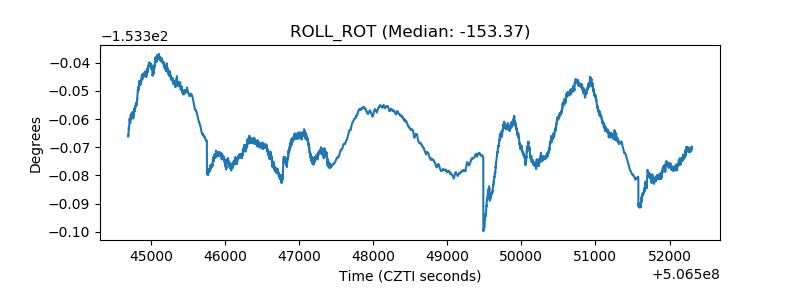 |
| _Roll_DEC | 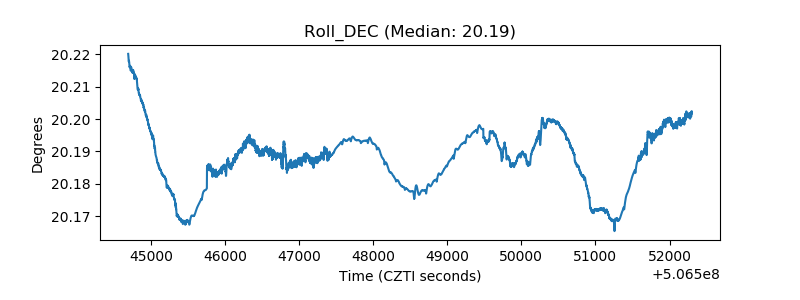 |
| _Roll_RA | 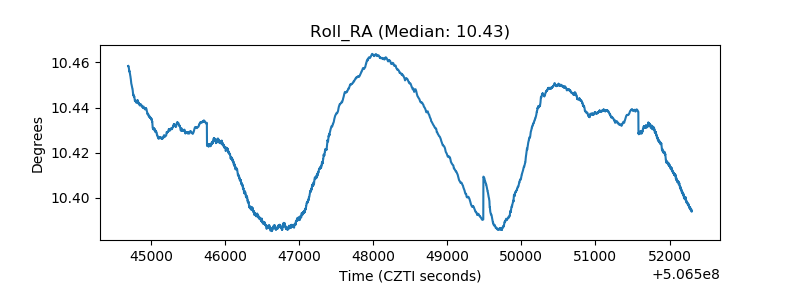 |
| Veto Counter | 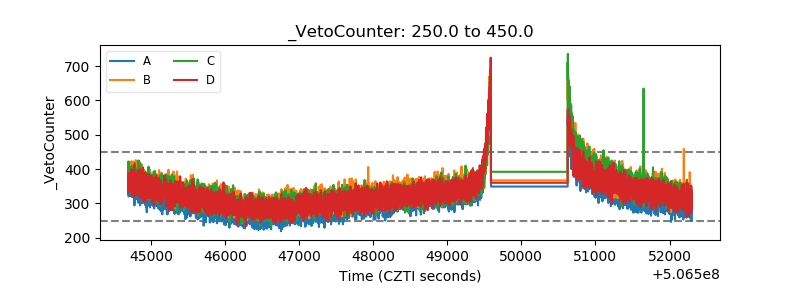 |