| Param | Original file | Final file |
|---|---|---|
| Filename | modeM0/AS1A14_127T10_9000006542_55793cztM0_level2.fits | modeM0/AS1A14_127T10_9000006542_55793cztM0_level2_quad_clean.evt |
| Size (bytes) | 537,226,560 | 100,045,440 |
| Size | 512.3 MB | 95.4 MB |
| Events in quadrant A | 7,270,054 | 571,747 |
| Events in quadrant B | 3,375,585 | 736,962 |
| Events in quadrant C | 3,331,171 | 662,365 |
| Events in quadrant D | 5,399,942 | 600,873 |
| Mode M0 | |||
|---|---|---|---|
| Quadrant | BADHDUFLAG | Total packets | Discarded packets |
| A | 0 | 26128 | 4 |
| B | 0 | 14909 | 2 |
| C | 0 | 15060 | 2 |
| D | 0 | 20654 | 2 |
| Mode M9 | |||
|---|---|---|---|
| Quadrant | BADHDUFLAG | Total packets | Discarded packets |
| A | 0 | 16 | 0 |
| B | 0 | 17 | 0 |
| C | 0 | 17 | 0 |
| D | 0 | 17 | 0 |
| Mode SS | |||
|---|---|---|---|
| Quadrant | BADHDUFLAG | Total packets | Discarded packets |
| A | 0 | 132 | 0 |
| B | 0 | 132 | 0 |
| C | 0 | 132 | 0 |
| D | 0 | 132 | 0 |
| Quadrant | Total seconds | Saturated seconds | Saturation percentage |
|---|---|---|---|
| A | 6565 | 1175 | 17.897944% |
| B | 6565 | 208 | 3.168317% |
| C | 6565 | 200 | 3.046458% |
| D | 6565 | 497 | 7.570449% |
Noise dominated data is calculated using 1-second bins in cleaned event files. If a bin has >2000 counts, and if more than 50% of those come from <1% of pixels, then it is considered to be noise-dominated and hence unusable.
| Quadrant | # 1 sec bins | Bins with >0 counts | Bins with >2000 counts | High rate bins dominated by noise | Noise dominated (total time) | Noise dominated (detector-on time) | Marked lightcurve |
|---|---|---|---|---|---|---|---|
| A | 7725 | 6565 | 1004 | 1004 | 13.00% | 15.29% | 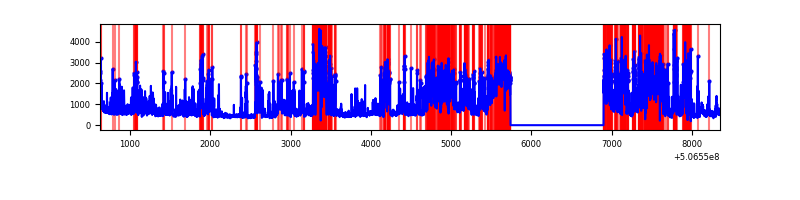 |
| B | 7725 | 6565 | 186 | 186 | 2.41% | 2.83% | 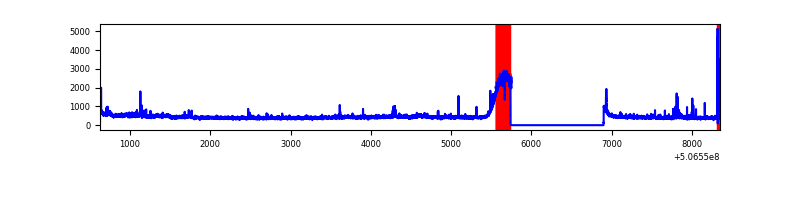 |
| C | 7725 | 6565 | 199 | 199 | 2.58% | 3.03% | 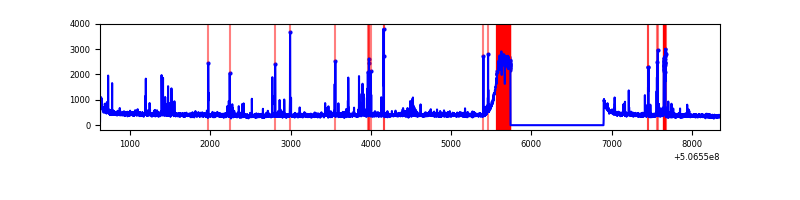 |
| D | 7725 | 6565 | 511 | 511 | 6.61% | 7.78% | 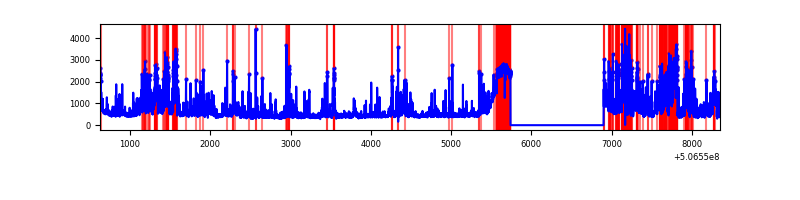 |
Top three noisy pixels from each quadrant. If the there are fewer than three noisy pixels in the level2.evt file, extra rows are filled as -1
| Pixel properties | Quadrant properties | ||||||
|---|---|---|---|---|---|---|---|
| Quadrant | DetID | PixID | Counts | Sigma | Mean | Median | Sigma |
| A | 15 | 32 | 3768796 | 19271.26 | 725 | 709 | 195.5 |
| A | 8 | 192 | 296013 | 1510.28 | 725 | 709 | 195.5 |
| A | 12 | 115 | 266488 | 1359.28 | 725 | 709 | 195.5 |
| B | 7 | 0 | 94315 | 530.94 | 795 | 776 | 176.2 |
| B | 10 | 247 | 85162 | 478.99 | 795 | 776 | 176.2 |
| B | 0 | 199 | 35639 | 197.89 | 795 | 776 | 176.2 |
| C | 13 | 3 | 125066 | 539.5 | 781 | 775 | 230.4 |
| C | 15 | 200 | 89119 | 383.47 | 781 | 775 | 230.4 |
| C | 6 | 223 | 45019 | 192.05 | 781 | 775 | 230.4 |
| D | 11 | 129 | 1793563 | 7841.34 | 769 | 734 | 228.6 |
| D | 15 | 125 | 187541 | 817.04 | 769 | 734 | 228.6 |
| D | 3 | 12 | 143562 | 624.69 | 769 | 734 | 228.6 |
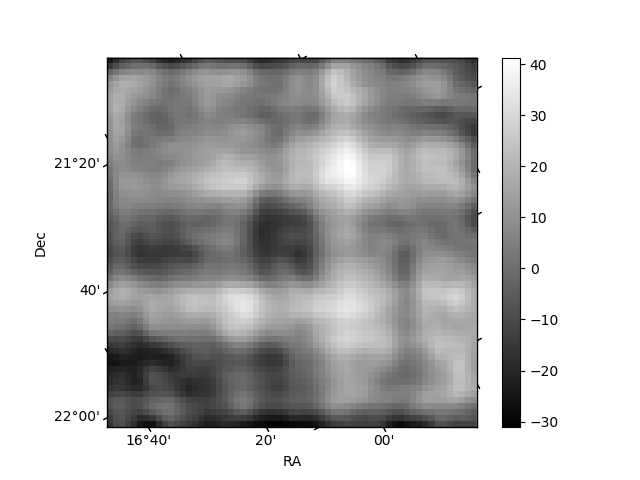
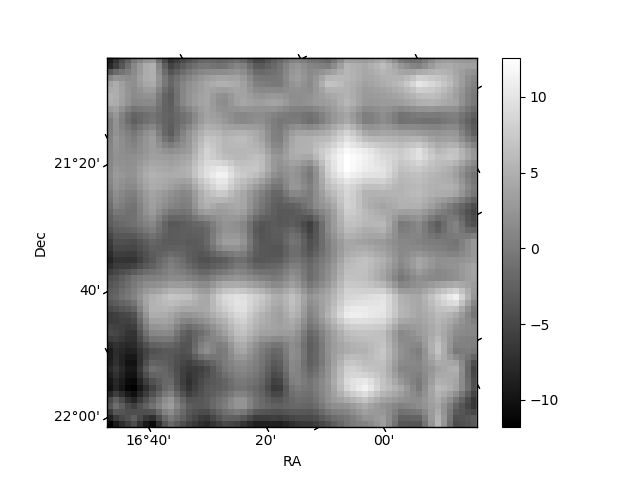
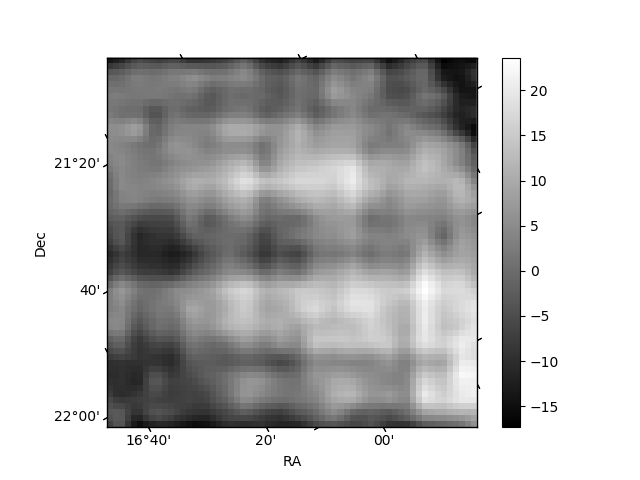
Histogram calculated using DETX and DETY for each event in the final _common_clean file
| Quadrant A | 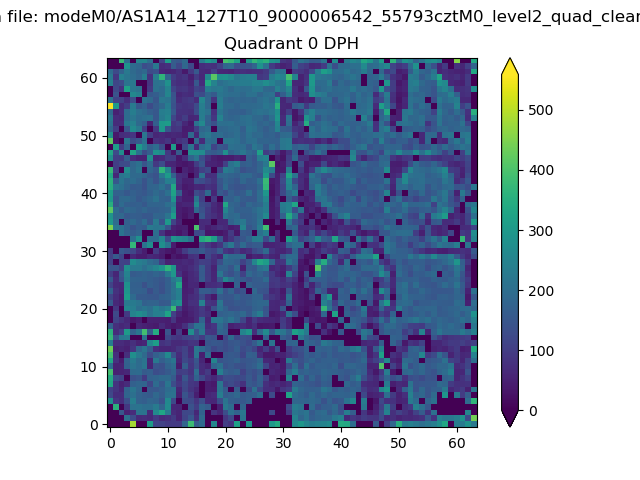 |
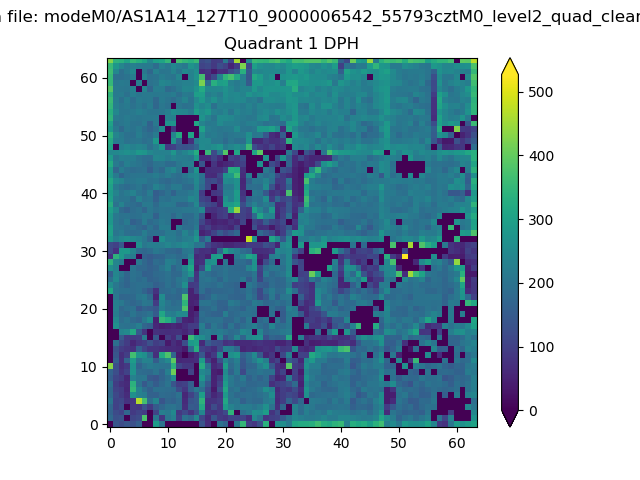 |
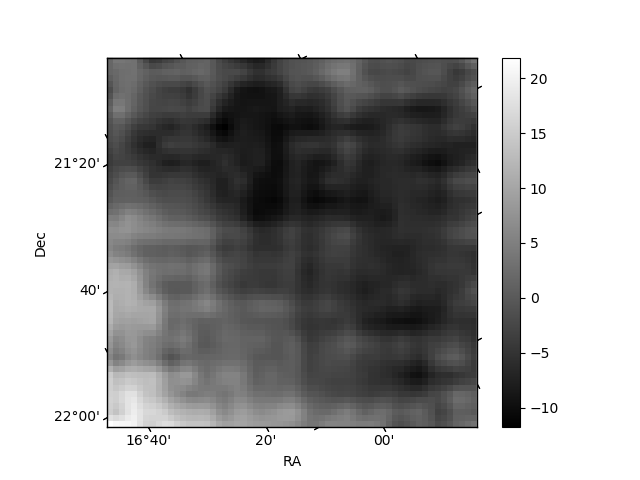
Quadrant B |
|---|---|---|---|
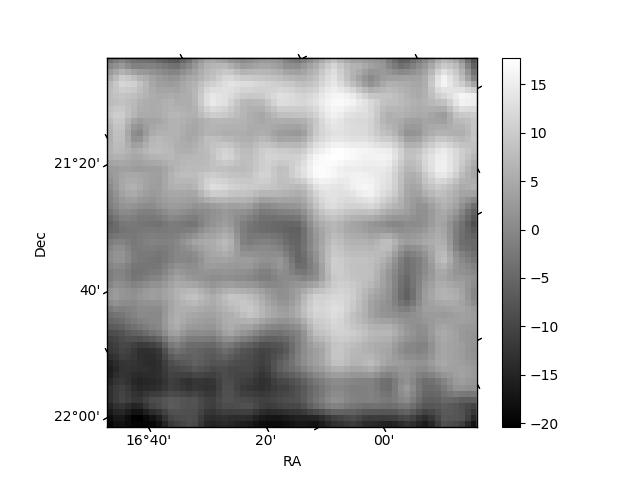
| Quadrant D | 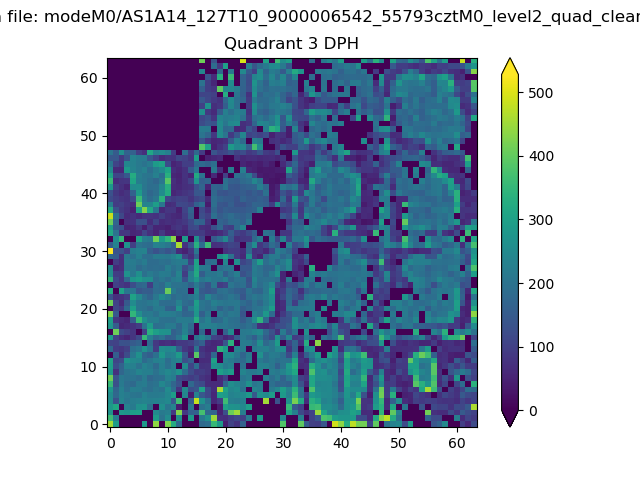 |
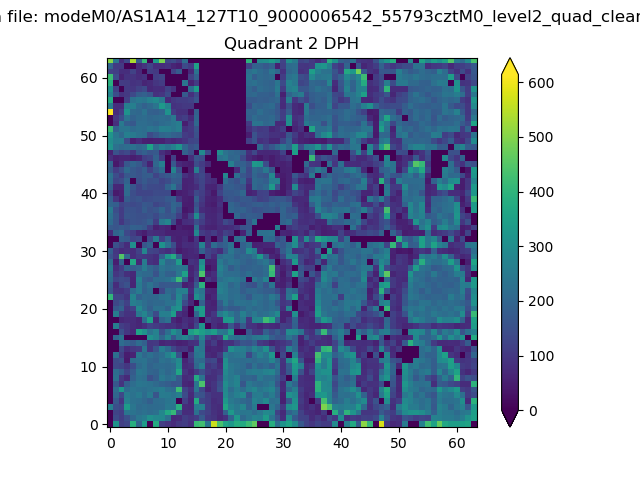 |
Quadrant C |
| Plot type | Count rate plots | Images |
|---|---|---|
| Comparison with Poisson distribution Blue bars denote a histogram of data divided into 1 sec bins. Red curve is a Poisson curve with rate = median count rate of data. |
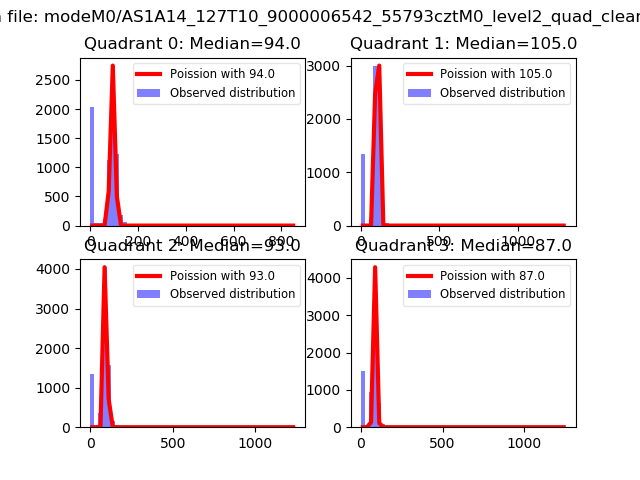 |
 |
| Quadrant-wise count rates Data is divided into 100 sec bins |
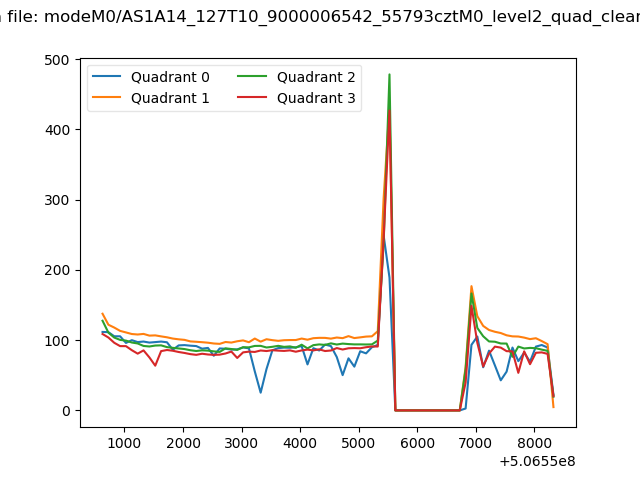 |
|
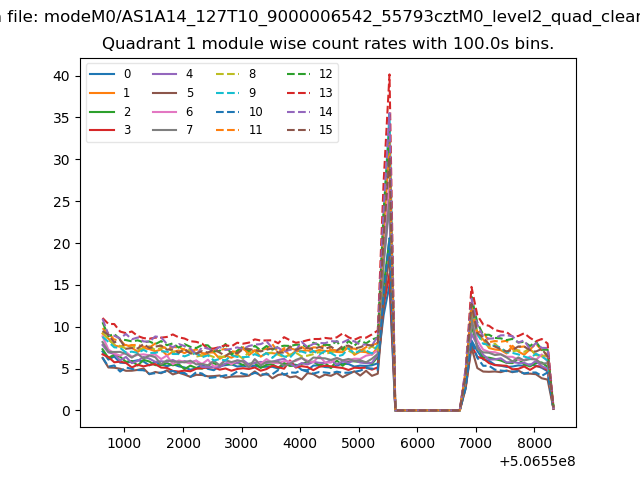
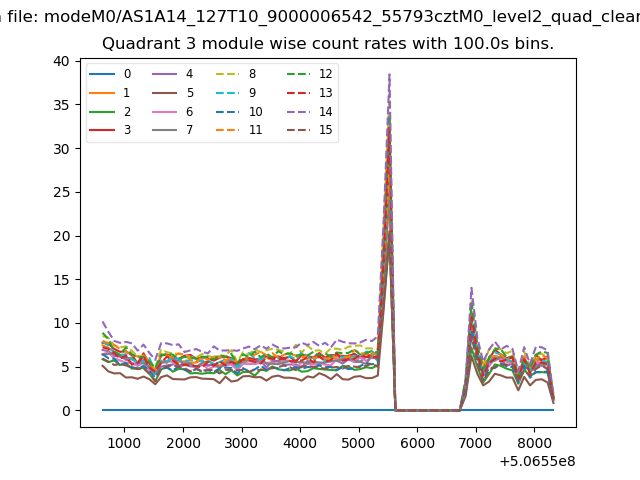
| Module-wise count rates for Quadrant A Data is divided into 100 sec bins |
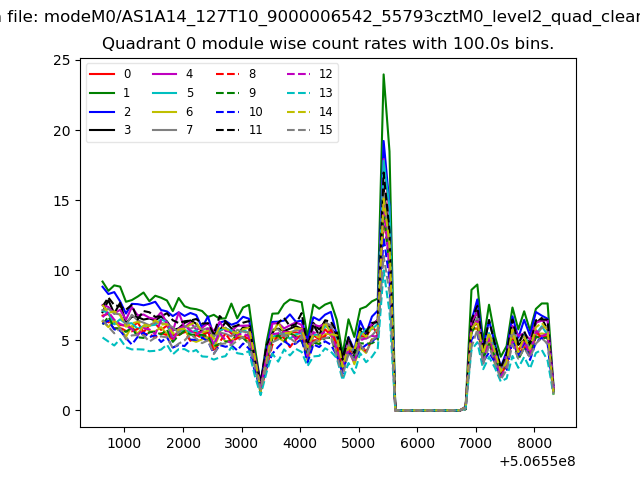 |
 |
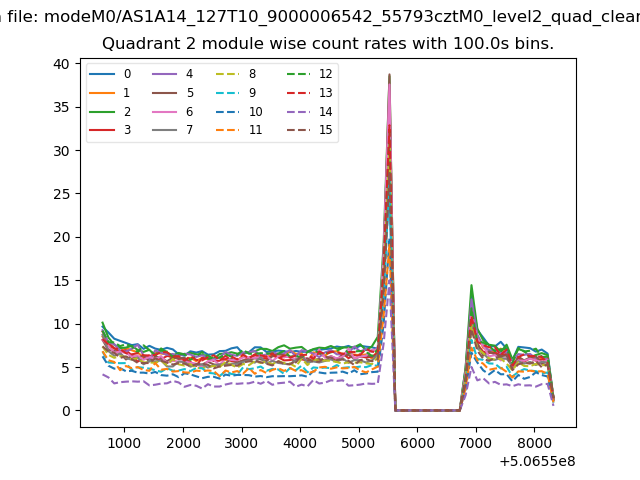
| Module-wise count rates for Quadrant B Data is divided into 100 sec bins |
 |
 |
| Module-wise count rates for Quadrant C Data is divided into 100 sec bins |
 |
 |
| Module-wise count rates for Quadrant D Data is divided into 100 sec bins |
 |
 |
| Parameter | Plot |
|---|---|
| CZT HV Monitor | 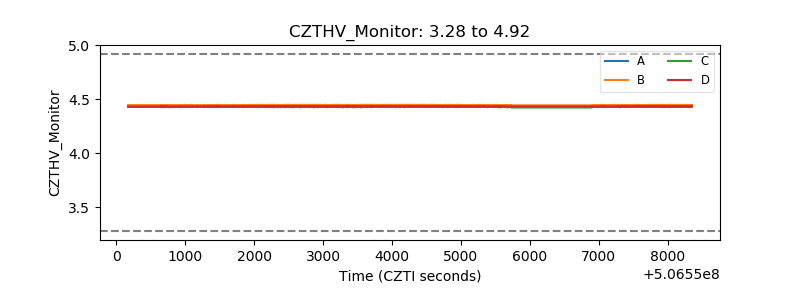 |
| D_VDD | 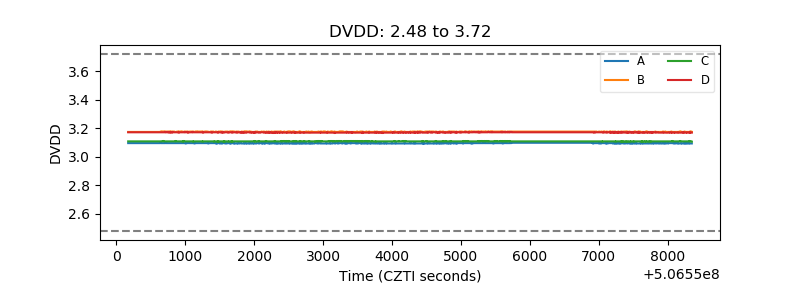 |
| Temperature 1 | 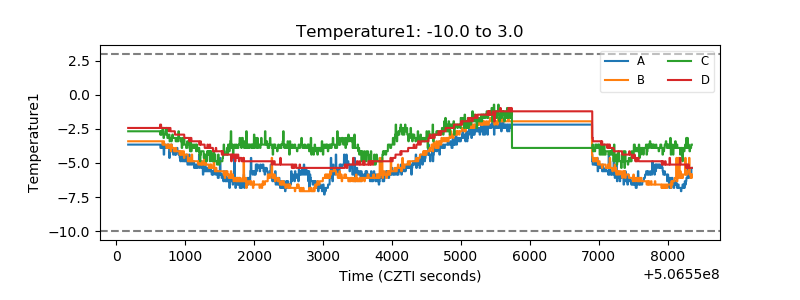 |
| Veto HV Monitor | 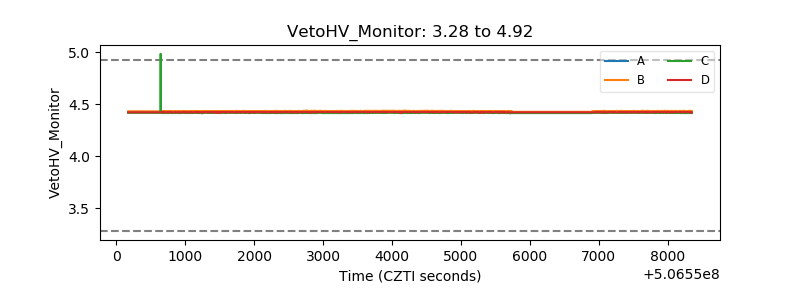 |
| Veto LLD | 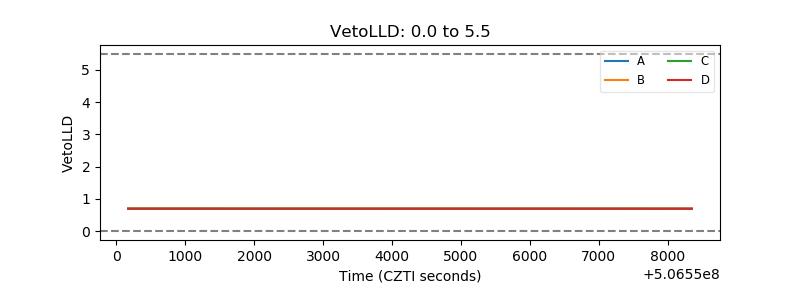 |
| Alpha Counter | 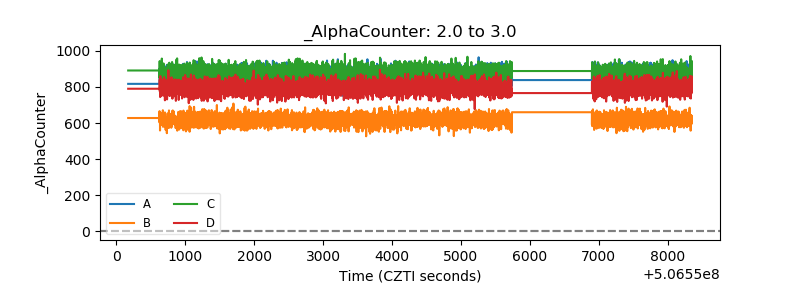 |
| _CPM_Rate | 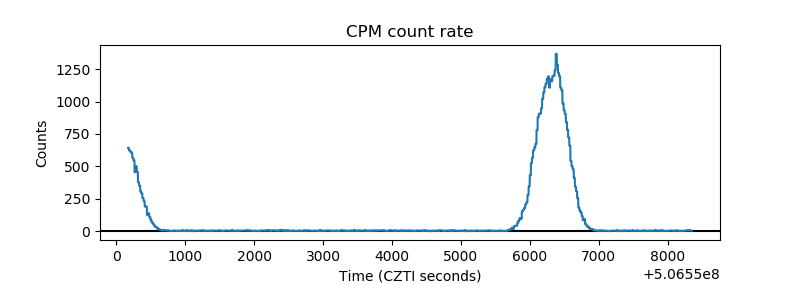 |
| CZT Counter | 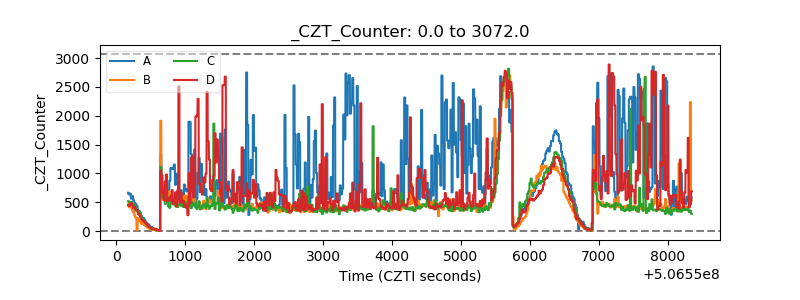 |
| +2.5 Volts monitor |  |
| +5 Volts monitor |  |
| _ROLL_ROT | 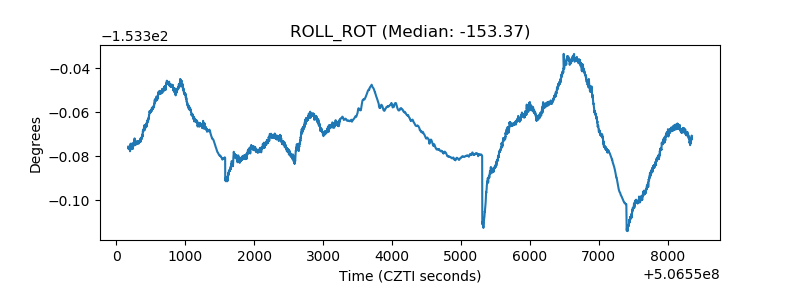 |
| _Roll_DEC | 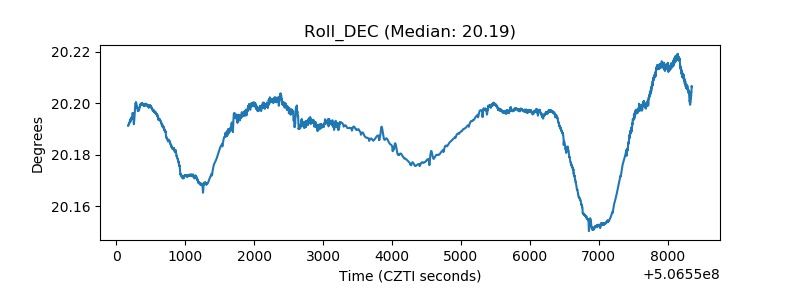 |
| _Roll_RA | 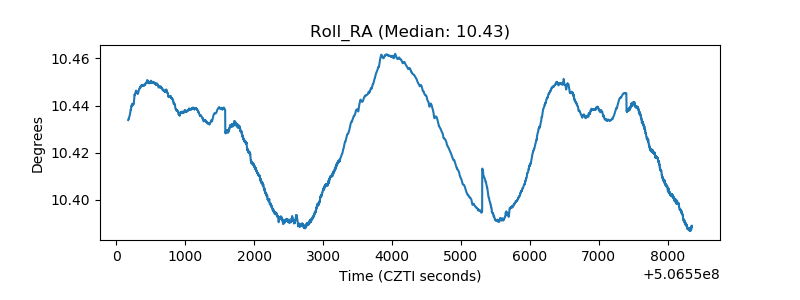 |
| Veto Counter | 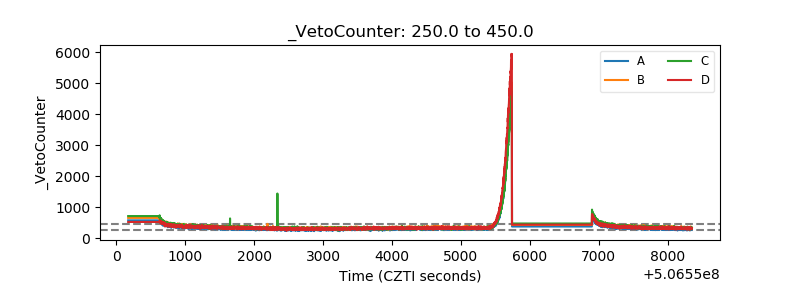 |