| Param | Original file | Final file |
|---|---|---|
| Filename | modeM0/AS1A14_127T10_9000006542_55794cztM0_level2.fits | modeM0/AS1A14_127T10_9000006542_55794cztM0_level2_quad_clean.evt |
| Size (bytes) | 614,370,240 | 116,856,000 |
| Size | 585.9 MB | 111.4 MB |
| Events in quadrant A | 8,752,428 | 605,513 |
| Events in quadrant B | 3,942,829 | 886,571 |
| Events in quadrant C | 3,604,724 | 836,386 |
| Events in quadrant D | 5,934,468 | 754,138 |
| Mode M0 | |||
|---|---|---|---|
| Quadrant | BADHDUFLAG | Total packets | Discarded packets |
| A | 0 | 30487 | 2 |
| B | 0 | 17137 | 2 |
| C | 0 | 16328 | 2 |
| D | 0 | 22396 | 2 |
| Mode M9 | |||
|---|---|---|---|
| Quadrant | BADHDUFLAG | Total packets | Discarded packets |
| A | 0 | 12 | 0 |
| B | 0 | 12 | 0 |
| C | 0 | 12 | 0 |
| D | 0 | 12 | 0 |
| Mode SS | |||
|---|---|---|---|
| Quadrant | BADHDUFLAG | Total packets | Discarded packets |
| A | 0 | 134 | 0 |
| B | 0 | 134 | 0 |
| C | 0 | 134 | 0 |
| D | 0 | 134 | 0 |
| Quadrant | Total seconds | Saturated seconds | Saturation percentage |
|---|---|---|---|
| A | 6542 | 1917 | 29.302965% |
| B | 6542 | 482 | 7.367777% |
| C | 6543 | 334 | 5.104692% |
| D | 6543 | 633 | 9.674461% |
Noise dominated data is calculated using 1-second bins in cleaned event files. If a bin has >2000 counts, and if more than 50% of those come from <1% of pixels, then it is considered to be noise-dominated and hence unusable.
| Quadrant | # 1 sec bins | Bins with >0 counts | Bins with >2000 counts | High rate bins dominated by noise | Noise dominated (total time) | Noise dominated (detector-on time) | Marked lightcurve |
|---|---|---|---|---|---|---|---|
| A | 7712 | 6541 | 1623 | 1623 | 21.05% | 24.81% | 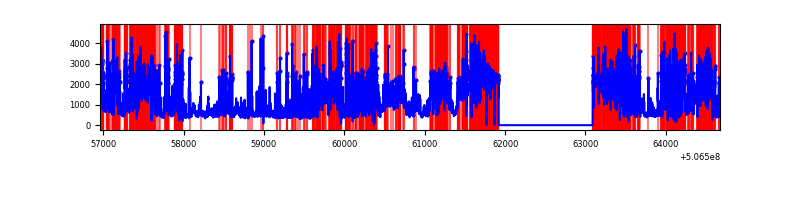 |
| B | 7712 | 6542 | 400 | 400 | 5.19% | 6.11% | 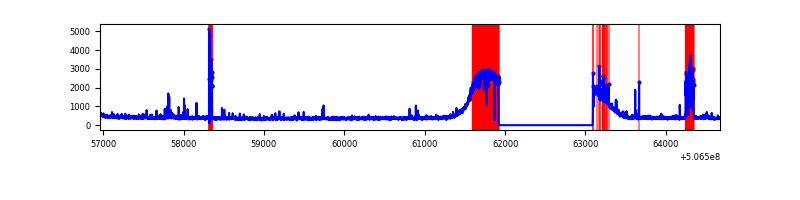 |
| C | 7713 | 6544 | 331 | 331 | 4.29% | 5.06% | 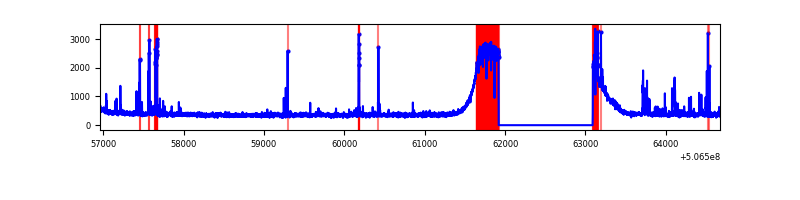 |
| D | 7713 | 6543 | 712 | 712 | 9.23% | 10.88% | 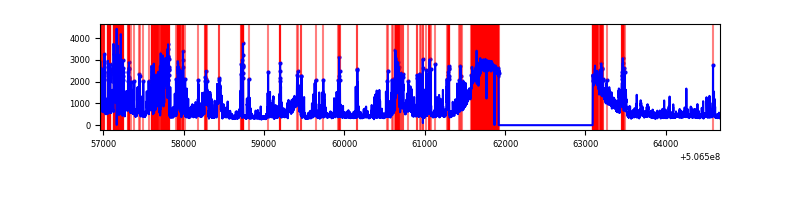 |
Top three noisy pixels from each quadrant. If the there are fewer than three noisy pixels in the level2.evt file, extra rows are filled as -1
| Pixel properties | Quadrant properties | ||||||
|---|---|---|---|---|---|---|---|
| Quadrant | DetID | PixID | Counts | Sigma | Mean | Median | Sigma |
| A | 15 | 32 | 4898040 | 16842.04 | 789 | 762 | 290.8 |
| A | 8 | 192 | 267264 | 916.52 | 789 | 762 | 290.8 |
| A | 12 | 115 | 263899 | 904.94 | 789 | 762 | 290.8 |
| B | 5 | 172 | 191927 | 725.78 | 891 | 878 | 263.2 |
| B | 10 | 247 | 95207 | 358.35 | 891 | 878 | 263.2 |
| B | 7 | 252 | 76954 | 289.01 | 891 | 878 | 263.2 |
| C | 13 | 3 | 96373 | 291.37 | 856 | 833 | 327.9 |
| C | 15 | 200 | 92408 | 279.28 | 856 | 833 | 327.9 |
| C | 6 | 223 | 36085 | 107.51 | 856 | 833 | 327.9 |
| D | 11 | 129 | 1821872 | 5289.14 | 872 | 811 | 344.3 |
| D | 3 | 12 | 260695 | 754.81 | 872 | 811 | 344.3 |
| D | 8 | 245 | 173108 | 500.42 | 872 | 811 | 344.3 |
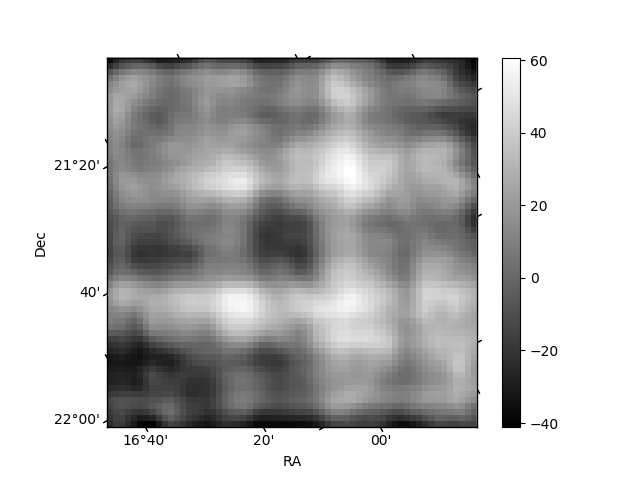
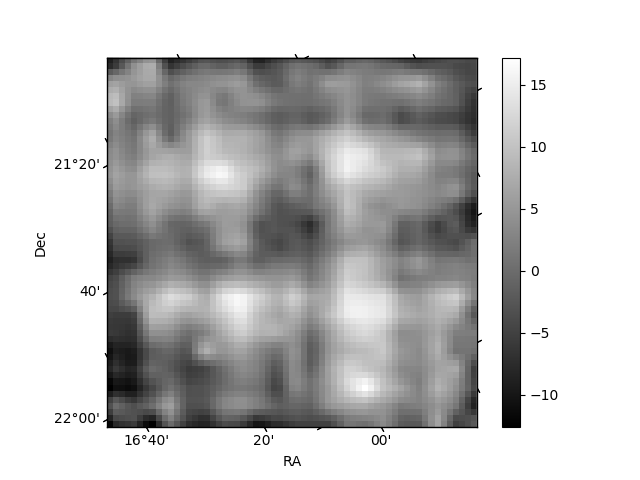
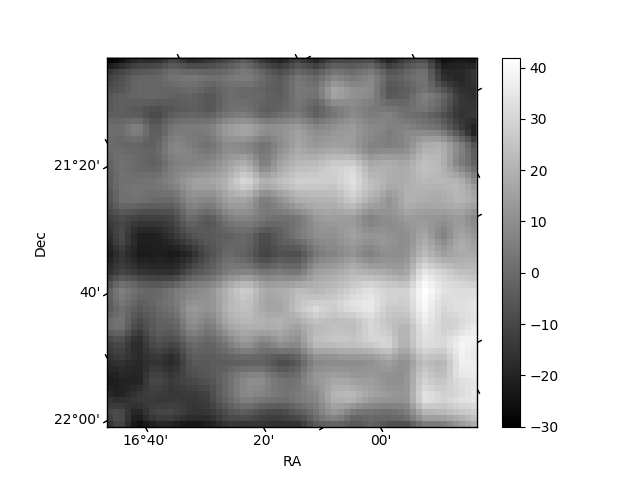
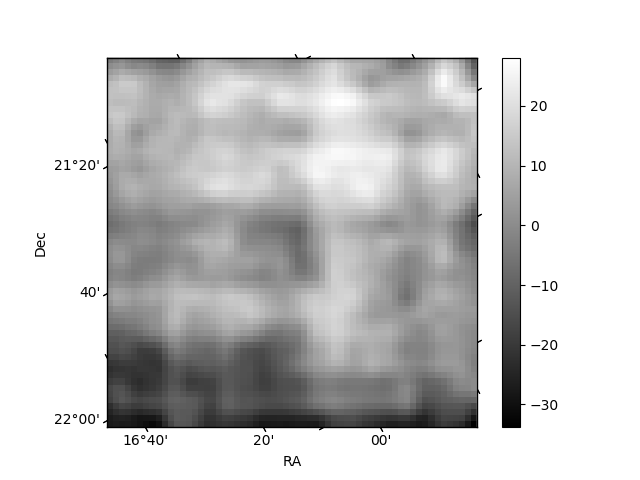
Histogram calculated using DETX and DETY for each event in the final _common_clean file
| Quadrant A | 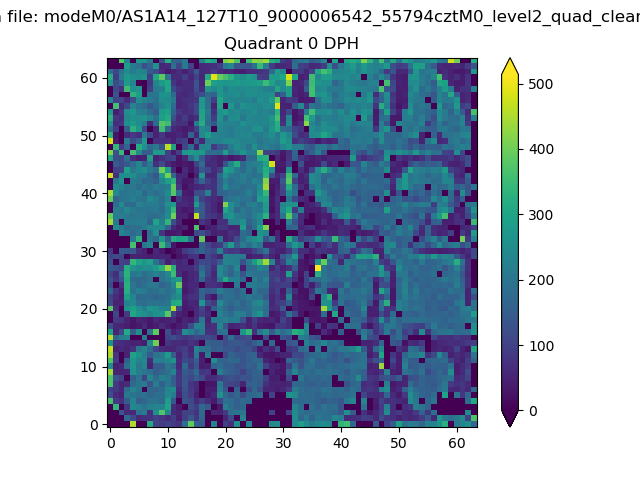 |
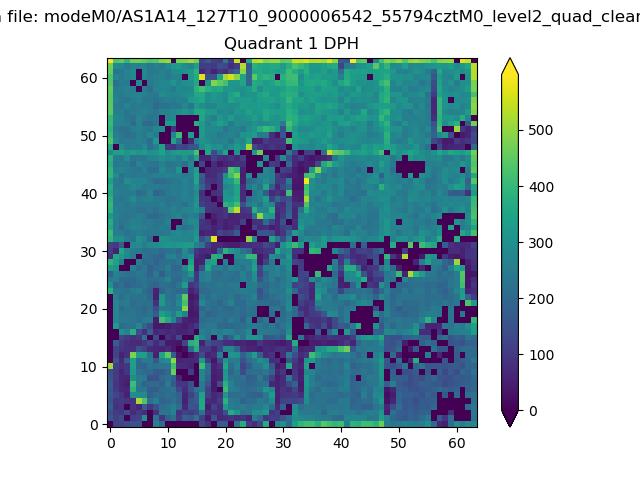 |
Quadrant B |
|---|---|---|---|
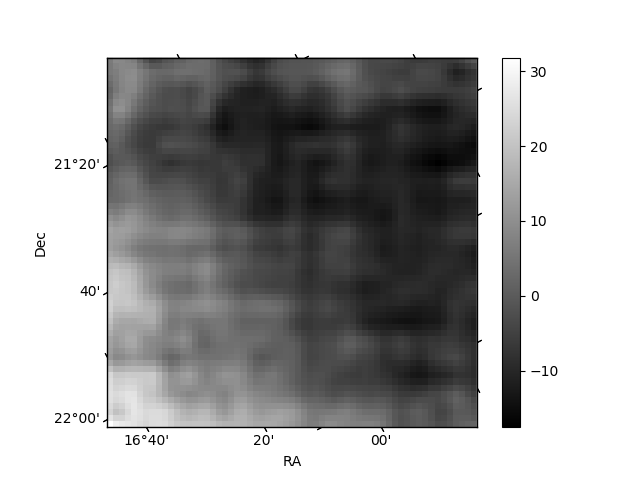
| Quadrant D | 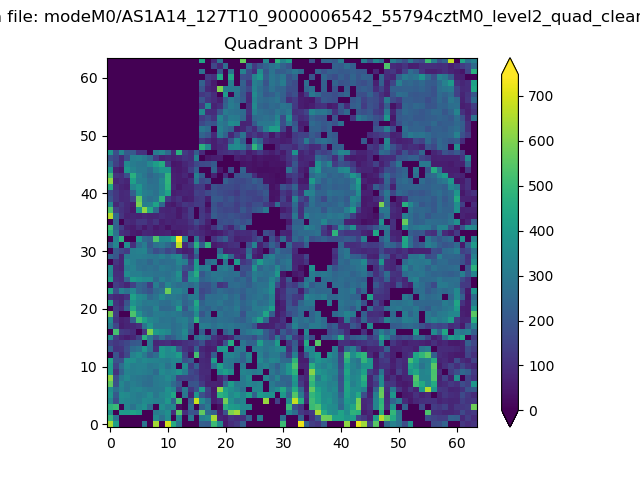 |
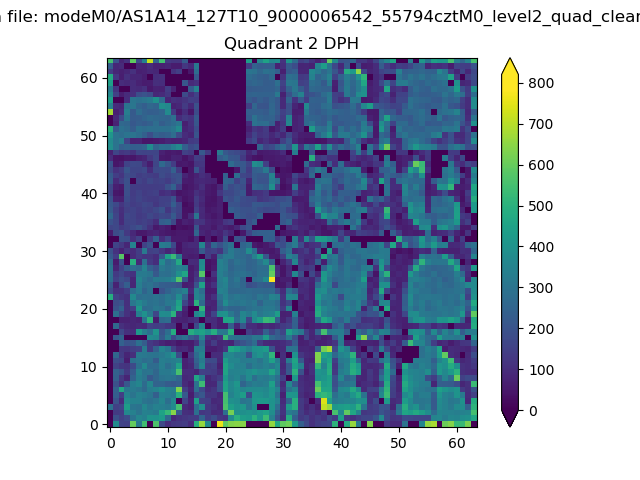 |
Quadrant C |
| Plot type | Count rate plots | Images |
|---|---|---|
| Comparison with Poisson distribution Blue bars denote a histogram of data divided into 1 sec bins. Red curve is a Poisson curve with rate = median count rate of data. |
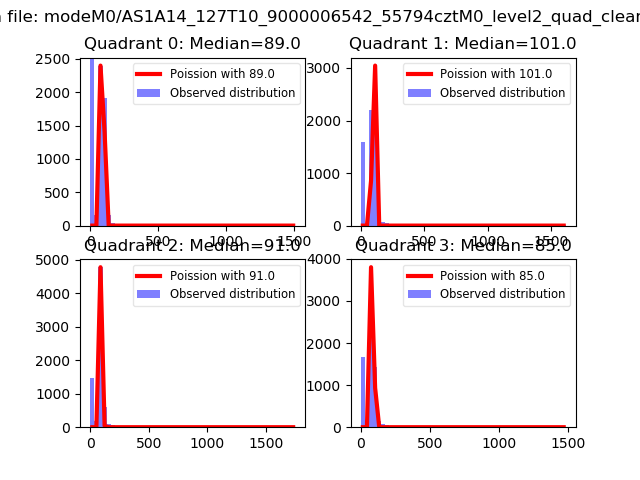 |
 |
| Quadrant-wise count rates Data is divided into 100 sec bins |
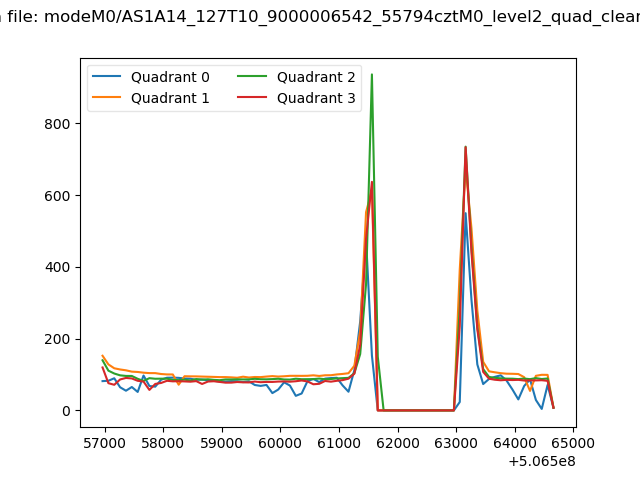 |
|
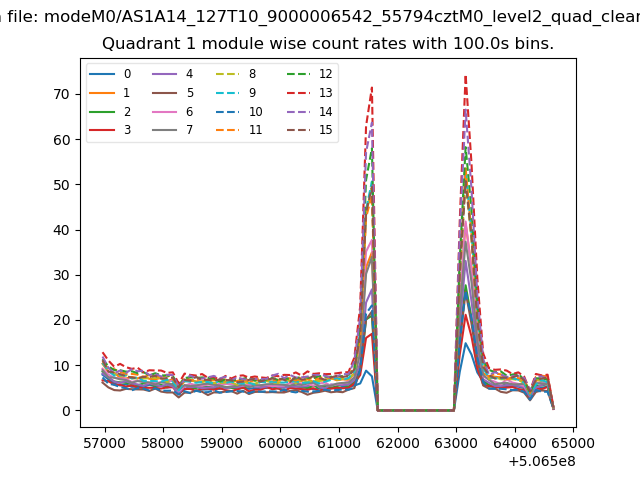
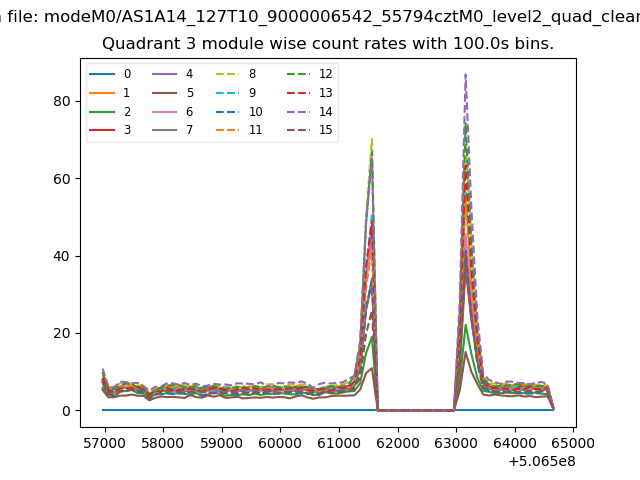
| Module-wise count rates for Quadrant A Data is divided into 100 sec bins |
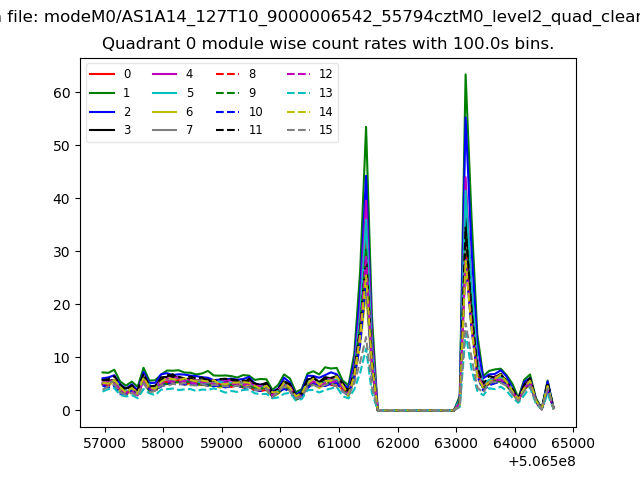 |
 |
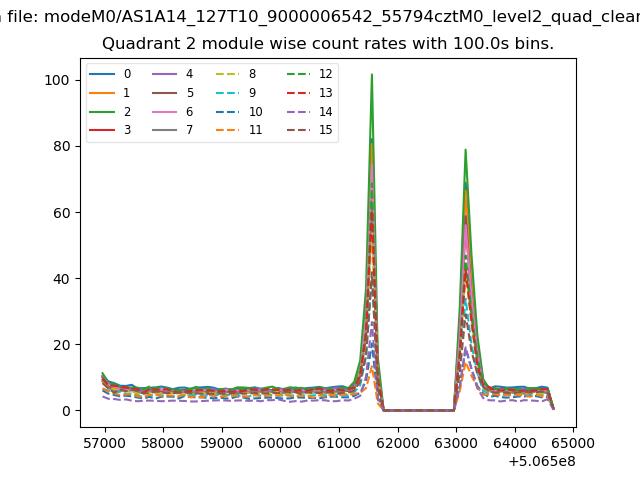
| Module-wise count rates for Quadrant B Data is divided into 100 sec bins |
 |
 |
| Module-wise count rates for Quadrant C Data is divided into 100 sec bins |
 |
 |
| Module-wise count rates for Quadrant D Data is divided into 100 sec bins |
 |
 |
| Parameter | Plot |
|---|---|
| CZT HV Monitor | 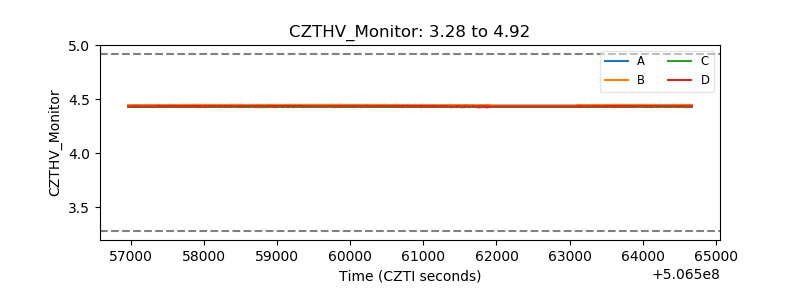 |
| D_VDD | 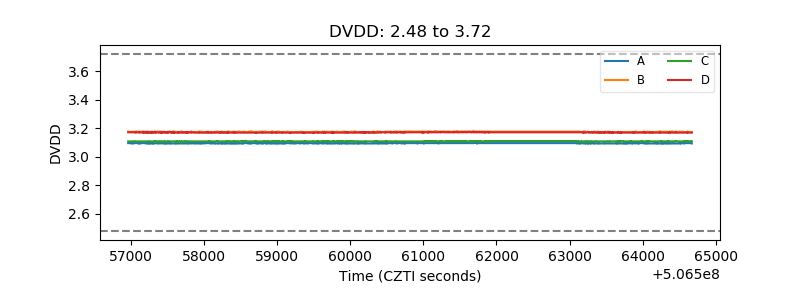 |
| Temperature 1 | 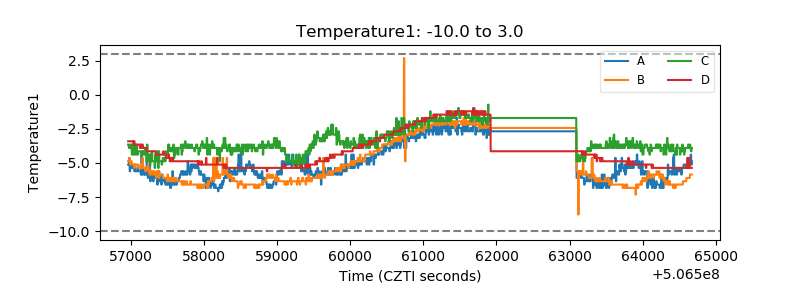 |
| Veto HV Monitor | 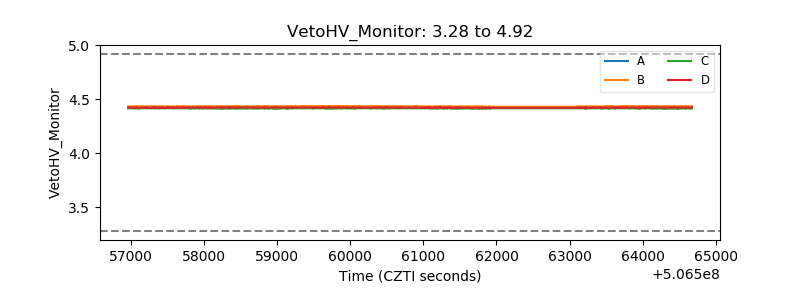 |
| Veto LLD | 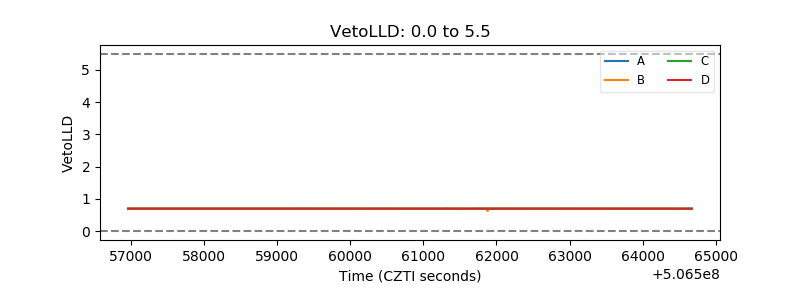 |
| Alpha Counter | 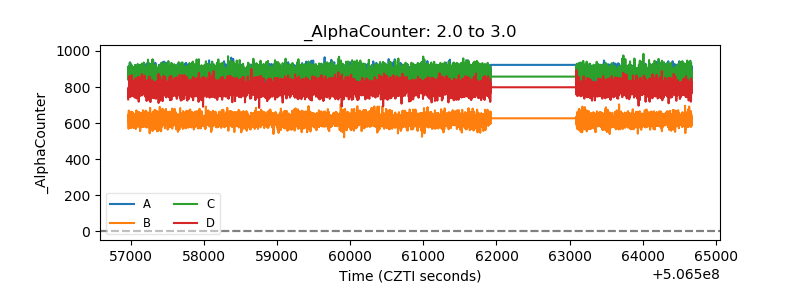 |
| _CPM_Rate | 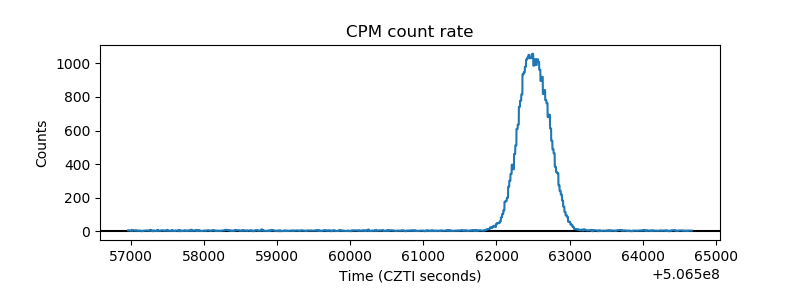 |
| CZT Counter | 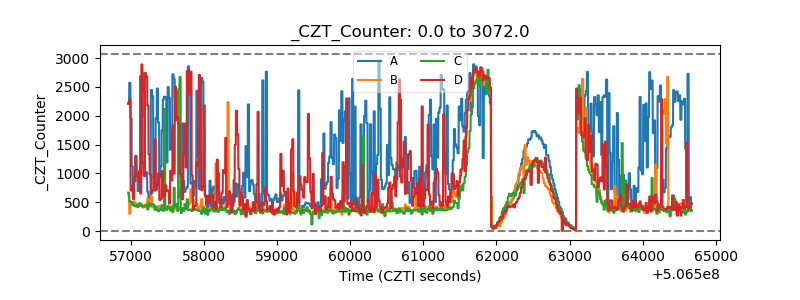 |
| +2.5 Volts monitor |  |
| +5 Volts monitor | 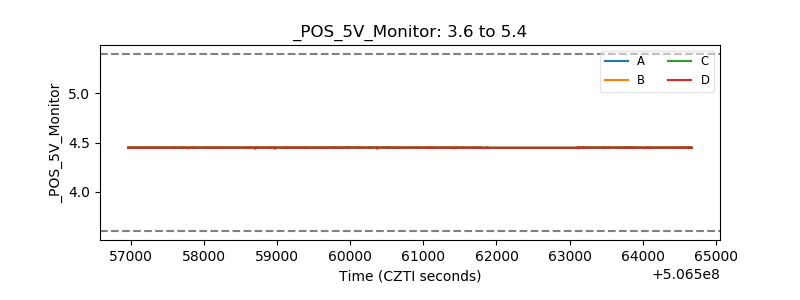 |
| _ROLL_ROT | 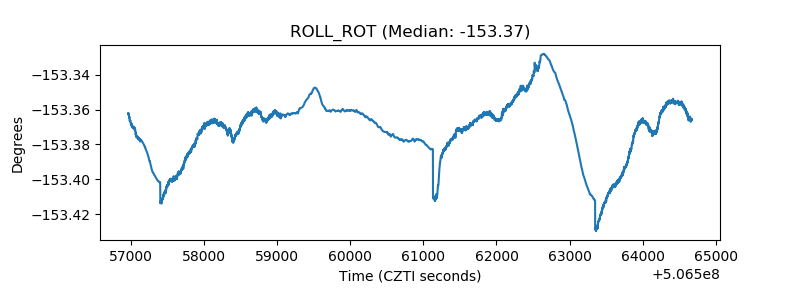 |
| _Roll_DEC | 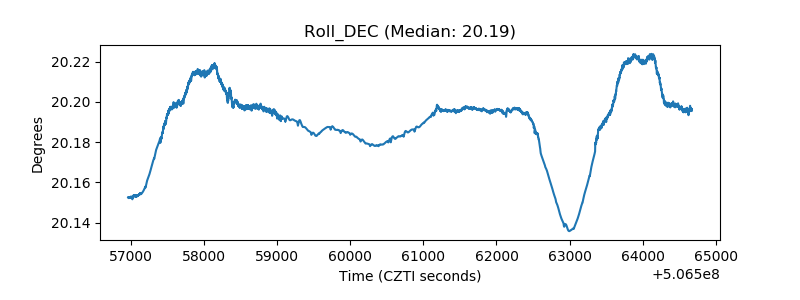 |
| _Roll_RA | 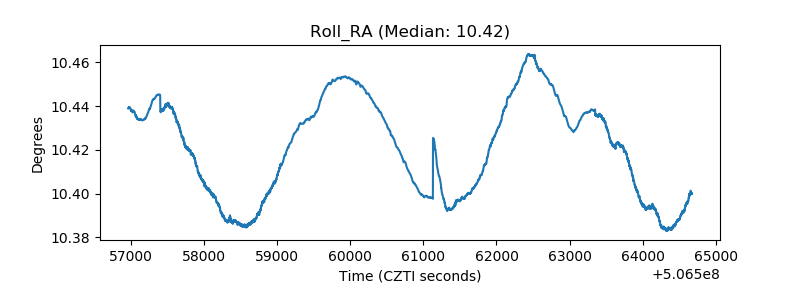 |
| Veto Counter | 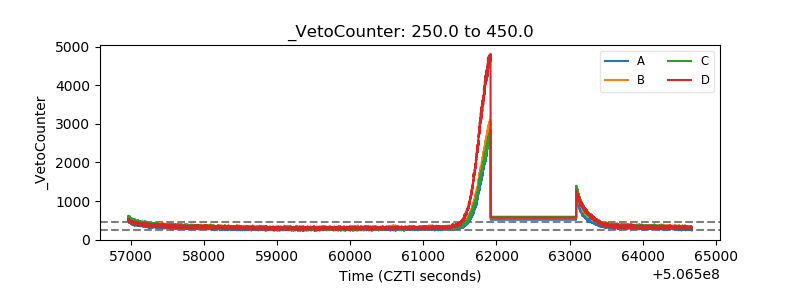 |