| Param | Original file | Final file |
|---|---|---|
| Filename | modeM0/AS1A14_127T10_9000006542_55795cztM0_level2.fits | modeM0/AS1A14_127T10_9000006542_55795cztM0_level2_quad_clean.evt |
| Size (bytes) | 629,380,800 | 102,242,880 |
| Size | 600.2 MB | 97.5 MB |
| Events in quadrant A | 9,627,017 | 479,574 |
| Events in quadrant B | 5,610,898 | 756,085 |
| Events in quadrant C | 2,992,456 | 729,939 |
| Events in quadrant D | 4,554,623 | 670,594 |
| Mode M0 | |||
|---|---|---|---|
| Quadrant | BADHDUFLAG | Total packets | Discarded packets |
| A | 0 | 33185 | 1 |
| B | 0 | 21500 | 1 |
| C | 0 | 14656 | 1 |
| D | 0 | 18538 | 1 |
| Mode M9 | |||
|---|---|---|---|
| Quadrant | BADHDUFLAG | Total packets | Discarded packets |
| A | 0 | 15 | 0 |
| B | 0 | 16 | 0 |
| C | 0 | 16 | 0 |
| D | 0 | 16 | 0 |
| Mode SS | |||
|---|---|---|---|
| Quadrant | BADHDUFLAG | Total packets | Discarded packets |
| A | 0 | 132 | 0 |
| B | 0 | 132 | 0 |
| C | 0 | 132 | 0 |
| D | 0 | 132 | 0 |
| Quadrant | Total seconds | Saturated seconds | Saturation percentage |
|---|---|---|---|
| A | 6603 | 2565 | 38.845979% |
| B | 6603 | 684 | 10.358928% |
| C | 6602 | 95 | 1.438958% |
| D | 6602 | 334 | 5.059073% |
Noise dominated data is calculated using 1-second bins in cleaned event files. If a bin has >2000 counts, and if more than 50% of those come from <1% of pixels, then it is considered to be noise-dominated and hence unusable.
| Quadrant | # 1 sec bins | Bins with >0 counts | Bins with >2000 counts | High rate bins dominated by noise | Noise dominated (total time) | Noise dominated (detector-on time) | Marked lightcurve |
|---|---|---|---|---|---|---|---|
| A | 7743 | 6601 | 1905 | 1905 | 24.60% | 28.86% | 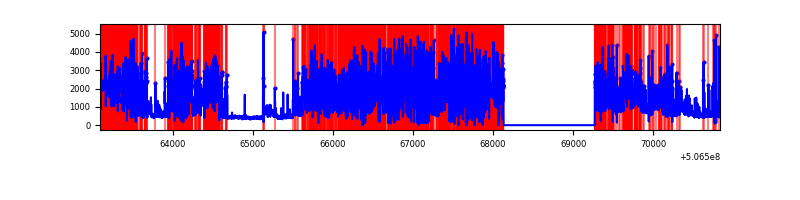 |
| B | 7743 | 6604 | 550 | 550 | 7.10% | 8.33% | 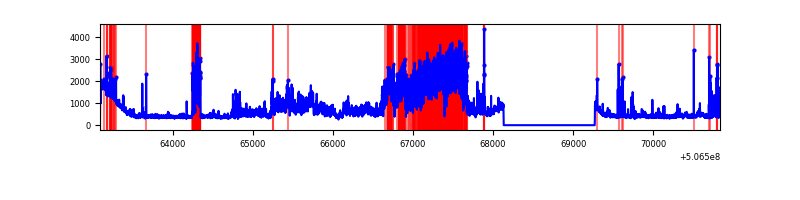 |
| C | 7742 | 6603 | 54 | 54 | 0.70% | 0.82% | 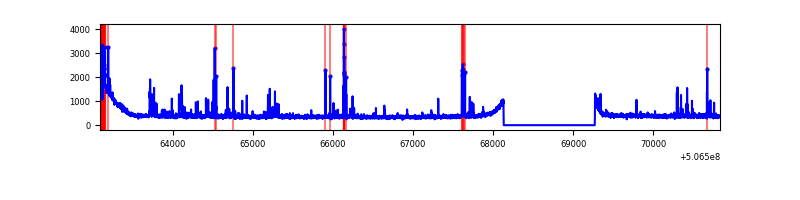 |
| D | 7742 | 6603 | 325 | 325 | 4.20% | 4.92% | 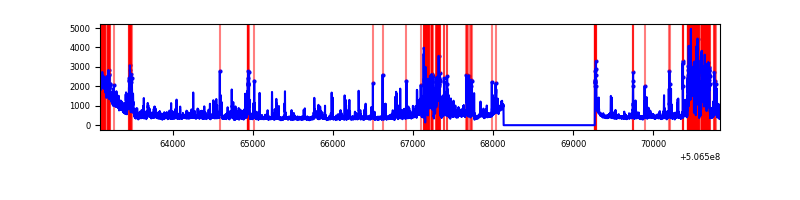 |
Top three noisy pixels from each quadrant. If the there are fewer than three noisy pixels in the level2.evt file, extra rows are filled as -1
| Pixel properties | Quadrant properties | ||||||
|---|---|---|---|---|---|---|---|
| Quadrant | DetID | PixID | Counts | Sigma | Mean | Median | Sigma |
| A | 15 | 32 | 6374243 | 41774.42 | 557 | 546 | 152.6 |
| A | 7 | 64 | 482333 | 3157.72 | 557 | 546 | 152.6 |
| A | 4 | 249 | 283400 | 1853.88 | 557 | 546 | 152.6 |
| B | 5 | 172 | 2641730 | 17089.75 | 686 | 668 | 154.5 |
| B | 7 | 252 | 84146 | 540.17 | 686 | 668 | 154.5 |
| B | 7 | 0 | 67316 | 431.27 | 686 | 668 | 154.5 |
| C | 13 | 3 | 199728 | 968.64 | 692 | 685 | 205.5 |
| C | 15 | 147 | 40199 | 192.29 | 692 | 685 | 205.5 |
| C | 15 | 200 | 33772 | 161.02 | 692 | 685 | 205.5 |
| D | 11 | 129 | 926696 | 4452.92 | 681 | 651 | 208.0 |
| D | 3 | 12 | 541887 | 2602.55 | 681 | 651 | 208.0 |
| D | 5 | 222 | 111719 | 534.07 | 681 | 651 | 208.0 |
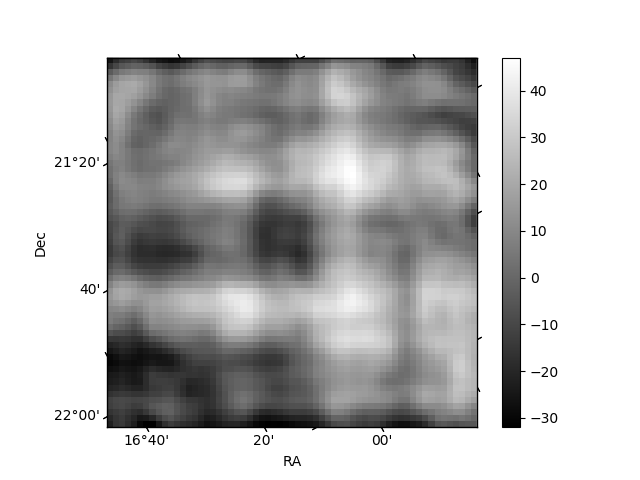
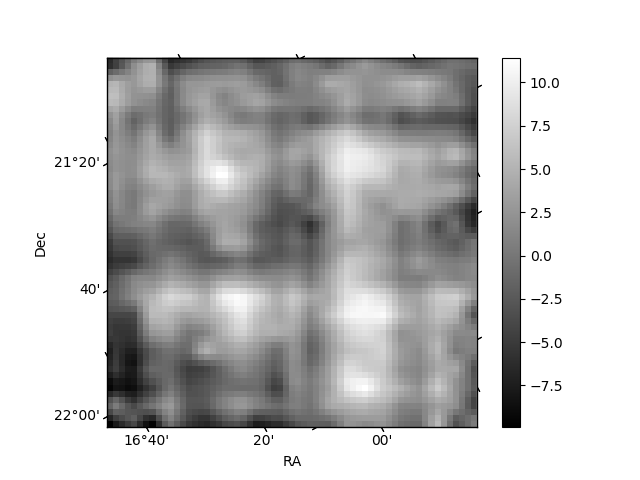
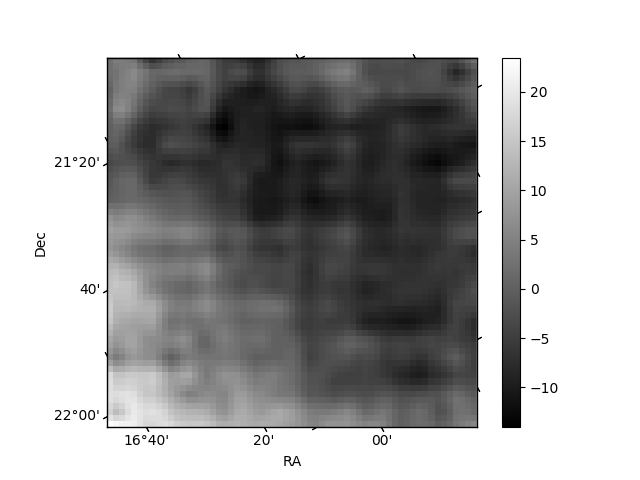
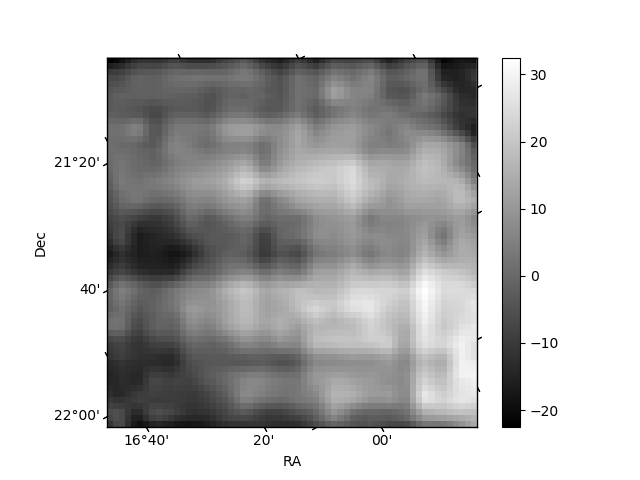
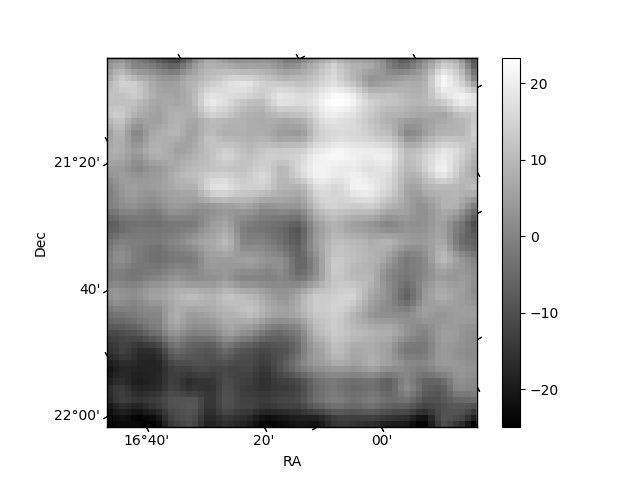
Histogram calculated using DETX and DETY for each event in the final _common_clean file
| Quadrant A | 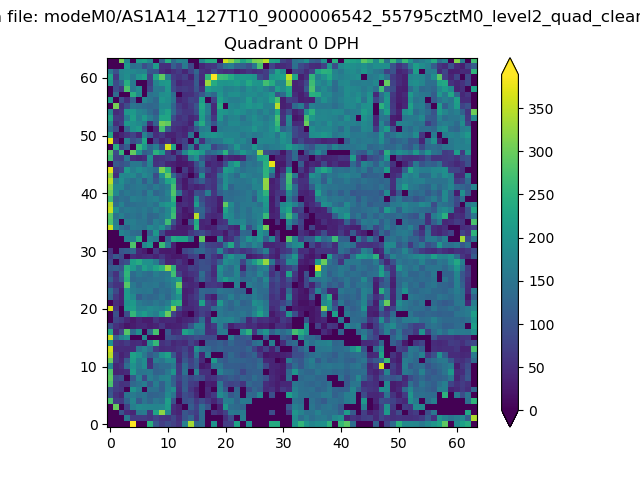 |
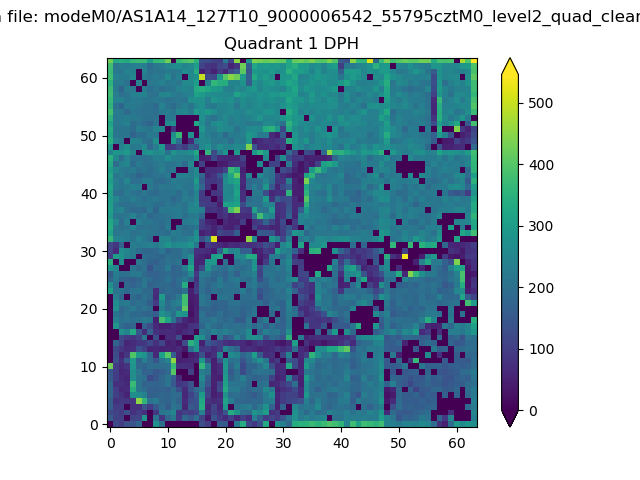 |
Quadrant B |
|---|---|---|---|
| Quadrant D | 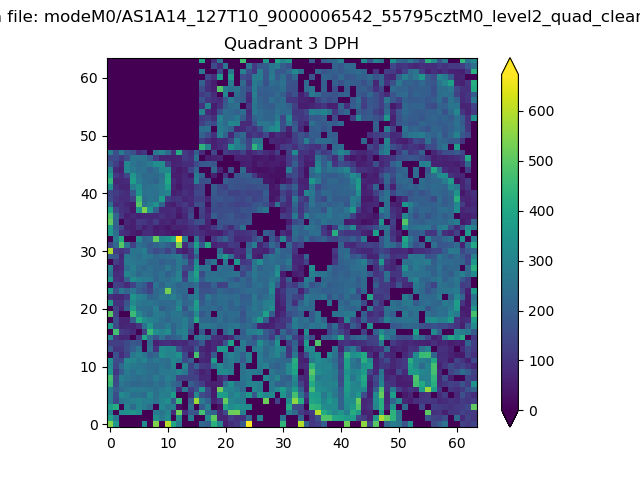 |
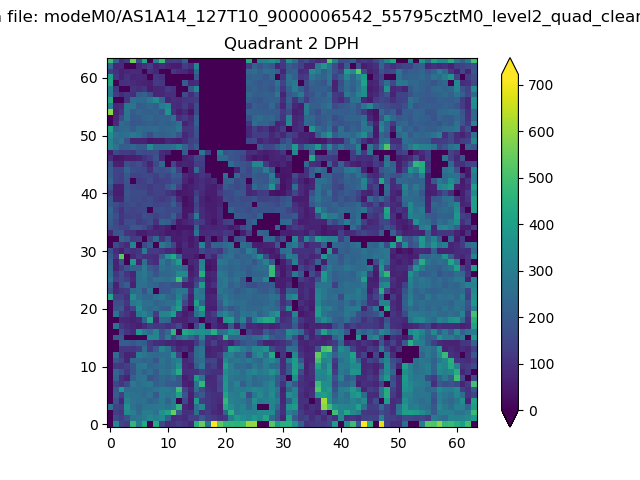 |
Quadrant C |
| Plot type | Count rate plots | Images |
|---|---|---|
| Comparison with Poisson distribution Blue bars denote a histogram of data divided into 1 sec bins. Red curve is a Poisson curve with rate = median count rate of data. |
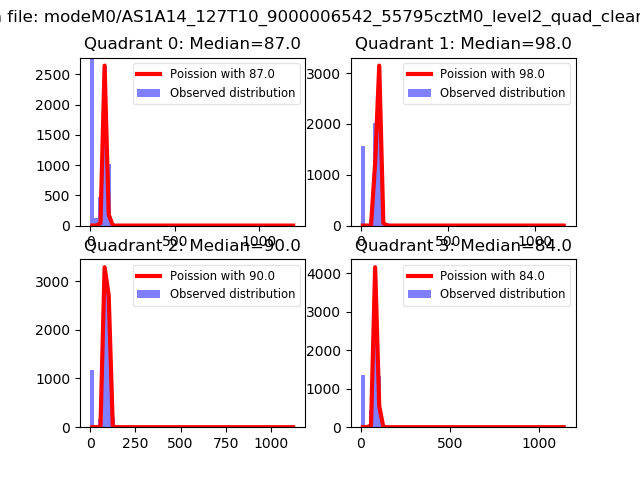 |
 |
| Quadrant-wise count rates Data is divided into 100 sec bins |
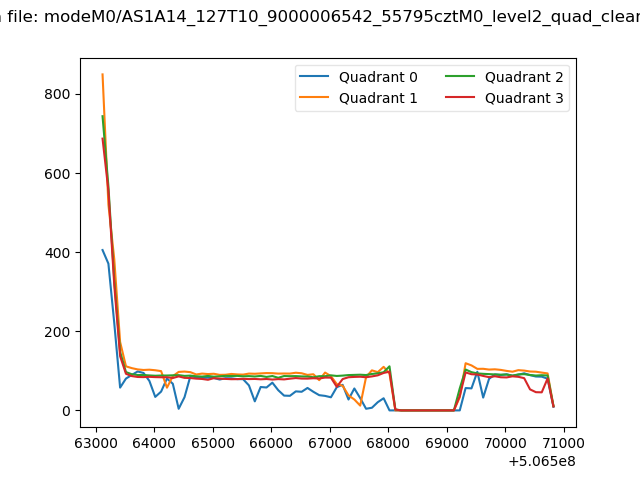 |
|
| Module-wise count rates for Quadrant A Data is divided into 100 sec bins |
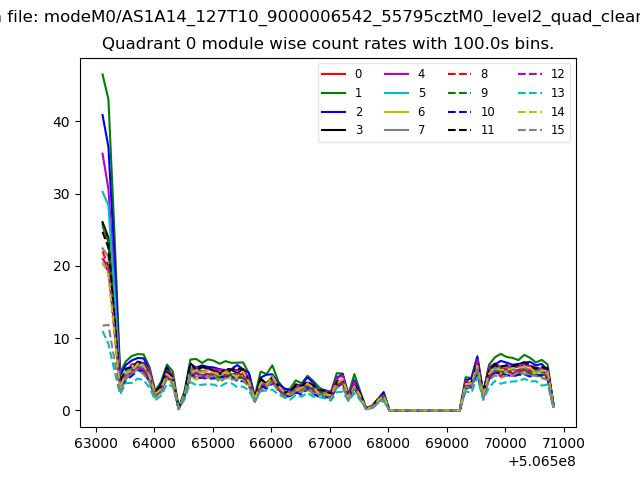 |
 |
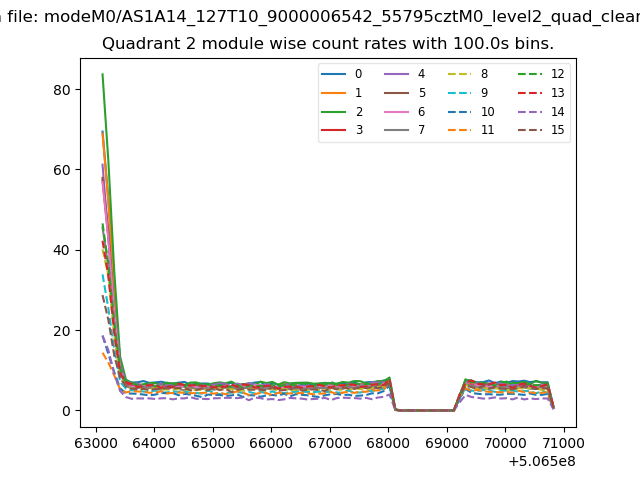
| Module-wise count rates for Quadrant B Data is divided into 100 sec bins |
 |
 |
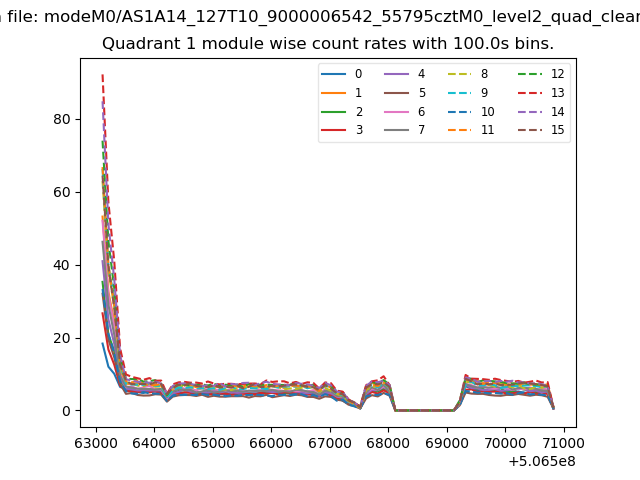
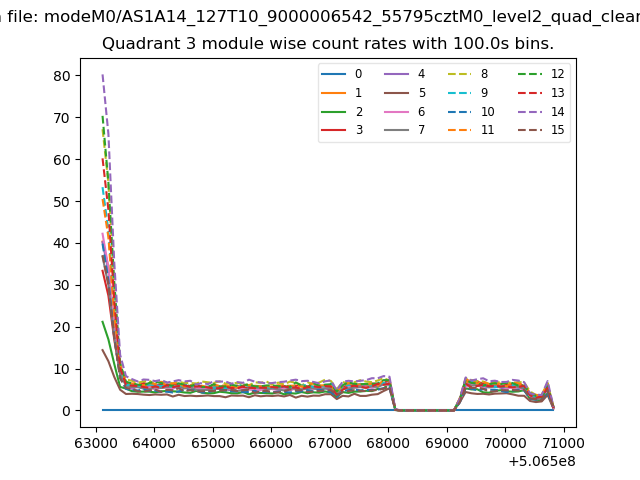
| Module-wise count rates for Quadrant C Data is divided into 100 sec bins |
 |
 |
| Module-wise count rates for Quadrant D Data is divided into 100 sec bins |
 |
 |
| Parameter | Plot |
|---|---|
| CZT HV Monitor | 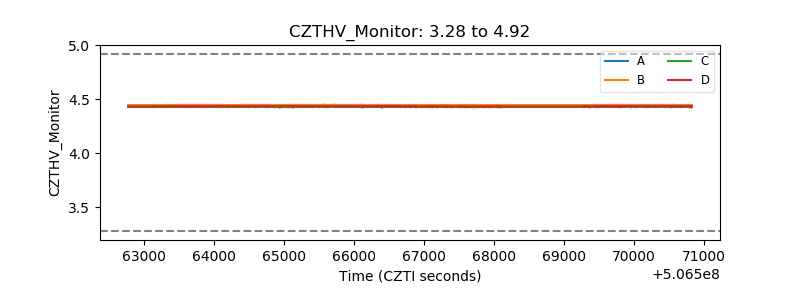 |
| D_VDD | 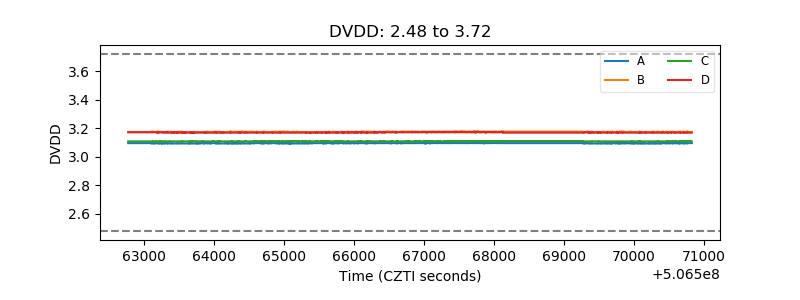 |
| Temperature 1 | 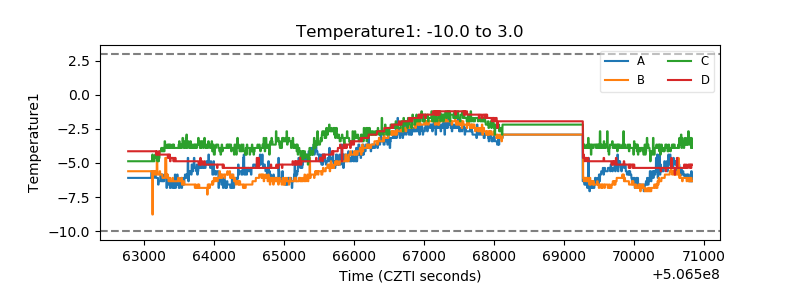 |
| Veto HV Monitor | 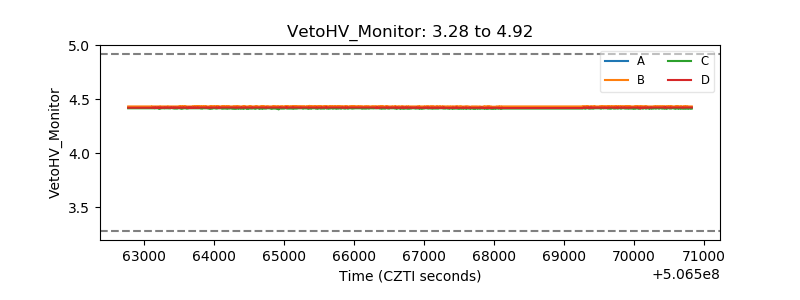 |
| Veto LLD | 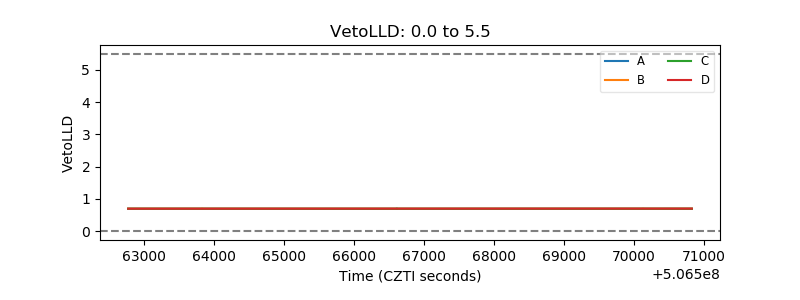 |
| Alpha Counter | 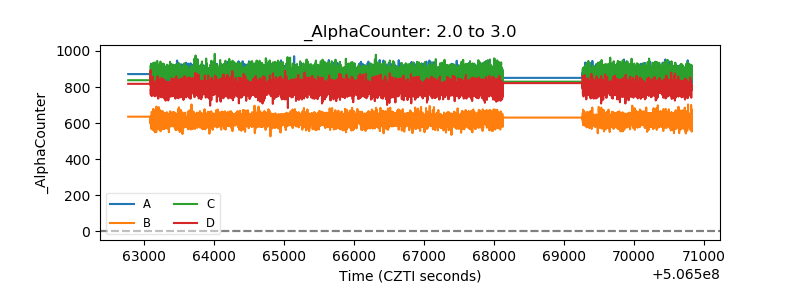 |
| _CPM_Rate | 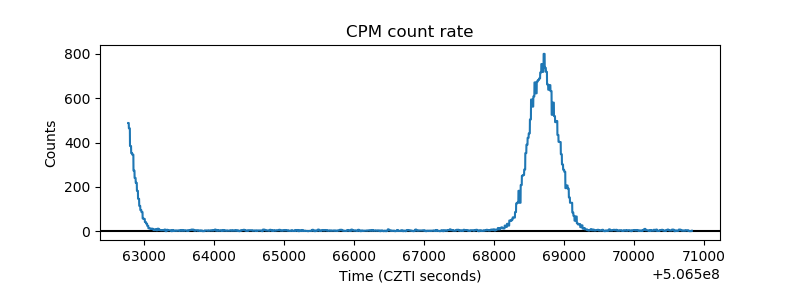 |
| CZT Counter | 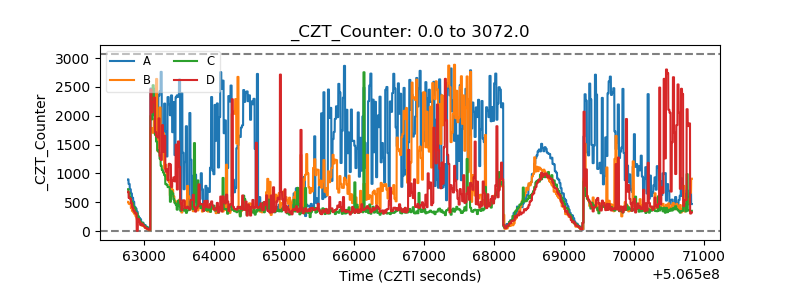 |
| +2.5 Volts monitor |  |
| +5 Volts monitor |  |
| _ROLL_ROT | 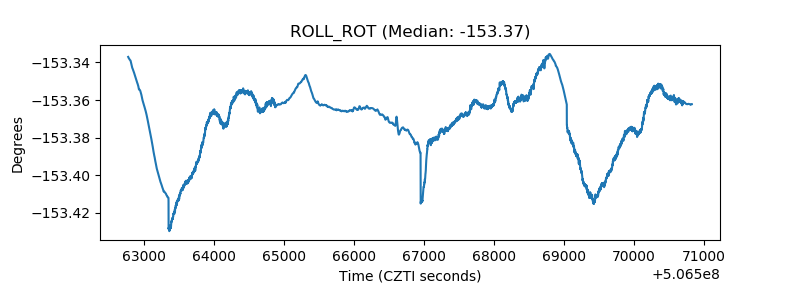 |
| _Roll_DEC | 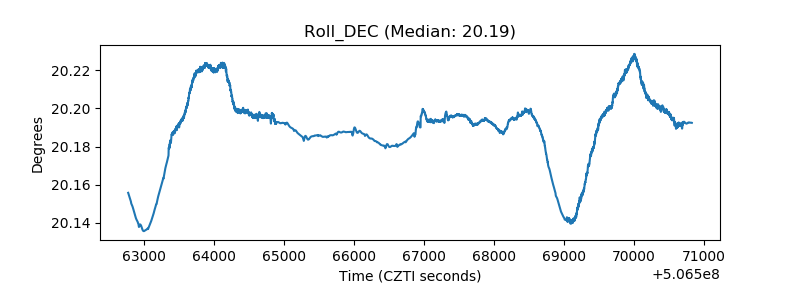 |
| _Roll_RA | 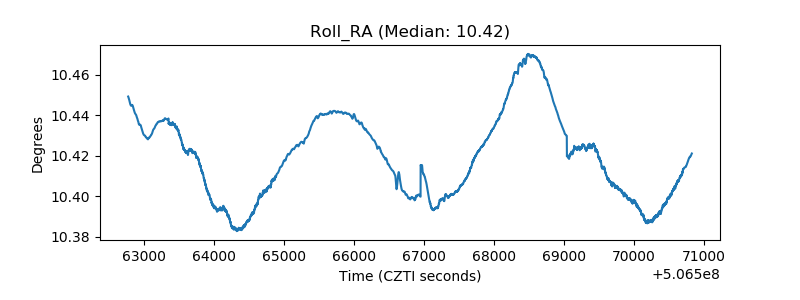 |
| Veto Counter | 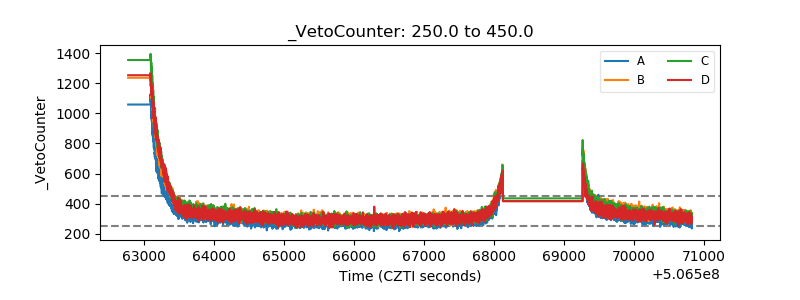 |