| Param | Original file | Final file |
|---|---|---|
| Filename | modeM0/AS1A14_127T10_9000006542_55796cztM0_level2.fits | modeM0/AS1A14_127T10_9000006542_55796cztM0_level2_quad_clean.evt |
| Size (bytes) | 577,710,720 | 79,833,600 |
| Size | 550.9 MB | 76.1 MB |
| Events in quadrant A | 8,297,497 | 426,588 |
| Events in quadrant B | 6,214,454 | 505,238 |
| Events in quadrant C | 2,586,056 | 550,053 |
| Events in quadrant D | 3,805,338 | 502,350 |
| Mode M0 | |||
|---|---|---|---|
| Quadrant | BADHDUFLAG | Total packets | Discarded packets |
| A | 0 | 28932 | 1 |
| B | 0 | 22890 | 1 |
| C | 0 | 13074 | 1 |
| D | 0 | 16158 | 1 |
| Mode M9 | |||
|---|---|---|---|
| Quadrant | BADHDUFLAG | Total packets | Discarded packets |
| A | 0 | 10 | 0 |
| B | 0 | 10 | 0 |
| C | 0 | 10 | 0 |
| D | 0 | 10 | 0 |
| Mode SS | |||
|---|---|---|---|
| Quadrant | BADHDUFLAG | Total packets | Discarded packets |
| A | 0 | 126 | 0 |
| B | 0 | 126 | 0 |
| C | 0 | 126 | 0 |
| D | 0 | 126 | 0 |
| Quadrant | Total seconds | Saturated seconds | Saturation percentage |
|---|---|---|---|
| A | 6201 | 1710 | 27.576197% |
| B | 6201 | 1169 | 18.851798% |
| C | 6202 | 55 | 0.886811% |
| D | 6202 | 284 | 4.579168% |
Noise dominated data is calculated using 1-second bins in cleaned event files. If a bin has >2000 counts, and if more than 50% of those come from <1% of pixels, then it is considered to be noise-dominated and hence unusable.
| Quadrant | # 1 sec bins | Bins with >0 counts | Bins with >2000 counts | High rate bins dominated by noise | Noise dominated (total time) | Noise dominated (detector-on time) | Marked lightcurve |
|---|---|---|---|---|---|---|---|
| A | 7241 | 6203 | 1248 | 1248 | 17.24% | 20.12% | 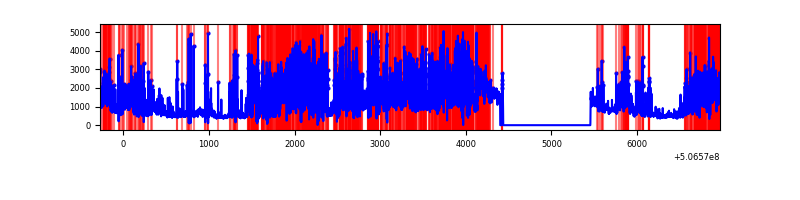 |
| B | 7241 | 6203 | 897 | 897 | 12.39% | 14.46% | 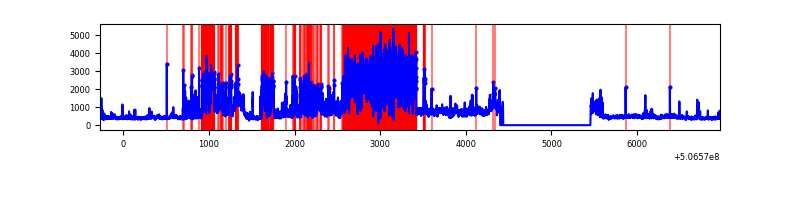 |
| C | 7242 | 6204 | 8 | 8 | 0.11% | 0.13% | 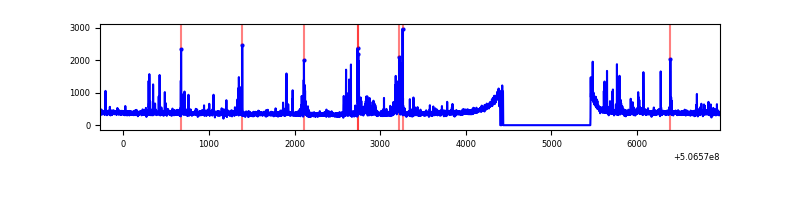 |
| D | 7242 | 6204 | 253 | 253 | 3.49% | 4.08% | 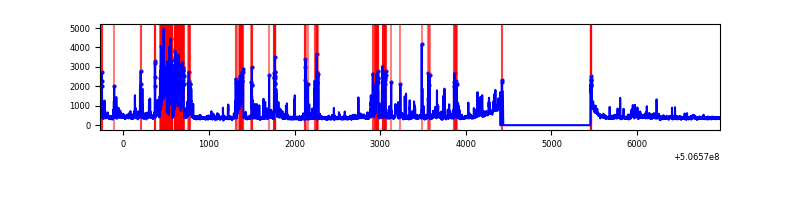 |
Top three noisy pixels from each quadrant. If the there are fewer than three noisy pixels in the level2.evt file, extra rows are filled as -1
| Pixel properties | Quadrant properties | ||||||
|---|---|---|---|---|---|---|---|
| Quadrant | DetID | PixID | Counts | Sigma | Mean | Median | Sigma |
| A | 15 | 32 | 5274924 | 39137.06 | 532 | 518 | 134.8 |
| A | 0 | 8 | 358609 | 2657.1 | 532 | 518 | 134.8 |
| A | 8 | 192 | 251748 | 1864.17 | 532 | 518 | 134.8 |
| B | 4 | 206 | 2720565 | 22543.58 | 556 | 536 | 120.7 |
| B | 7 | 0 | 630762 | 5223.31 | 556 | 536 | 120.7 |
| B | 5 | 172 | 543944 | 4503.76 | 556 | 536 | 120.7 |
| C | 13 | 3 | 114594 | 688.25 | 599 | 595 | 165.6 |
| C | 15 | 200 | 59834 | 357.65 | 599 | 595 | 165.6 |
| C | 6 | 223 | 27087 | 159.94 | 599 | 595 | 165.6 |
| D | 11 | 129 | 652785 | 3957.24 | 583 | 559 | 164.8 |
| D | 3 | 12 | 484244 | 2934.65 | 583 | 559 | 164.8 |
| D | 8 | 245 | 122676 | 740.92 | 583 | 559 | 164.8 |
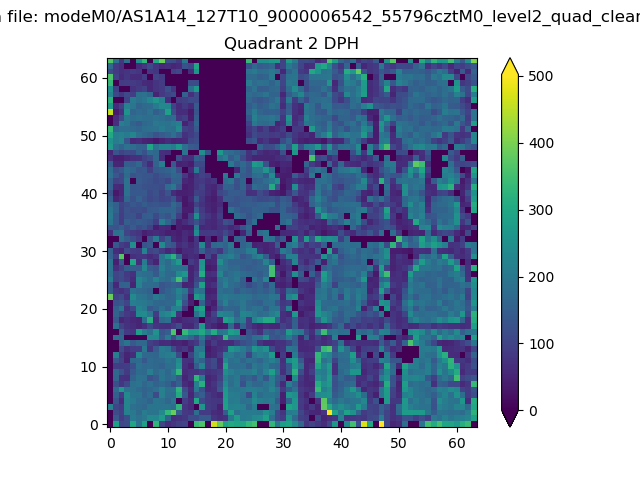
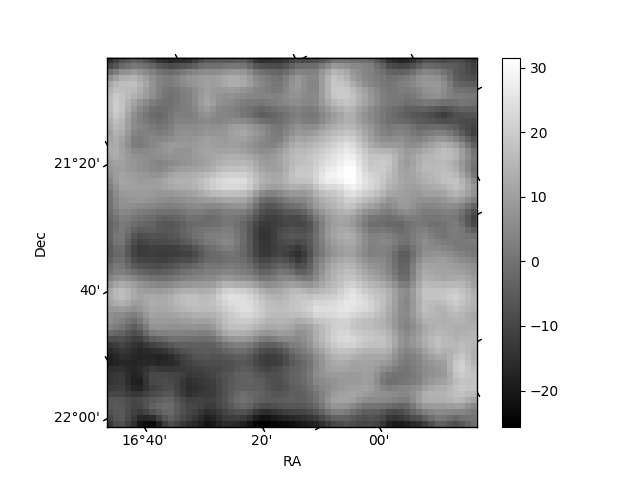
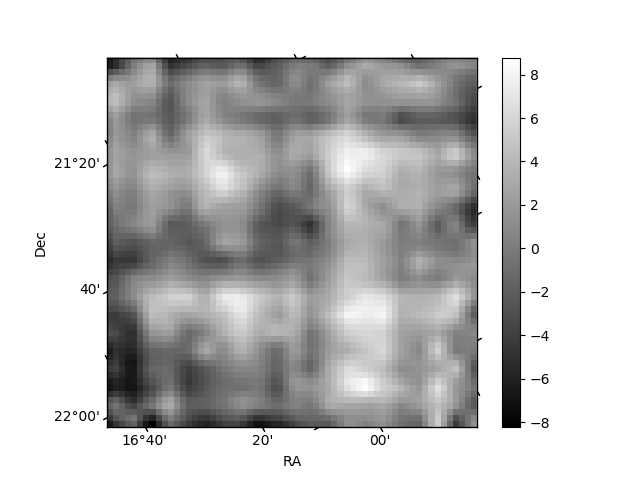
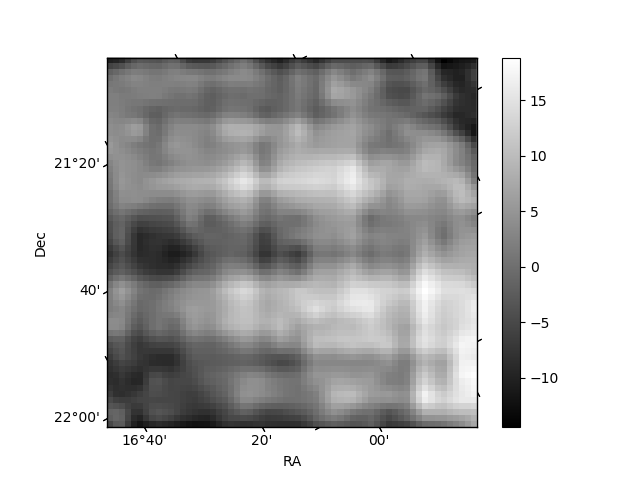
Histogram calculated using DETX and DETY for each event in the final _common_clean file
| Quadrant A | 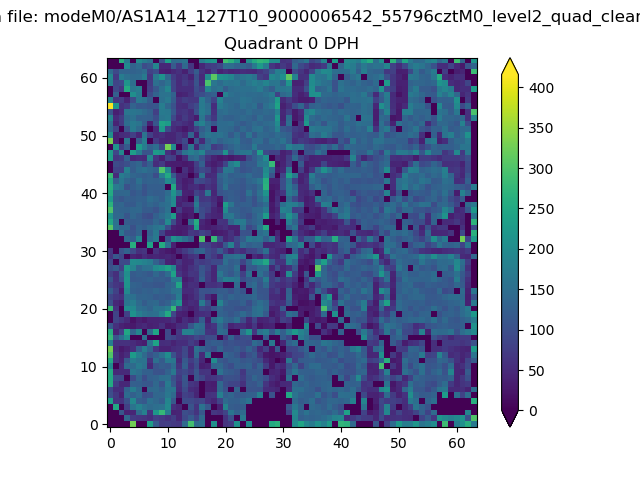 |
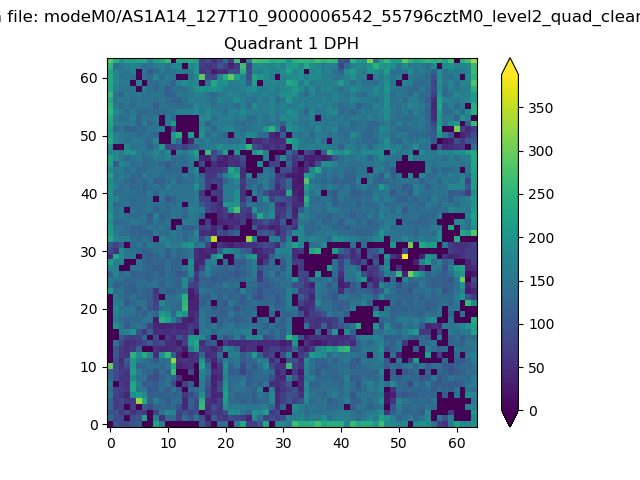 |
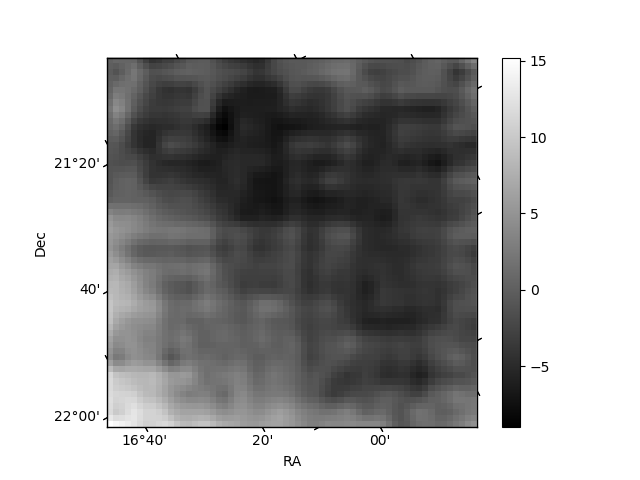
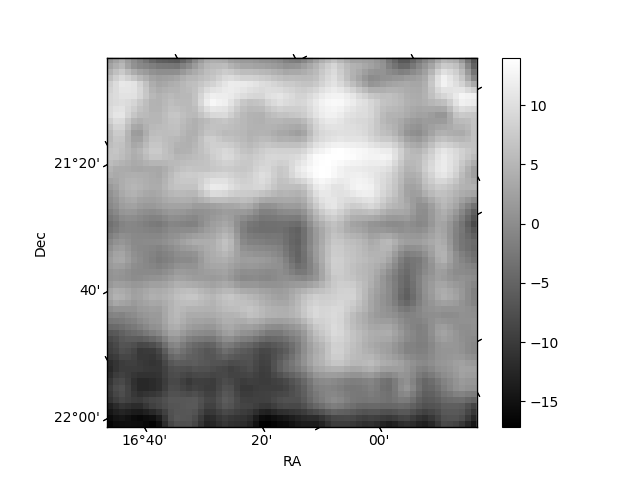
Quadrant B |
|---|---|---|---|
| Quadrant D | 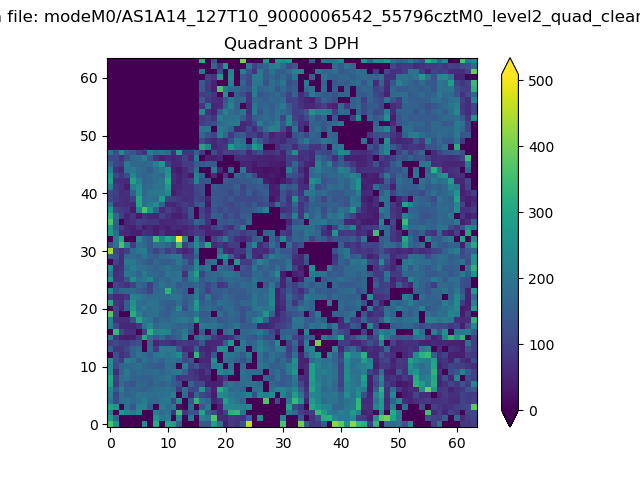 |
 |
Quadrant C |
| Plot type | Count rate plots | Images |
|---|---|---|
| Comparison with Poisson distribution Blue bars denote a histogram of data divided into 1 sec bins. Red curve is a Poisson curve with rate = median count rate of data. |
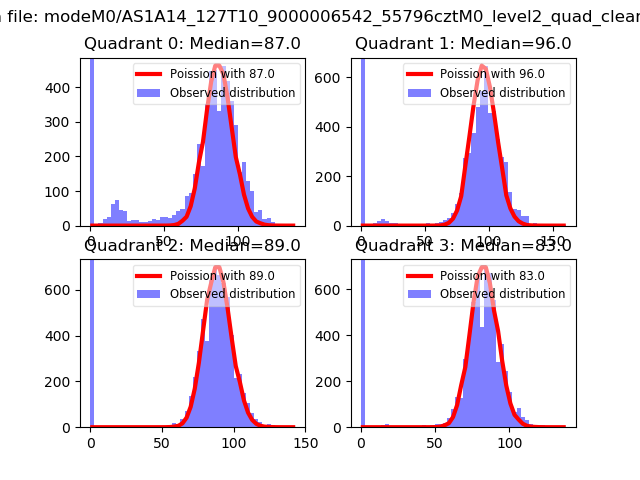 |
 |
| Quadrant-wise count rates Data is divided into 100 sec bins |
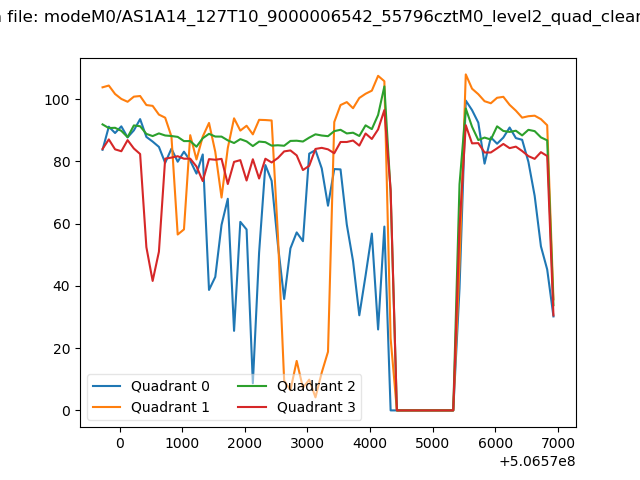 |
|
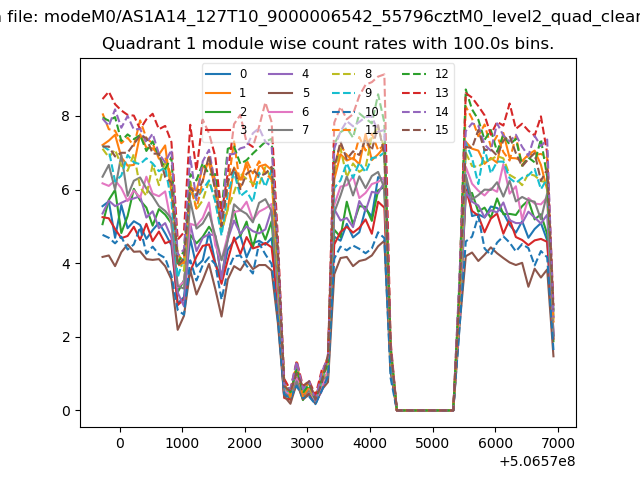
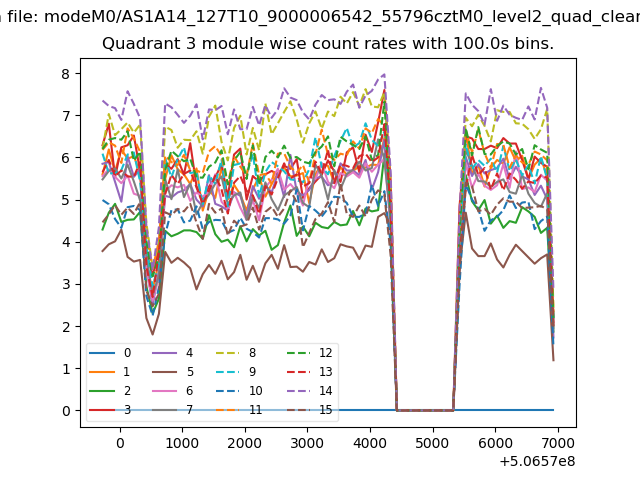
| Module-wise count rates for Quadrant A Data is divided into 100 sec bins |
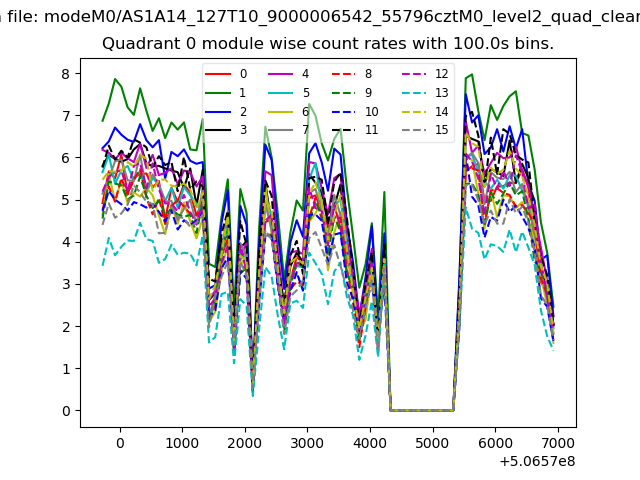 |
 |
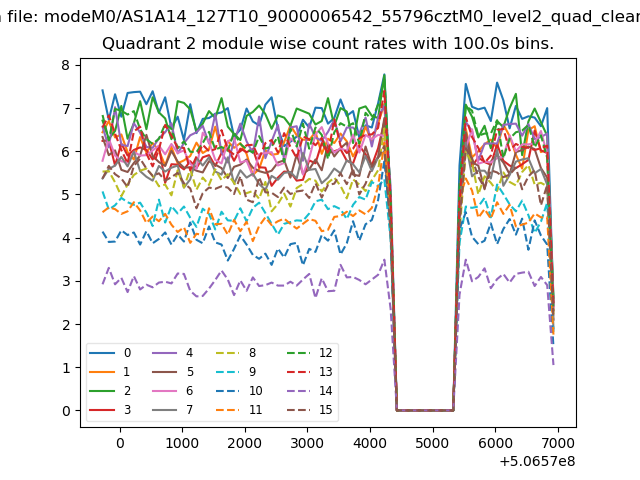
| Module-wise count rates for Quadrant B Data is divided into 100 sec bins |
 |
 |
| Module-wise count rates for Quadrant C Data is divided into 100 sec bins |
 |
 |
| Module-wise count rates for Quadrant D Data is divided into 100 sec bins |
 |
 |
| Parameter | Plot |
|---|---|
| CZT HV Monitor | 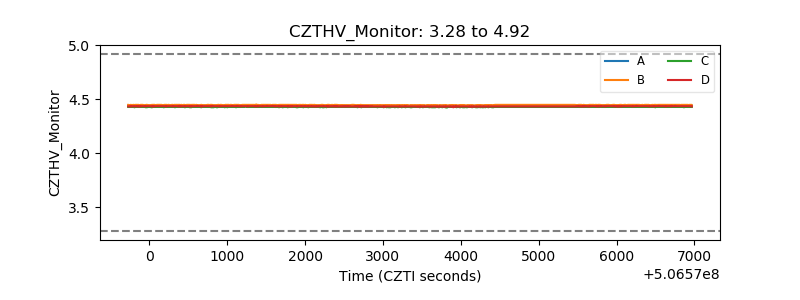 |
| D_VDD | 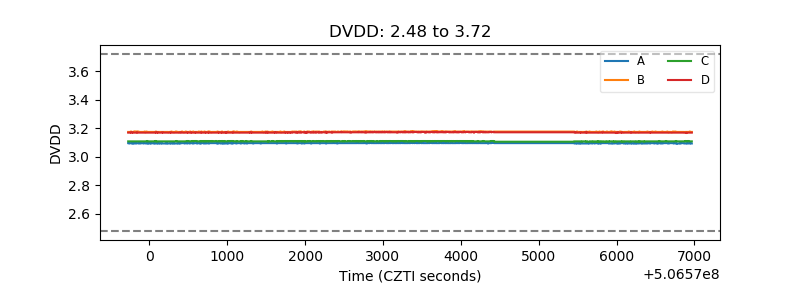 |
| Temperature 1 | 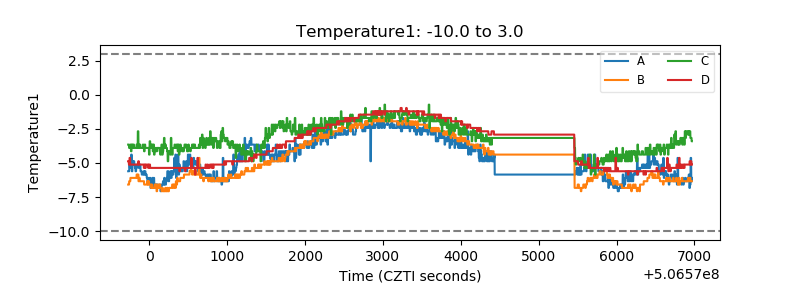 |
| Veto HV Monitor | 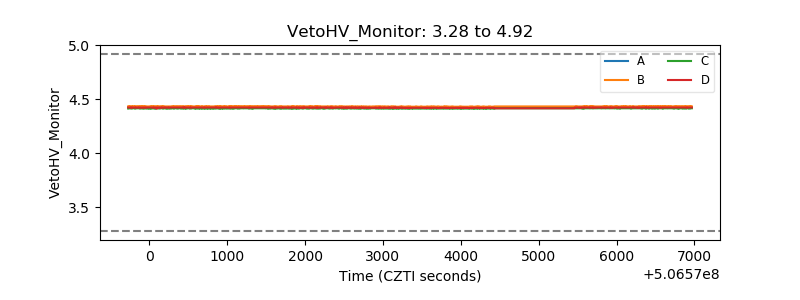 |
| Veto LLD | 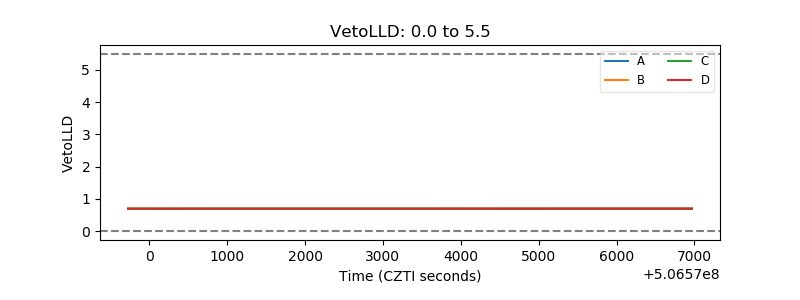 |
| Alpha Counter | 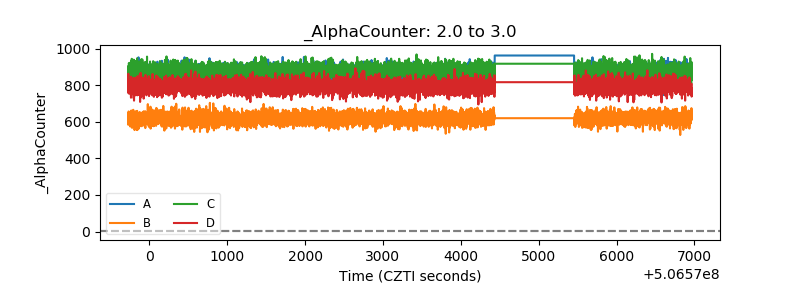 |
| _CPM_Rate | 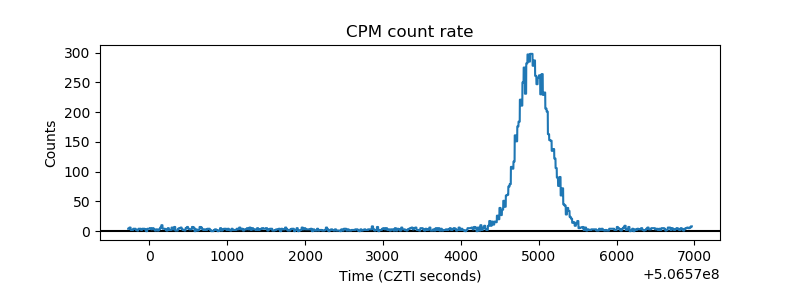 |
| CZT Counter | 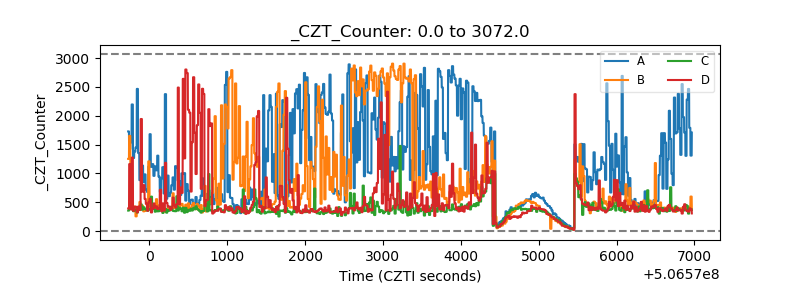 |
| +2.5 Volts monitor |  |
| +5 Volts monitor |  |
| _ROLL_ROT | 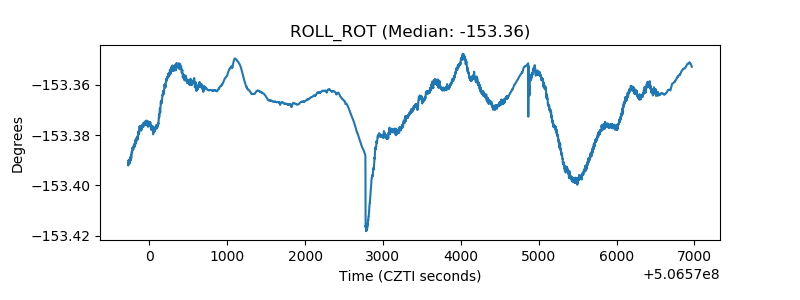 |
| _Roll_DEC | 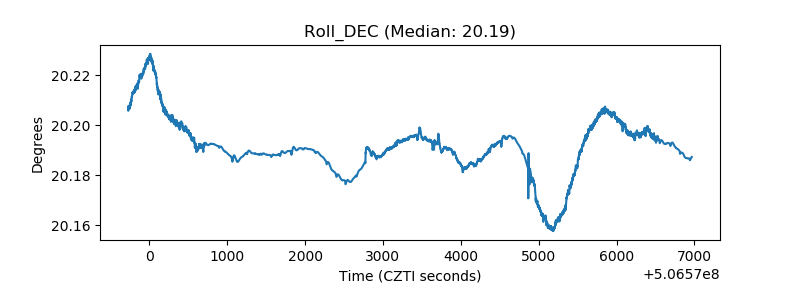 |
| _Roll_RA | 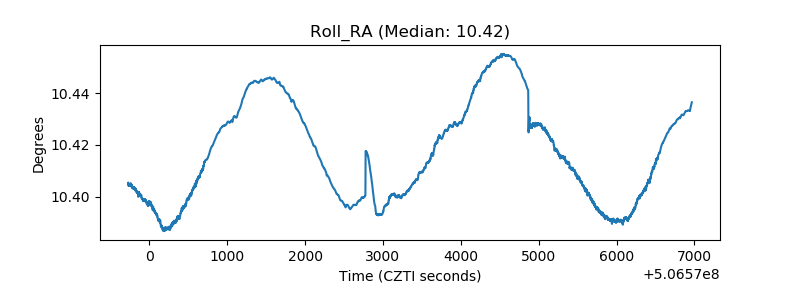 |
| Veto Counter | 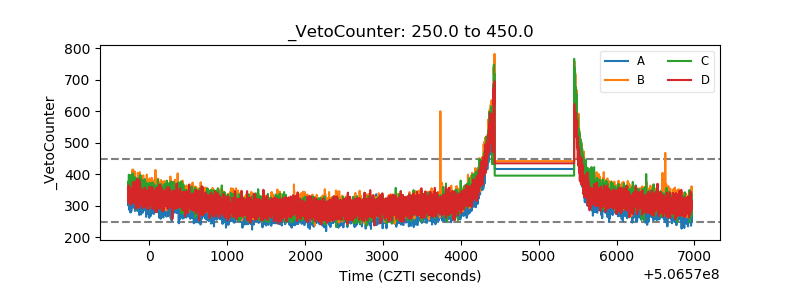 |