| Param | Original file | Final file |
|---|---|---|
| Filename | modeM0/AS1A14_127T10_9000006542_55798cztM0_level2.fits | modeM0/AS1A14_127T10_9000006542_55798cztM0_level2_quad_clean.evt |
| Size (bytes) | 675,910,080 | 107,933,760 |
| Size | 644.6 MB | 102.9 MB |
| Events in quadrant A | 11,617,752 | 543,947 |
| Events in quadrant B | 3,692,763 | 765,672 |
| Events in quadrant C | 4,080,004 | 723,198 |
| Events in quadrant D | 4,994,188 | 667,109 |
| Mode M0 | |||
|---|---|---|---|
| Quadrant | BADHDUFLAG | Total packets | Discarded packets |
| A | 0 | 40213 | 1 |
| B | 0 | 17651 | 1 |
| C | 0 | 18906 | 1 |
| D | 0 | 21195 | 1 |
| Mode M9 | |||
|---|---|---|---|
| Quadrant | BADHDUFLAG | Total packets | Discarded packets |
| A | 0 | 8 | 0 |
| B | 0 | 8 | 0 |
| C | 0 | 8 | 0 |
| D | 0 | 8 | 0 |
| Mode SS | |||
|---|---|---|---|
| Quadrant | BADHDUFLAG | Total packets | Discarded packets |
| A | 0 | 164 | 0 |
| B | 0 | 164 | 0 |
| C | 0 | 164 | 0 |
| D | 0 | 164 | 0 |
| Quadrant | Total seconds | Saturated seconds | Saturation percentage |
|---|---|---|---|
| A | 8181 | 2404 | 29.385161% |
| B | 8181 | 516 | 6.307297% |
| C | 8180 | 305 | 3.728606% |
| D | 8180 | 556 | 6.797066% |
Noise dominated data is calculated using 1-second bins in cleaned event files. If a bin has >2000 counts, and if more than 50% of those come from <1% of pixels, then it is considered to be noise-dominated and hence unusable.
| Quadrant | # 1 sec bins | Bins with >0 counts | Bins with >2000 counts | High rate bins dominated by noise | Noise dominated (total time) | Noise dominated (detector-on time) | Marked lightcurve |
|---|---|---|---|---|---|---|---|
| A | 8966 | 8180 | 1687 | 1687 | 18.82% | 20.62% | 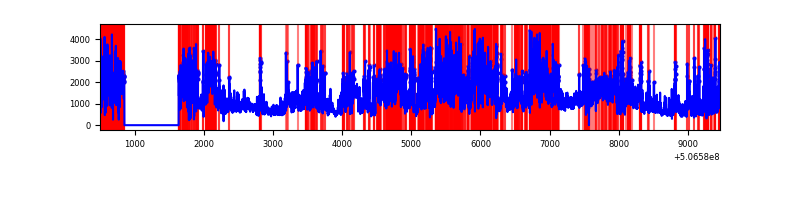 |
| B | 8966 | 8182 | 12 | 12 | 0.13% | 0.15% | 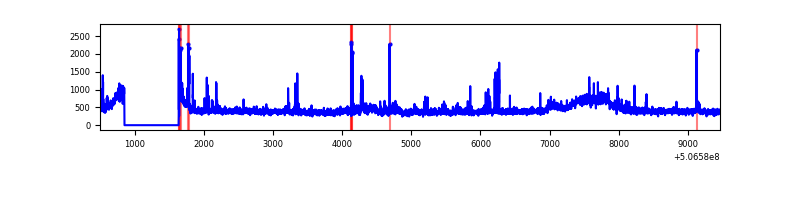 |
| C | 8965 | 8181 | 110 | 110 | 1.23% | 1.34% | 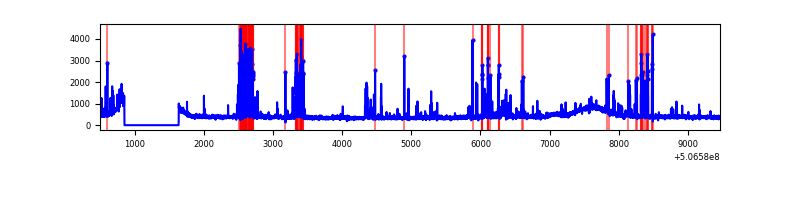 |
| D | 8965 | 8181 | 235 | 235 | 2.62% | 2.87% | 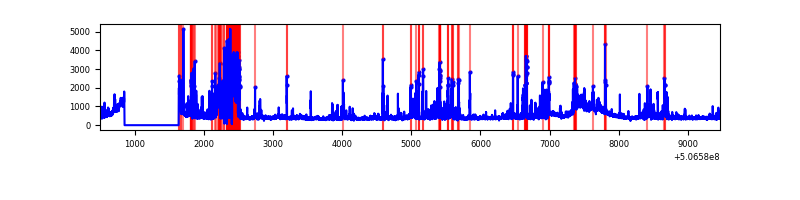 |
Top three noisy pixels from each quadrant. If the there are fewer than three noisy pixels in the level2.evt file, extra rows are filled as -1
| Pixel properties | Quadrant properties | ||||||
|---|---|---|---|---|---|---|---|
| Quadrant | DetID | PixID | Counts | Sigma | Mean | Median | Sigma |
| A | 15 | 32 | 7022173 | 37736.74 | 743 | 722 | 186.1 |
| A | 7 | 64 | 911491 | 4894.92 | 743 | 722 | 186.1 |
| A | 8 | 192 | 288341 | 1545.81 | 743 | 722 | 186.1 |
| B | 4 | 206 | 128877 | 690.6 | 853 | 819 | 185.4 |
| B | 5 | 172 | 87549 | 467.72 | 853 | 819 | 185.4 |
| B | 0 | 199 | 31155 | 163.6 | 853 | 819 | 185.4 |
| C | 13 | 3 | 564383 | 2434.6 | 848 | 842 | 231.5 |
| C | 12 | 252 | 68295 | 291.41 | 848 | 842 | 231.5 |
| C | 15 | 200 | 32815 | 138.13 | 848 | 842 | 231.5 |
| D | 11 | 129 | 1124119 | 4763.89 | 839 | 804 | 235.8 |
| D | 8 | 245 | 228625 | 966.17 | 839 | 804 | 235.8 |
| D | 7 | 70 | 93971 | 395.11 | 839 | 804 | 235.8 |
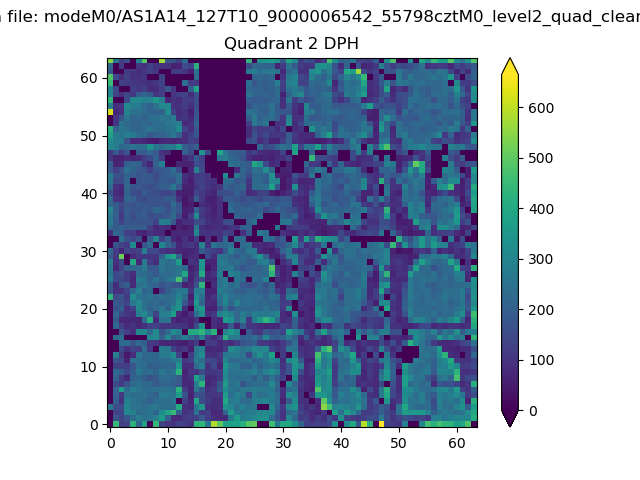
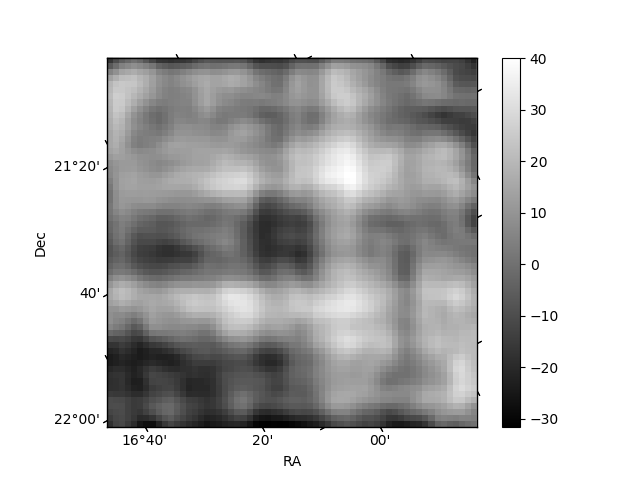
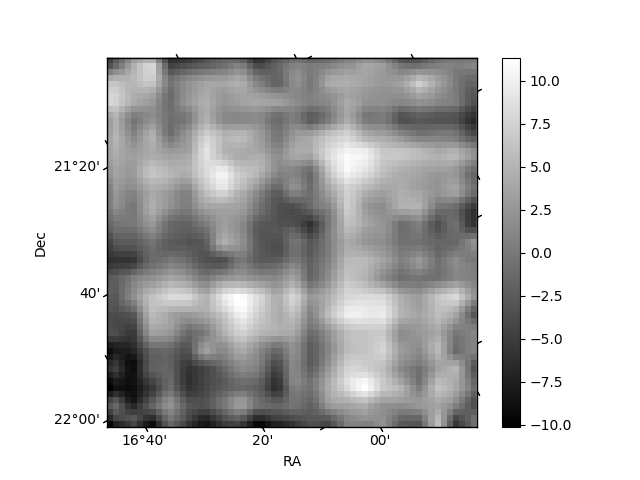
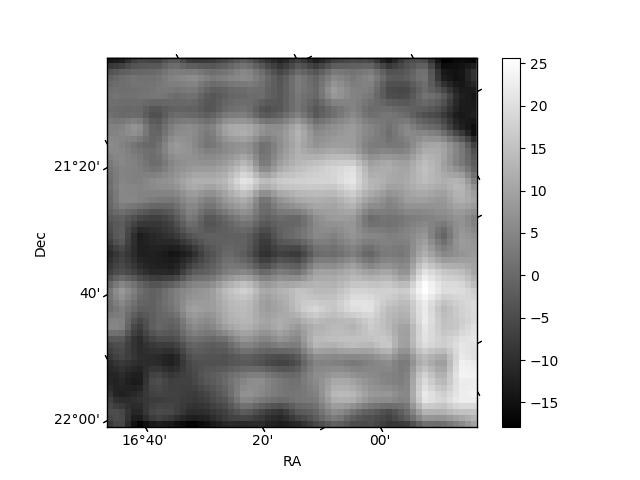
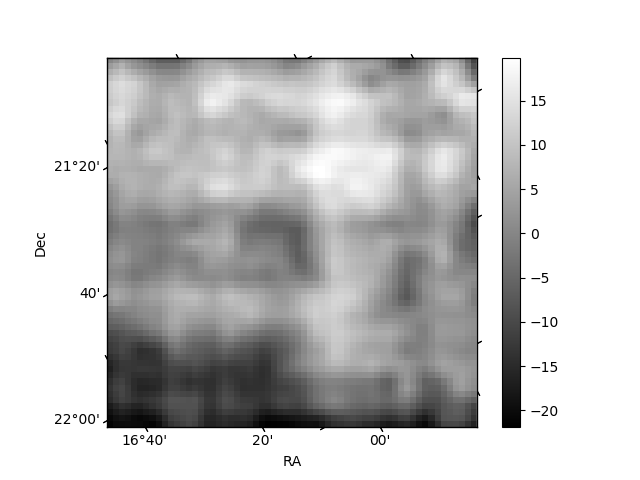
Histogram calculated using DETX and DETY for each event in the final _common_clean file
| Quadrant A | 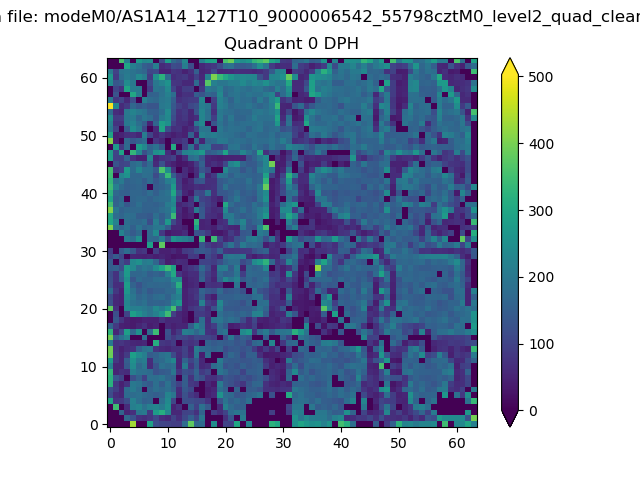 |
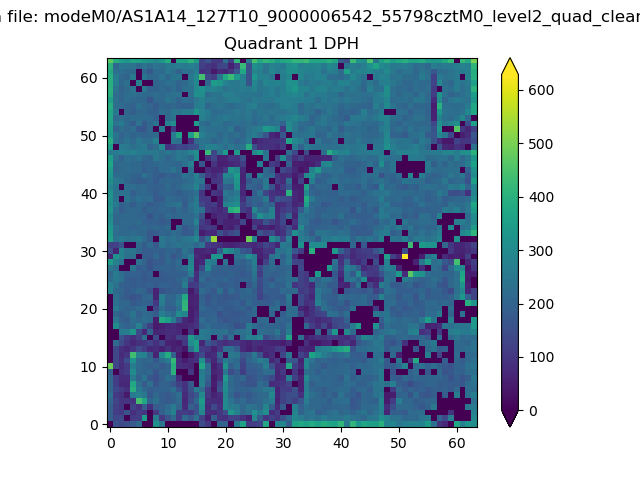 |
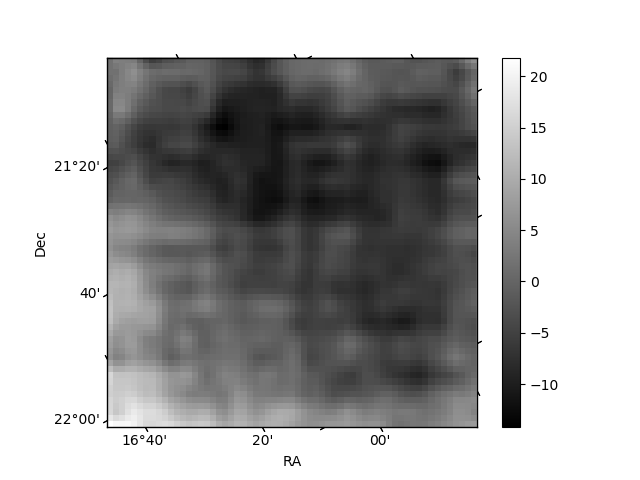
Quadrant B |
|---|---|---|---|
| Quadrant D | 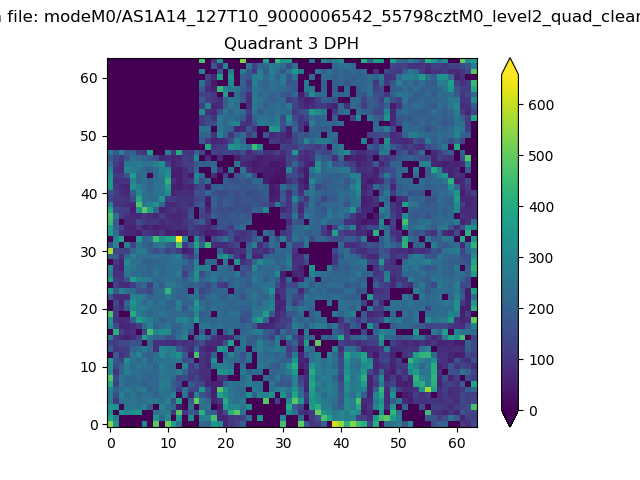 |
 |
Quadrant C |
| Plot type | Count rate plots | Images |
|---|---|---|
| Comparison with Poisson distribution Blue bars denote a histogram of data divided into 1 sec bins. Red curve is a Poisson curve with rate = median count rate of data. |
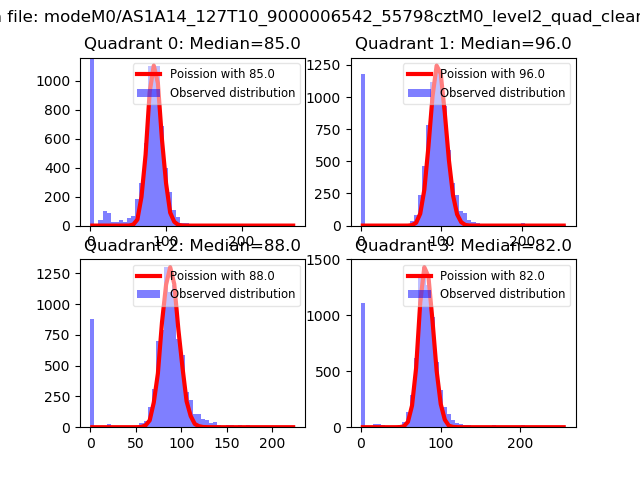 |
 |
| Quadrant-wise count rates Data is divided into 100 sec bins |
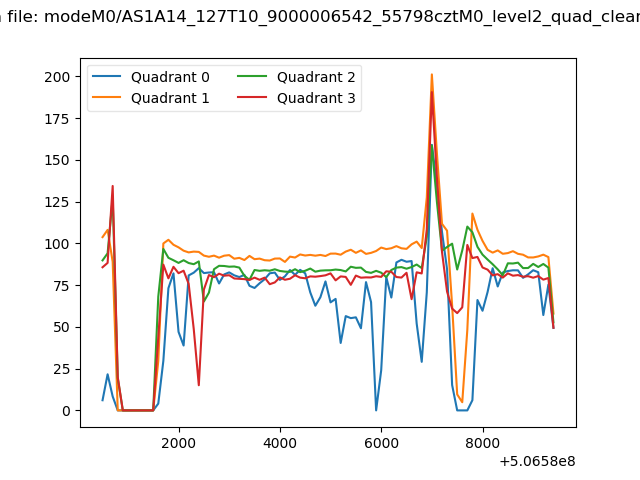 |
|
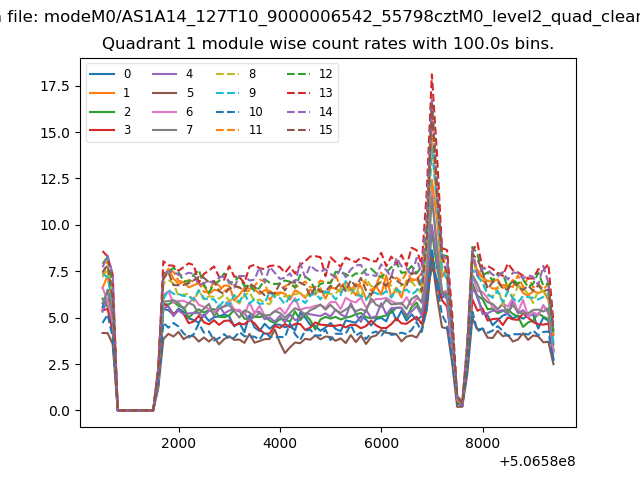
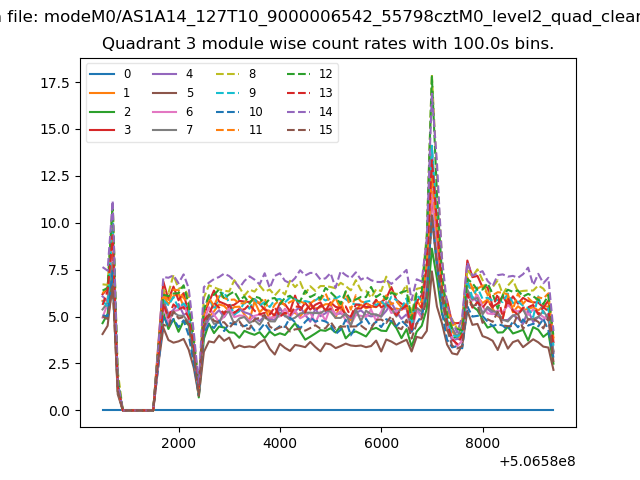
| Module-wise count rates for Quadrant A Data is divided into 100 sec bins |
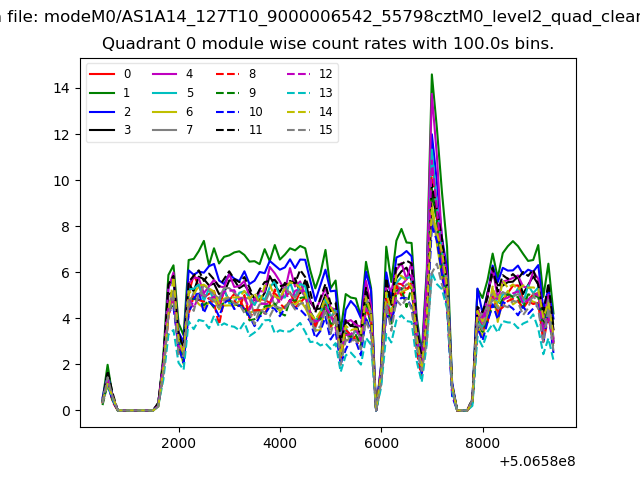 |
 |
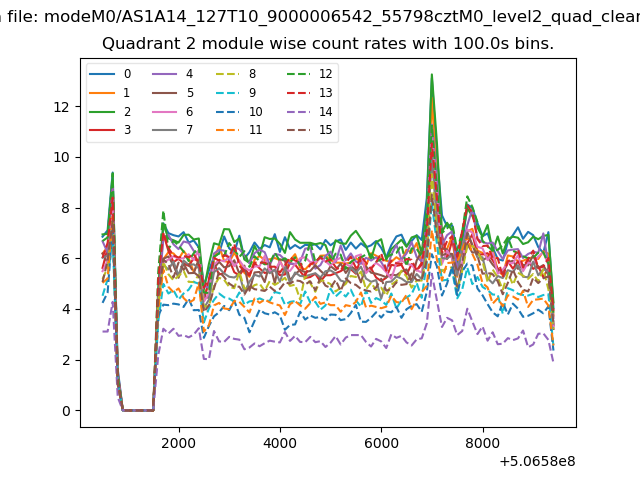
| Module-wise count rates for Quadrant B Data is divided into 100 sec bins |
 |
 |
| Module-wise count rates for Quadrant C Data is divided into 100 sec bins |
 |
 |
| Module-wise count rates for Quadrant D Data is divided into 100 sec bins |
 |
 |
| Parameter | Plot |
|---|---|
| CZT HV Monitor | 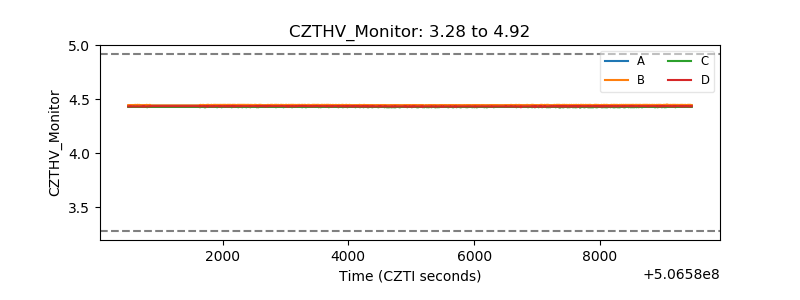 |
| D_VDD | 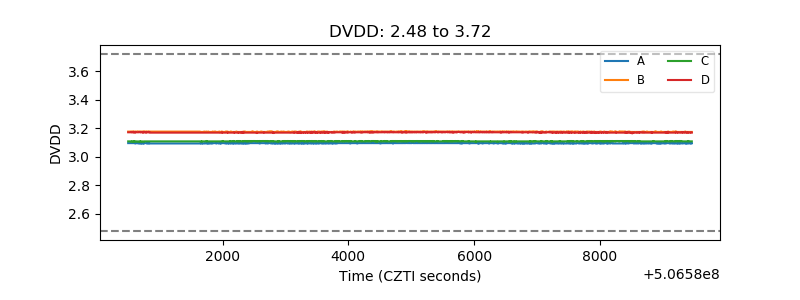 |
| Temperature 1 | 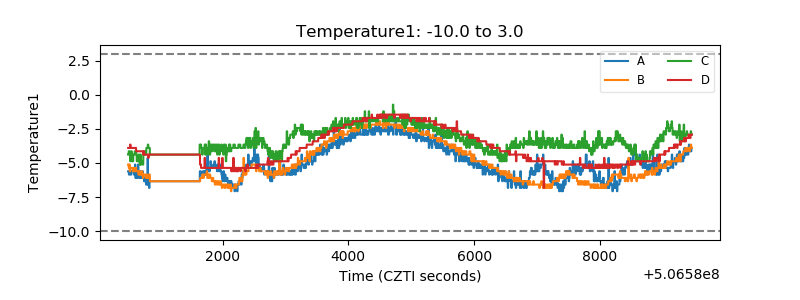 |
| Veto HV Monitor | 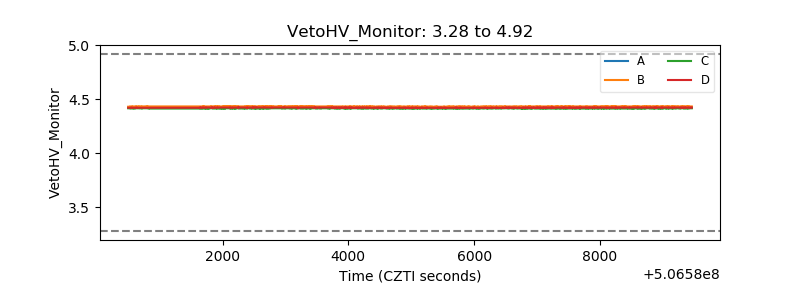 |
| Veto LLD | 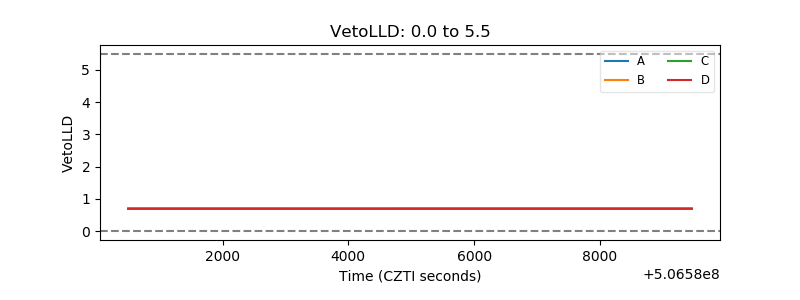 |
| Alpha Counter | 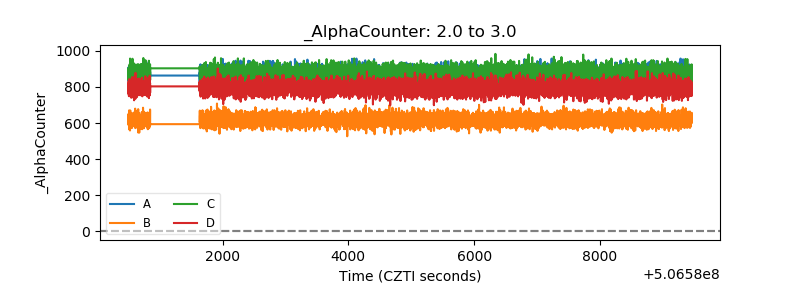 |
| _CPM_Rate | 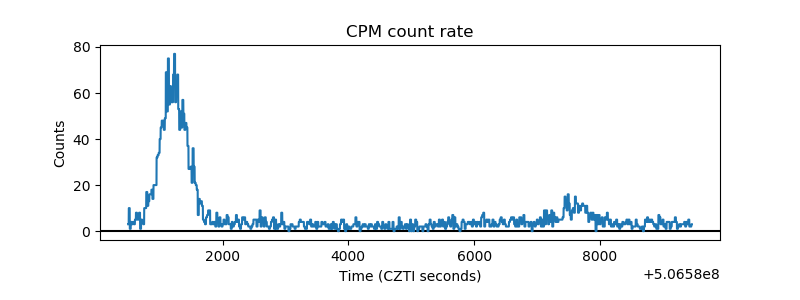 |
| CZT Counter | 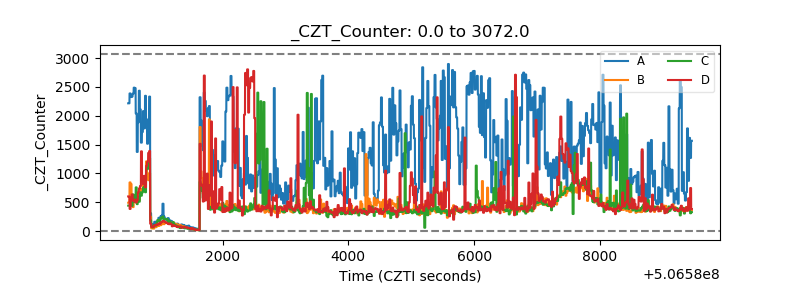 |
| +2.5 Volts monitor |  |
| +5 Volts monitor |  |
| _ROLL_ROT | 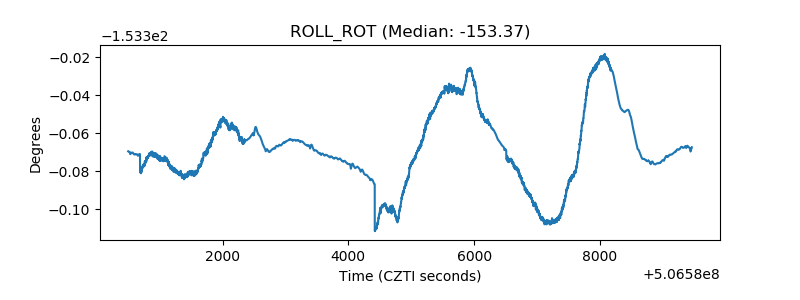 |
| _Roll_DEC | 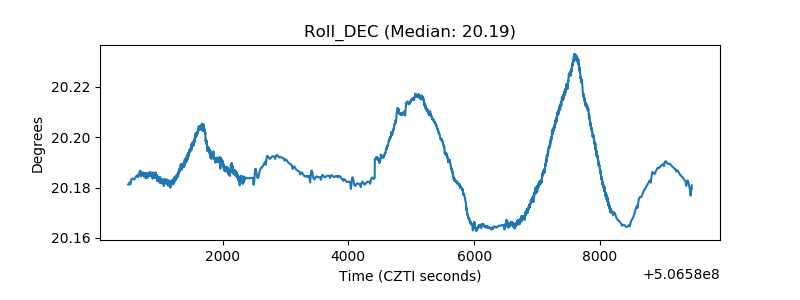 |
| _Roll_RA | 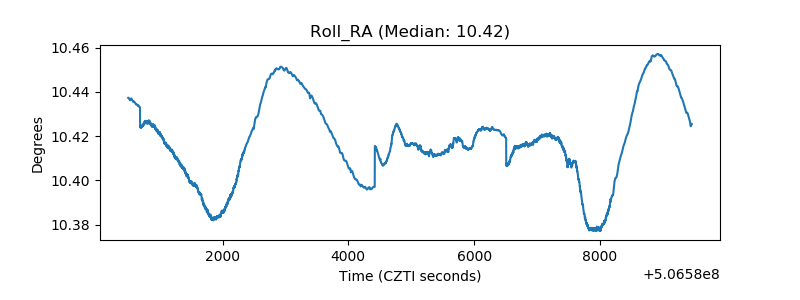 |
| Veto Counter | 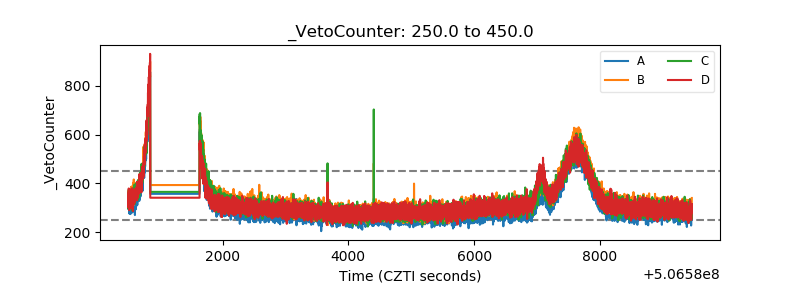 |