| Param | Original file | Final file |
|---|---|---|
| Filename | modeM0/AS1A14_127T10_9000006542_55799cztM0_level2.fits | modeM0/AS1A14_127T10_9000006542_55799cztM0_level2_quad_clean.evt |
| Size (bytes) | 1,702,863,360 | 234,244,800 |
| Size | 1.6 GB | 223.4 MB |
| Events in quadrant A | 31,423,635 | 1,009,304 |
| Events in quadrant B | 8,739,843 | 1,749,077 |
| Events in quadrant C | 11,380,818 | 1,546,698 |
| Events in quadrant D | 10,053,235 | 1,507,268 |
| Mode M0 | |||
|---|---|---|---|
| Quadrant | BADHDUFLAG | Total packets | Discarded packets |
| A | 0 | 106232 | 1 |
| B | 0 | 40871 | 1 |
| C | 0 | 49354 | 3 |
| D | 0 | 44420 | 1 |
| Mode M9 | |||
|---|---|---|---|
| Quadrant | BADHDUFLAG | Total packets | Discarded packets |
| A | 0 | 8 | 0 |
| B | 0 | 8 | 0 |
| C | 0 | 8 | 0 |
| D | 0 | 8 | 0 |
| Mode SS | |||
|---|---|---|---|
| Quadrant | BADHDUFLAG | Total packets | Discarded packets |
| A | 0 | 372 | 0 |
| B | 0 | 372 | 0 |
| C | 0 | 372 | 0 |
| D | 0 | 372 | 0 |
| Quadrant | Total seconds | Saturated seconds | Saturation percentage |
|---|---|---|---|
| A | 18576 | 7709 | 41.499785% |
| B | 18577 | 751 | 4.042633% |
| C | 18576 | 1296 | 6.976744% |
| D | 18576 | 636 | 3.423773% |
Noise dominated data is calculated using 1-second bins in cleaned event files. If a bin has >2000 counts, and if more than 50% of those come from <1% of pixels, then it is considered to be noise-dominated and hence unusable.
| Quadrant | # 1 sec bins | Bins with >0 counts | Bins with >2000 counts | High rate bins dominated by noise | Noise dominated (total time) | Noise dominated (detector-on time) | Marked lightcurve |
|---|---|---|---|---|---|---|---|
| A | 19360 | 18573 | 6583 | 6583 | 34.00% | 35.44% | 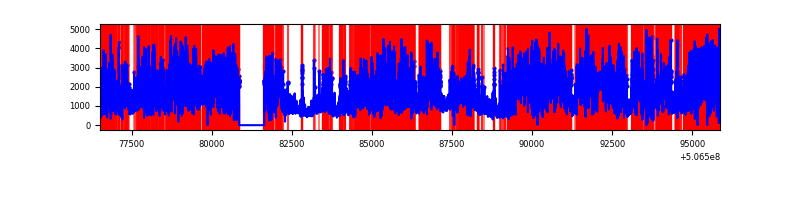 |
| B | 19362 | 18578 | 210 | 210 | 1.08% | 1.13% | 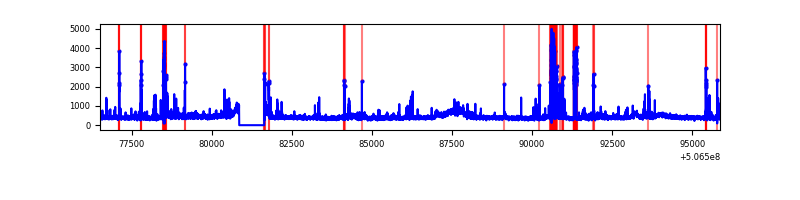 |
| C | 19361 | 18577 | 864 | 864 | 4.46% | 4.65% | 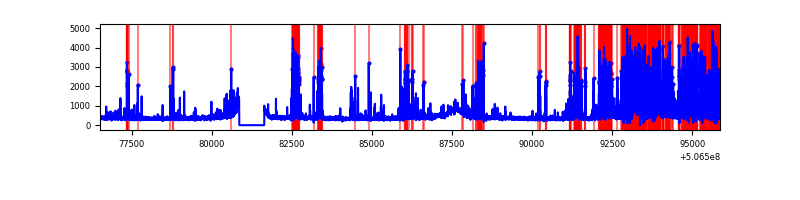 |
| D | 19361 | 18577 | 313 | 313 | 1.62% | 1.68% | 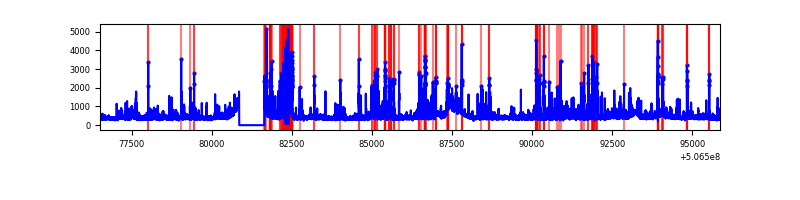 |
Top three noisy pixels from each quadrant. If the there are fewer than three noisy pixels in the level2.evt file, extra rows are filled as -1
| Pixel properties | Quadrant properties | ||||||
|---|---|---|---|---|---|---|---|
| Quadrant | DetID | PixID | Counts | Sigma | Mean | Median | Sigma |
| A | 15 | 32 | 21933483 | 57480.52 | 1512 | 1474 | 381.6 |
| A | 7 | 64 | 1531545 | 4010.09 | 1512 | 1474 | 381.6 |
| A | 8 | 192 | 626595 | 1638.35 | 1512 | 1474 | 381.6 |
| B | 4 | 206 | 973042 | 2494.01 | 1816 | 1744 | 389.5 |
| B | 5 | 172 | 187002 | 475.69 | 1816 | 1744 | 389.5 |
| B | 0 | 153 | 140818 | 357.1 | 1816 | 1744 | 389.5 |
| C | 13 | 3 | 4060436 | 8429.02 | 1761 | 1749 | 481.5 |
| C | 12 | 252 | 157220 | 322.88 | 1761 | 1749 | 481.5 |
| C | 6 | 223 | 73745 | 149.52 | 1761 | 1749 | 481.5 |
| D | 11 | 129 | 1659560 | 3244.64 | 1802 | 1725 | 510.9 |
| D | 8 | 245 | 331418 | 645.26 | 1802 | 1725 | 510.9 |
| D | 3 | 12 | 196229 | 380.67 | 1802 | 1725 | 510.9 |
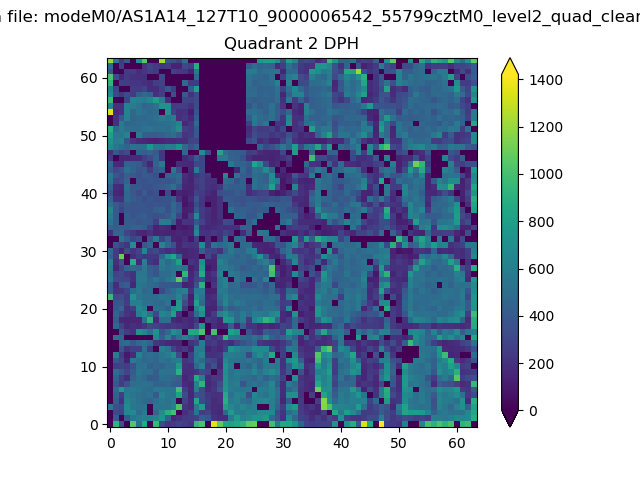
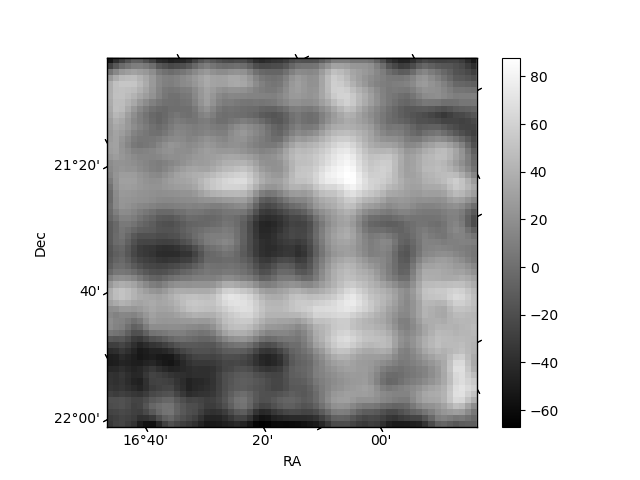
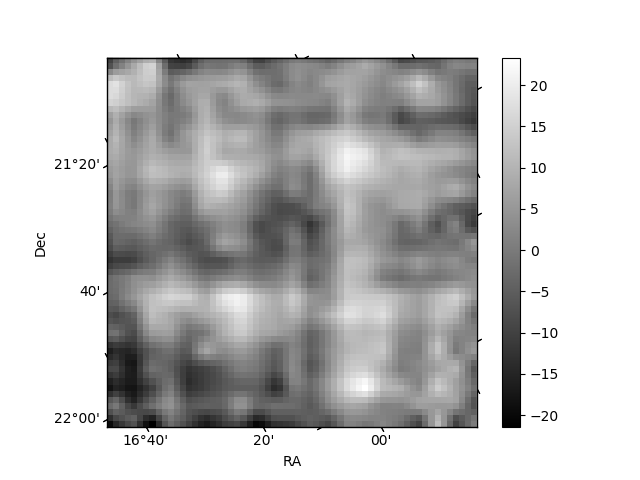
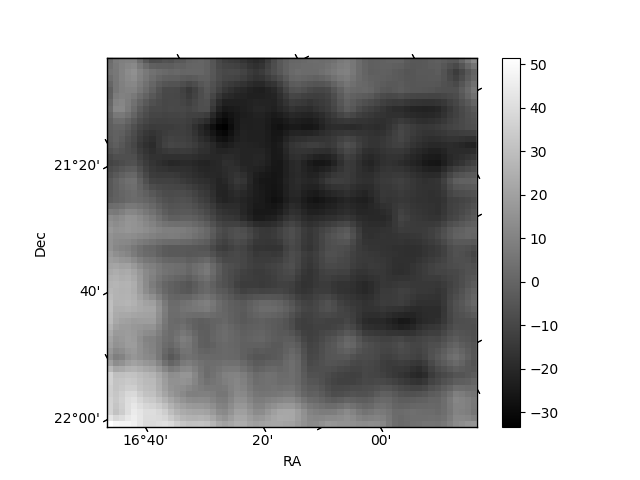
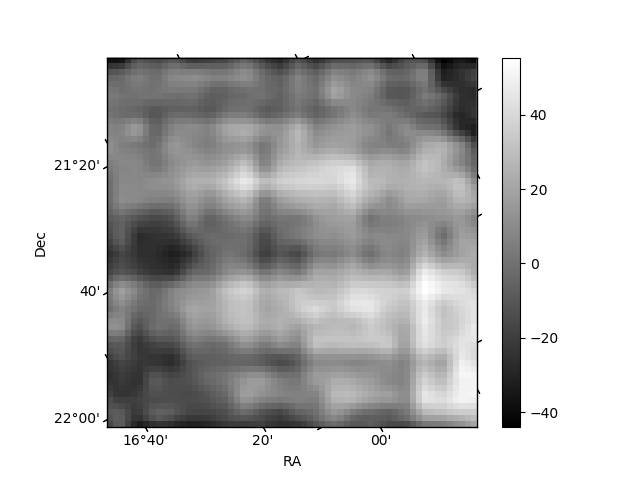
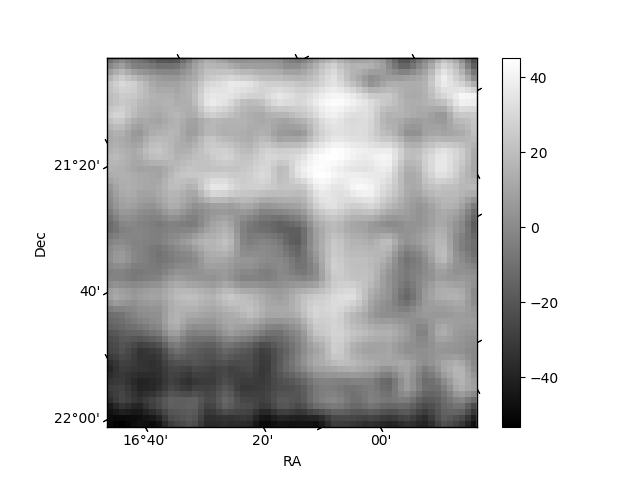
Histogram calculated using DETX and DETY for each event in the final _common_clean file
| Quadrant A | 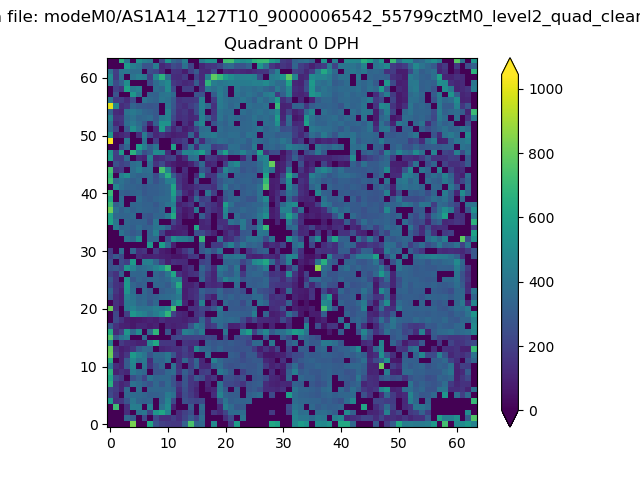 |
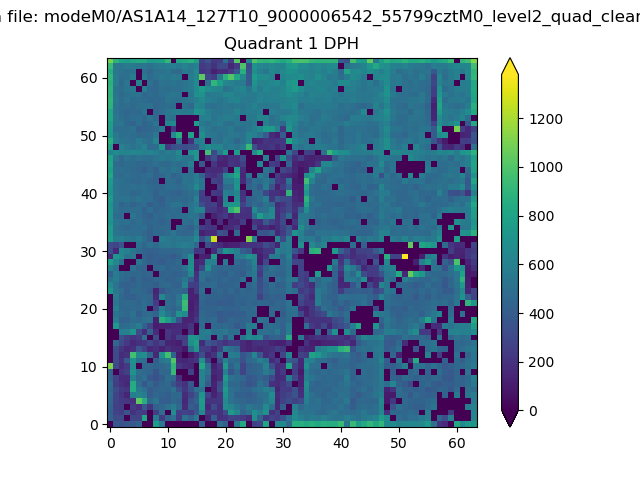 |
Quadrant B |
|---|---|---|---|
| Quadrant D | 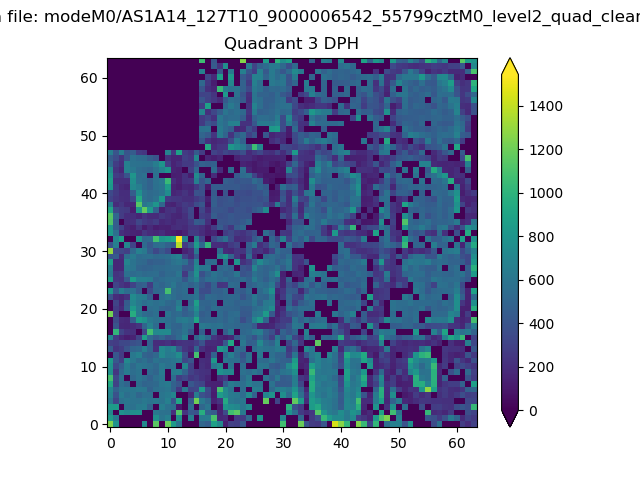 |
 |
Quadrant C |
| Plot type | Count rate plots | Images |
|---|---|---|
| Comparison with Poisson distribution Blue bars denote a histogram of data divided into 1 sec bins. Red curve is a Poisson curve with rate = median count rate of data. |
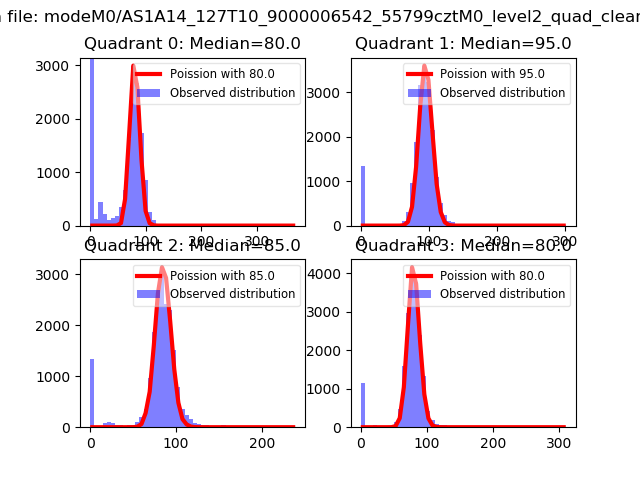 |
 |
| Quadrant-wise count rates Data is divided into 100 sec bins |
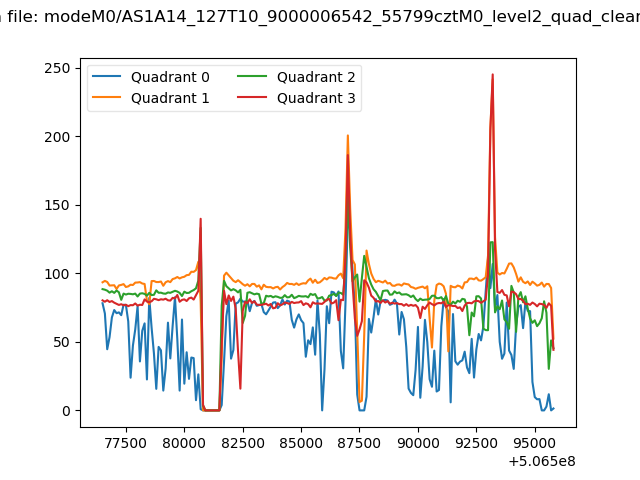 |
|
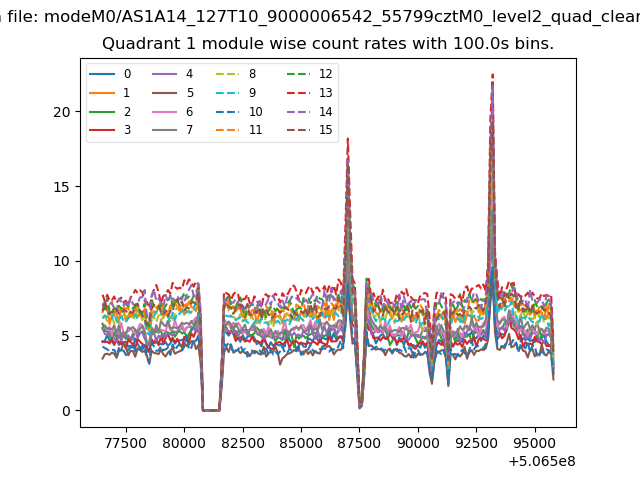
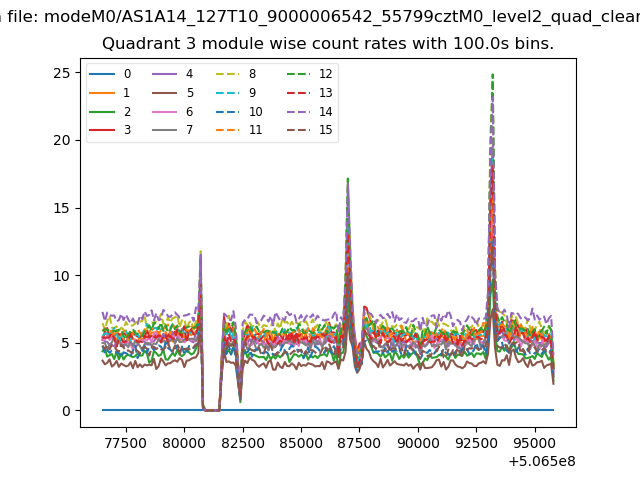
| Module-wise count rates for Quadrant A Data is divided into 100 sec bins |
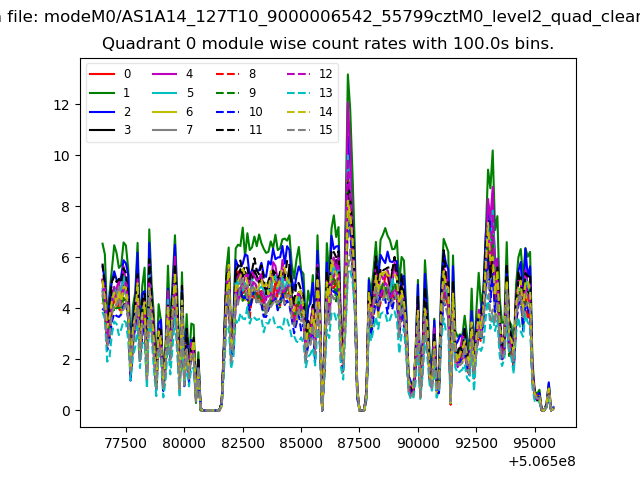 |
 |
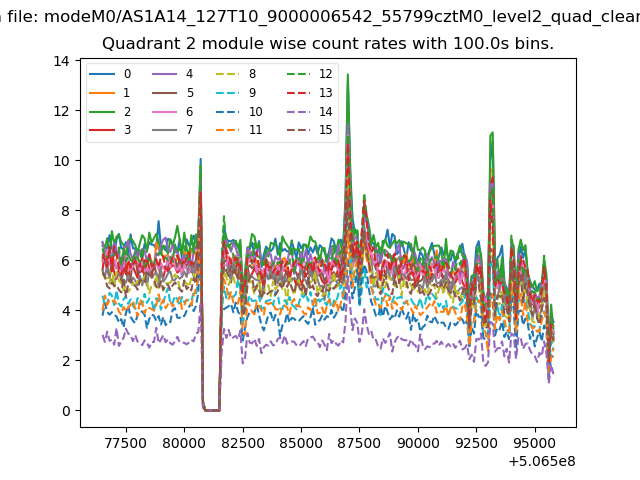
| Module-wise count rates for Quadrant B Data is divided into 100 sec bins |
 |
 |
| Module-wise count rates for Quadrant C Data is divided into 100 sec bins |
 |
 |
| Module-wise count rates for Quadrant D Data is divided into 100 sec bins |
 |
 |
| Parameter | Plot |
|---|---|
| CZT HV Monitor |  |
| D_VDD | 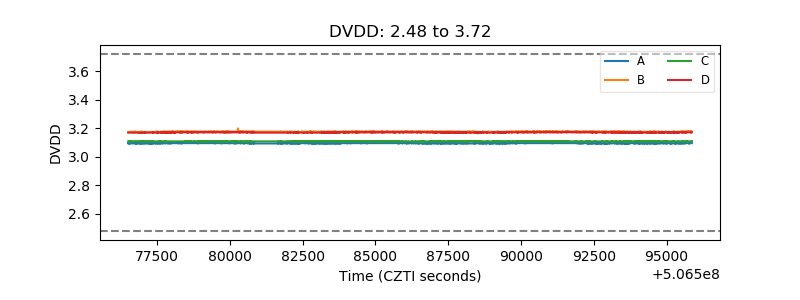 |
| Temperature 1 | 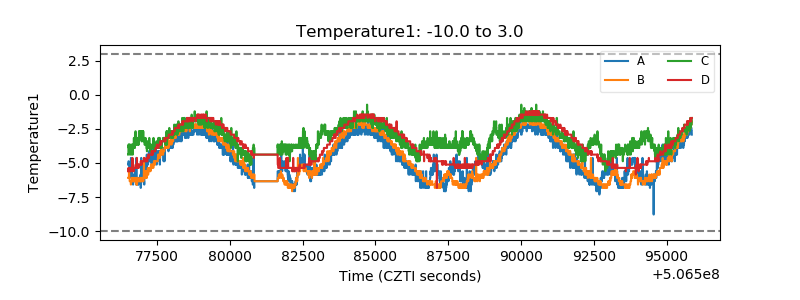 |
| Veto HV Monitor | 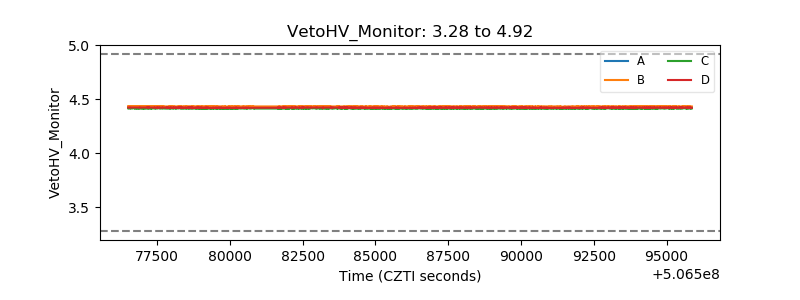 |
| Veto LLD | 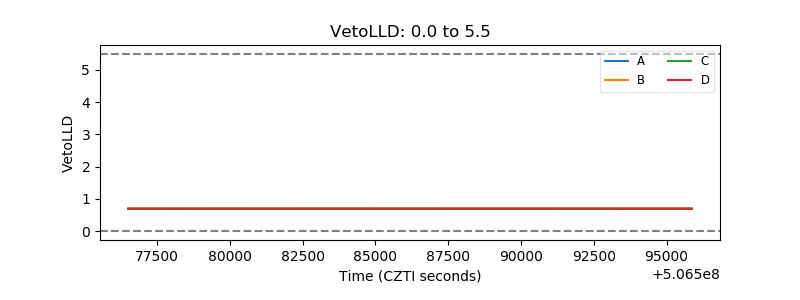 |
| Alpha Counter | 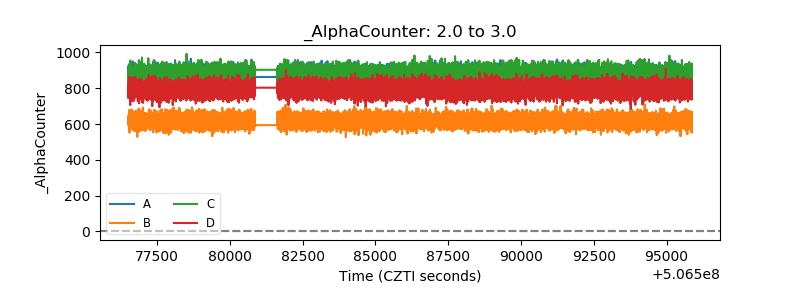 |
| _CPM_Rate | 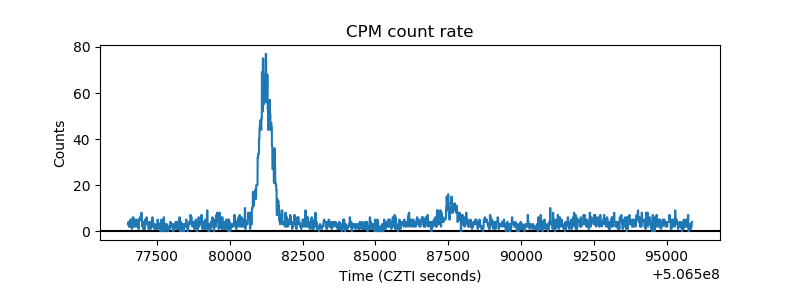 |
| CZT Counter | 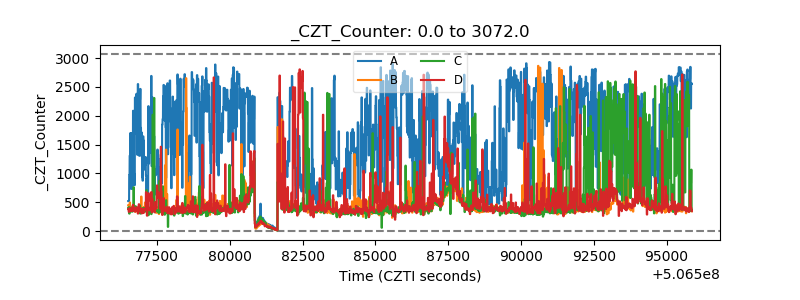 |
| +2.5 Volts monitor |  |
| +5 Volts monitor |  |
| _ROLL_ROT | 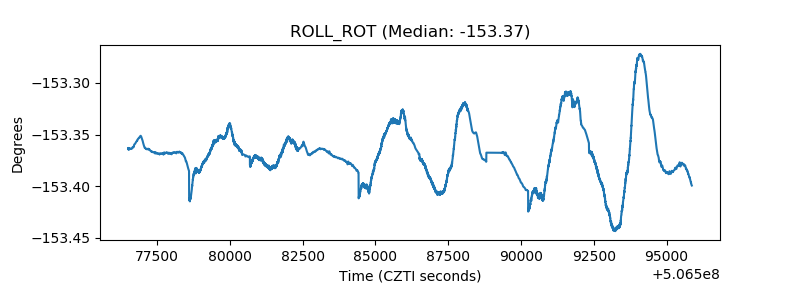 |
| _Roll_DEC | 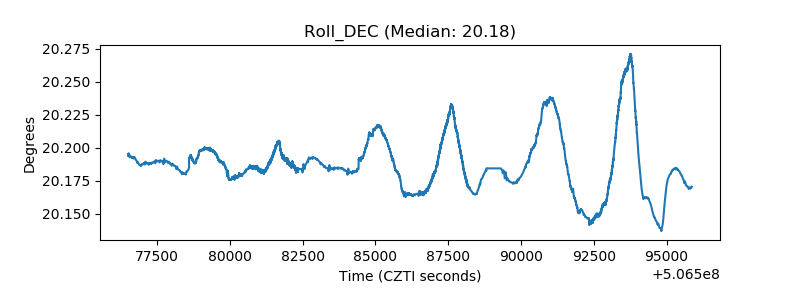 |
| _Roll_RA | 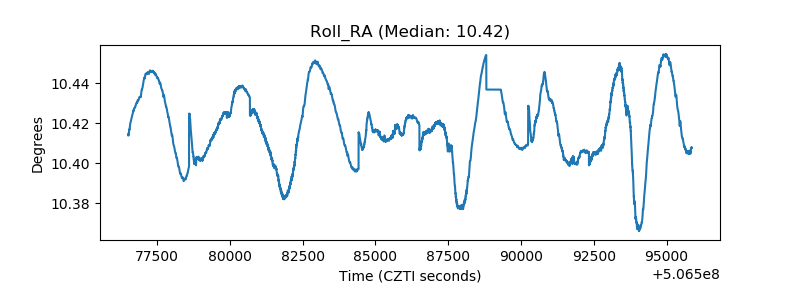 |
| Veto Counter | 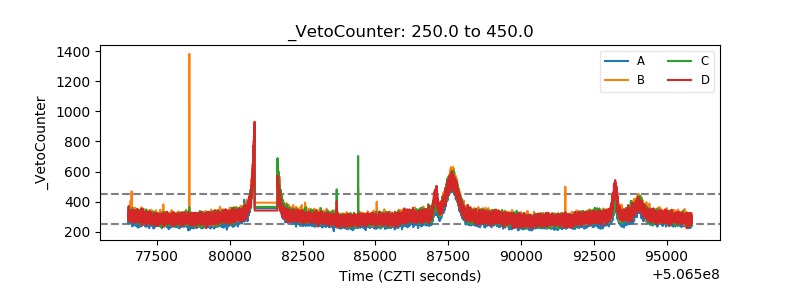 |