| Param | Original file | Final file |
|---|---|---|
| Filename | modeM0/AS1A14_127T10_9000006542_55800cztM0_level2.fits | modeM0/AS1A14_127T10_9000006542_55800cztM0_level2_quad_clean.evt |
| Size (bytes) | 609,140,160 | 94,389,120 |
| Size | 580.9 MB | 90.0 MB |
| Events in quadrant A | 9,755,591 | 454,205 |
| Events in quadrant B | 3,149,977 | 703,512 |
| Events in quadrant C | 5,218,816 | 589,568 |
| Events in quadrant D | 3,854,637 | 600,192 |
| Mode M0 | |||
|---|---|---|---|
| Quadrant | BADHDUFLAG | Total packets | Discarded packets |
| A | 0 | 33981 | 0 |
| B | 0 | 15316 | 0 |
| C | 0 | 21273 | 0 |
| D | 0 | 17051 | 0 |
| Mode SS | |||
|---|---|---|---|
| Quadrant | BADHDUFLAG | Total packets | Discarded packets |
| A | 0 | 148 | 0 |
| B | 0 | 148 | 0 |
| C | 0 | 148 | 0 |
| D | 0 | 148 | 0 |
| Quadrant | Total seconds | Saturated seconds | Saturation percentage |
|---|---|---|---|
| A | 7328 | 2436 | 33.242358% |
| B | 7329 | 19 | 0.259244% |
| C | 7329 | 648 | 8.841588% |
| D | 7329 | 57 | 0.777732% |
Noise dominated data is calculated using 1-second bins in cleaned event files. If a bin has >2000 counts, and if more than 50% of those come from <1% of pixels, then it is considered to be noise-dominated and hence unusable.
| Quadrant | # 1 sec bins | Bins with >0 counts | Bins with >2000 counts | High rate bins dominated by noise | Noise dominated (total time) | Noise dominated (detector-on time) | Marked lightcurve |
|---|---|---|---|---|---|---|---|
| A | 7328 | 7327 | 1961 | 1961 | 26.76% | 26.76% | 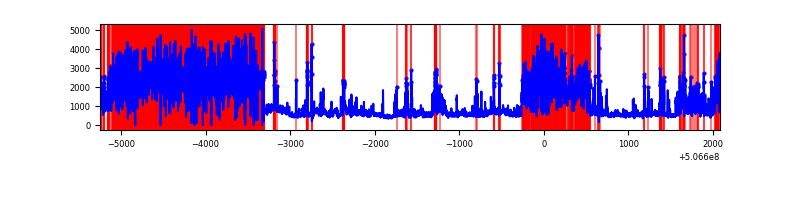 |
| B | 7329 | 7329 | 14 | 14 | 0.19% | 0.19% | 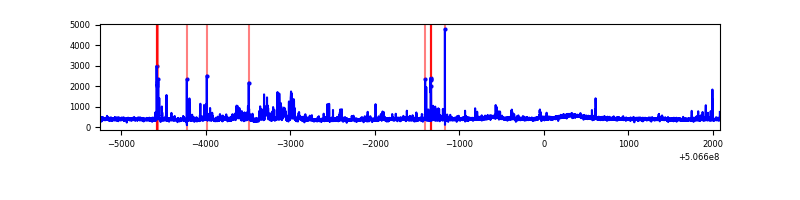 |
| C | 7329 | 7329 | 498 | 498 | 6.79% | 6.79% | 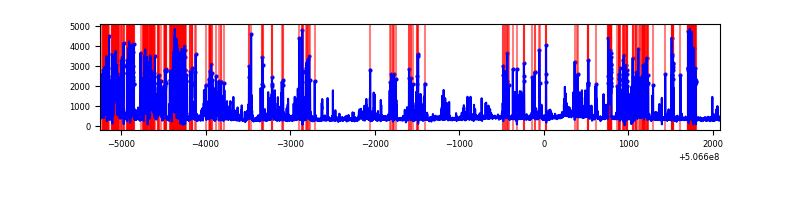 |
| D | 7329 | 7329 | 63 | 63 | 0.86% | 0.86% | 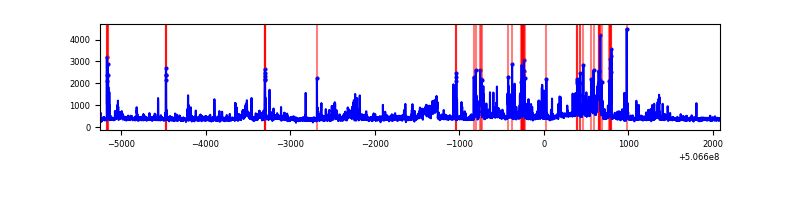 |
Top three noisy pixels from each quadrant. If the there are fewer than three noisy pixels in the level2.evt file, extra rows are filled as -1
| Pixel properties | Quadrant properties | ||||||
|---|---|---|---|---|---|---|---|
| Quadrant | DetID | PixID | Counts | Sigma | Mean | Median | Sigma |
| A | 15 | 32 | 6097097 | 42346.52 | 571 | 558 | 144.0 |
| A | 7 | 64 | 482781 | 3349.52 | 571 | 558 | 144.0 |
| A | 12 | 115 | 354058 | 2455.41 | 571 | 558 | 144.0 |
| B | 4 | 206 | 142686 | 929.1 | 696 | 671 | 152.9 |
| B | 0 | 213 | 112533 | 731.83 | 696 | 671 | 152.9 |
| B | 5 | 172 | 65872 | 426.56 | 696 | 671 | 152.9 |
| C | 13 | 3 | 2529624 | 13855.02 | 654 | 648 | 182.5 |
| C | 14 | 254 | 48400 | 261.61 | 654 | 648 | 182.5 |
| C | 6 | 223 | 26784 | 143.19 | 654 | 648 | 182.5 |
| D | 8 | 245 | 475616 | 2402.96 | 688 | 658 | 197.7 |
| D | 11 | 129 | 202148 | 1019.4 | 688 | 658 | 197.7 |
| D | 7 | 70 | 186011 | 937.76 | 688 | 658 | 197.7 |
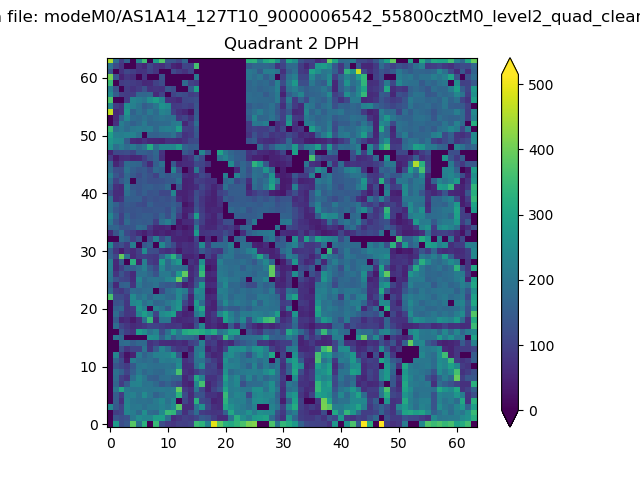
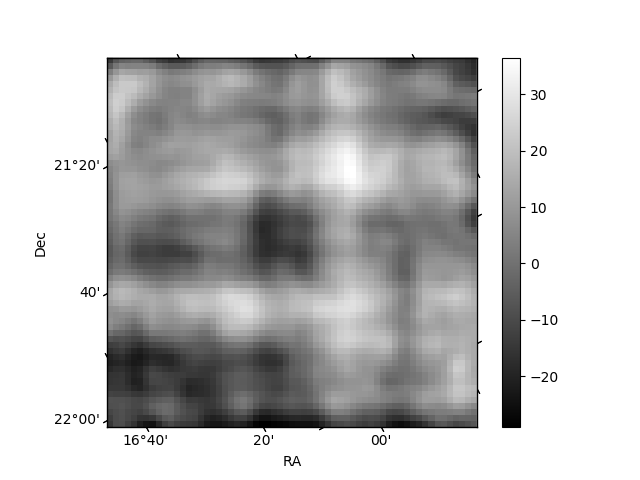
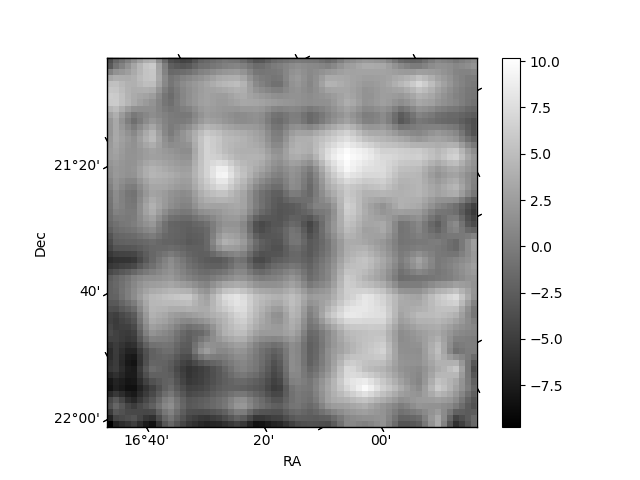
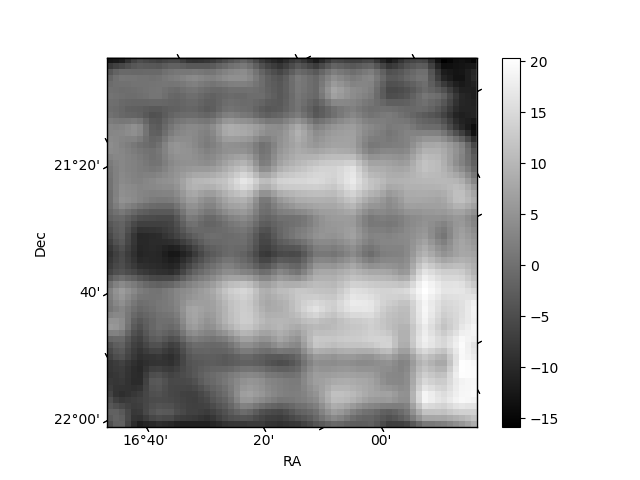
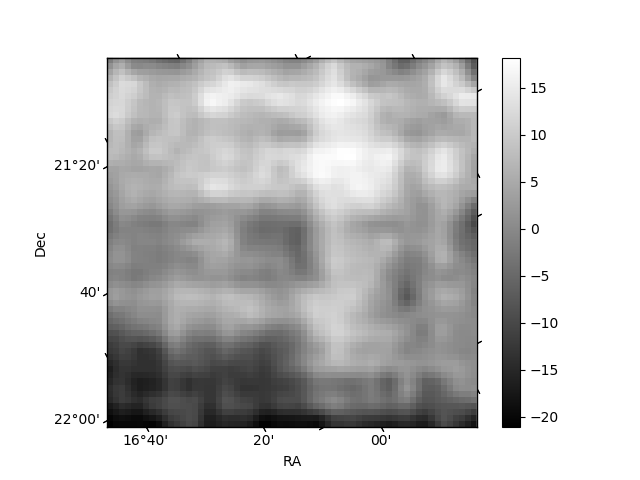
Histogram calculated using DETX and DETY for each event in the final _common_clean file
| Quadrant A | 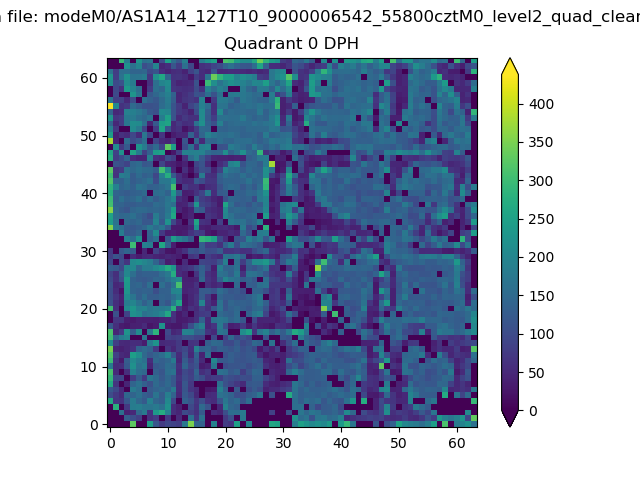 |
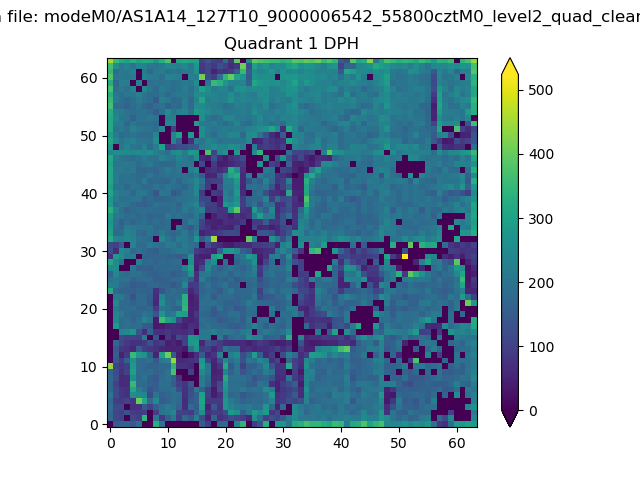 |
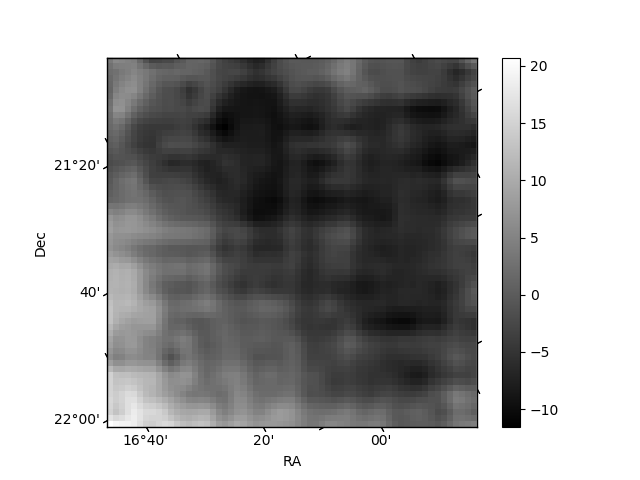
Quadrant B |
|---|---|---|---|
| Quadrant D | 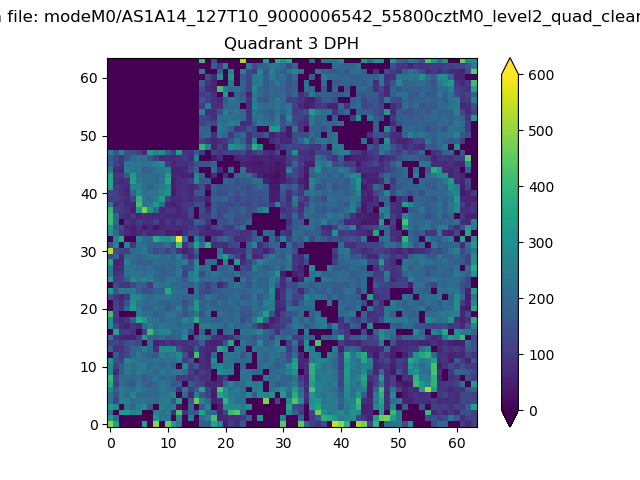 |
 |
Quadrant C |
| Plot type | Count rate plots | Images |
|---|---|---|
| Comparison with Poisson distribution Blue bars denote a histogram of data divided into 1 sec bins. Red curve is a Poisson curve with rate = median count rate of data. |
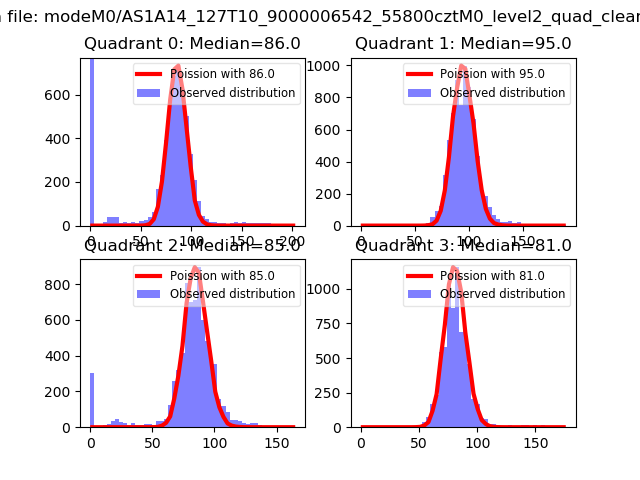 |
 |
| Quadrant-wise count rates Data is divided into 100 sec bins |
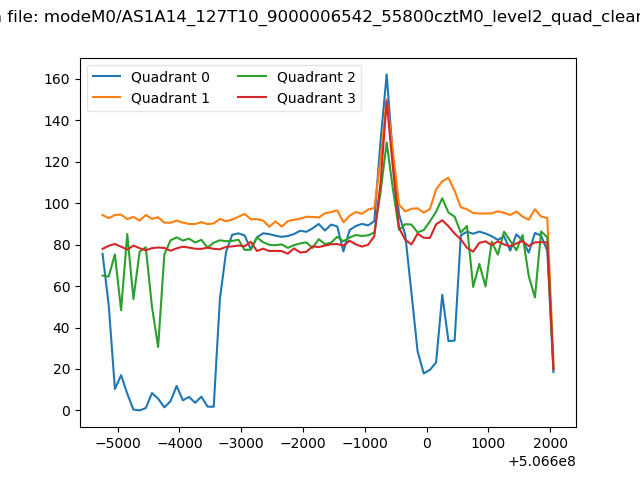 |
|
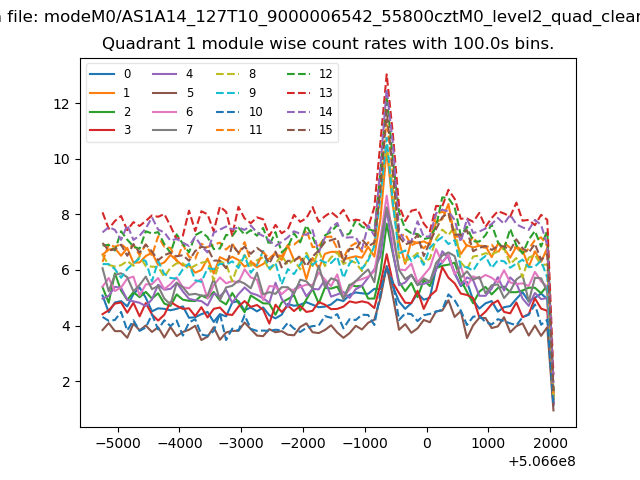
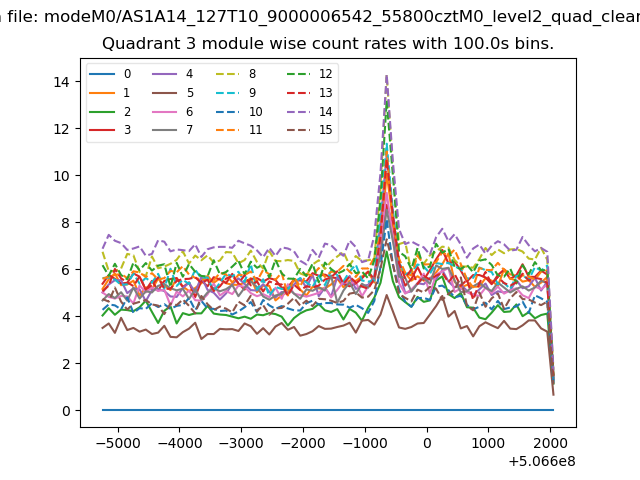
| Module-wise count rates for Quadrant A Data is divided into 100 sec bins |
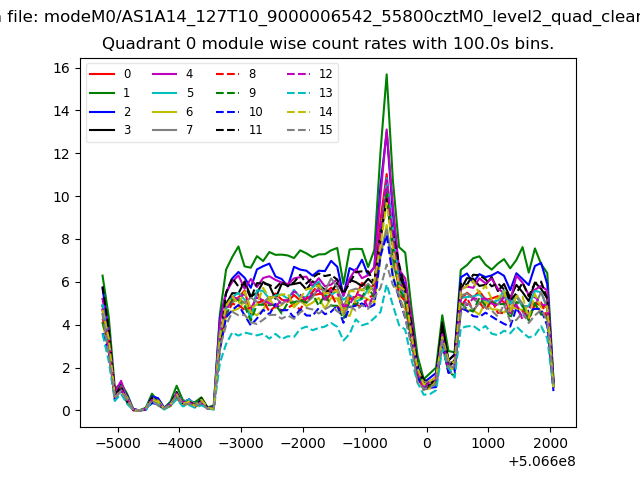 |
 |
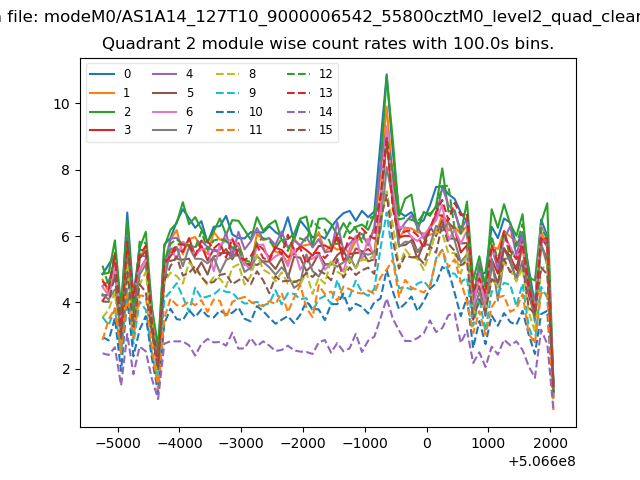
| Module-wise count rates for Quadrant B Data is divided into 100 sec bins |
 |
 |
| Module-wise count rates for Quadrant C Data is divided into 100 sec bins |
 |
 |
| Module-wise count rates for Quadrant D Data is divided into 100 sec bins |
 |
 |
| Parameter | Plot |
|---|---|
| CZT HV Monitor |  |
| D_VDD | 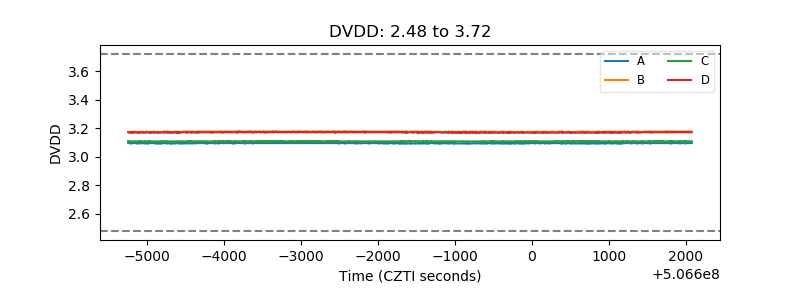 |
| Temperature 1 | 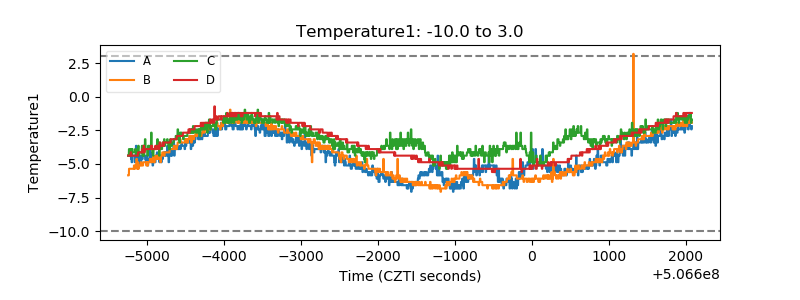 |
| Veto HV Monitor | 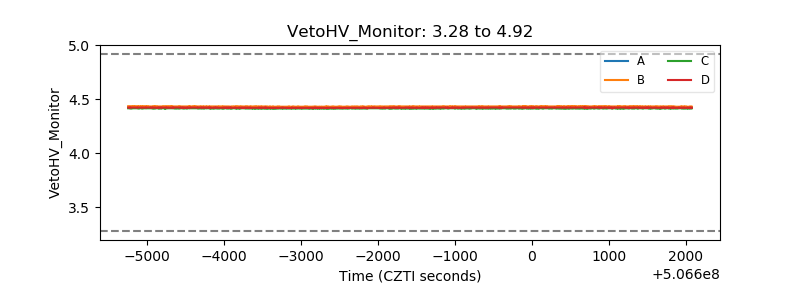 |
| Veto LLD | 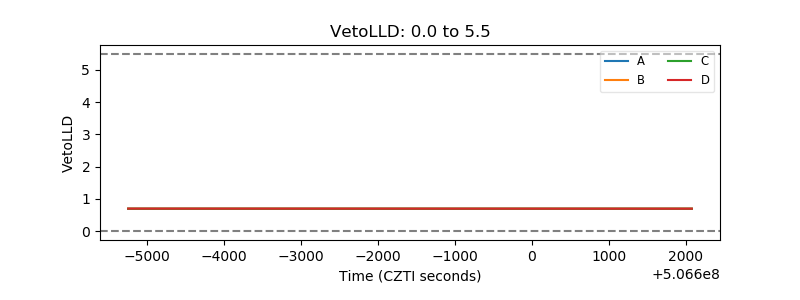 |
| Alpha Counter | 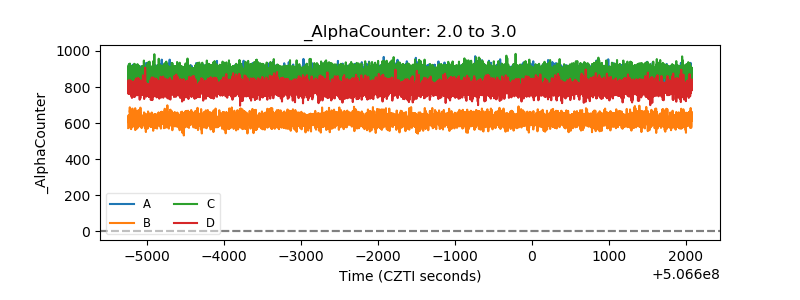 |
| _CPM_Rate | 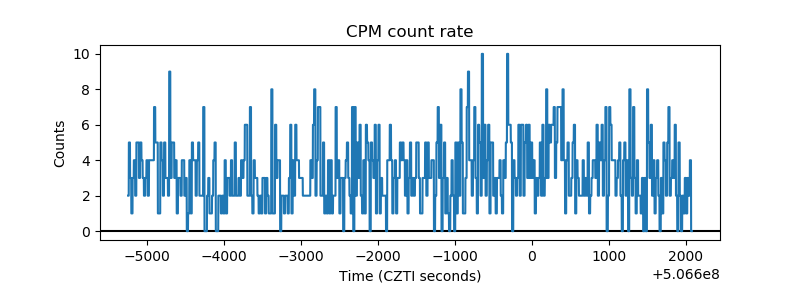 |
| CZT Counter | 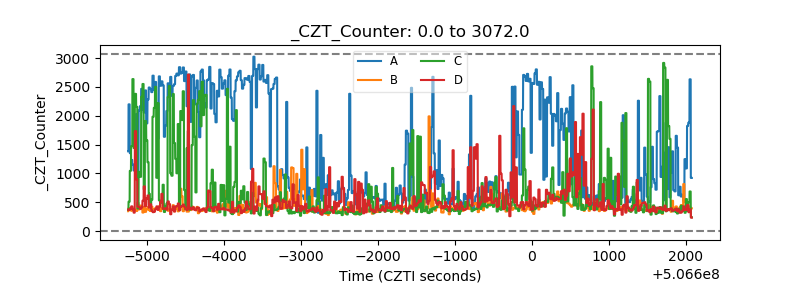 |
| +2.5 Volts monitor |  |
| +5 Volts monitor |  |
| _ROLL_ROT | 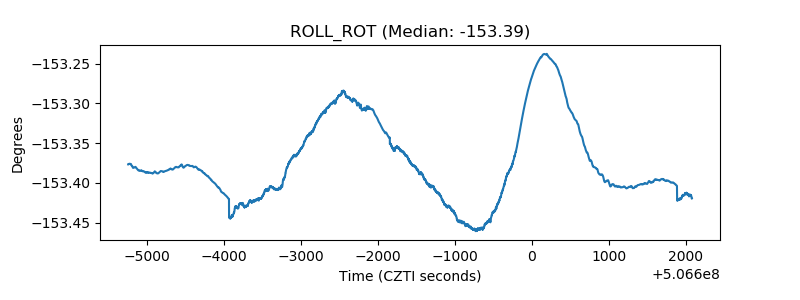 |
| _Roll_DEC | 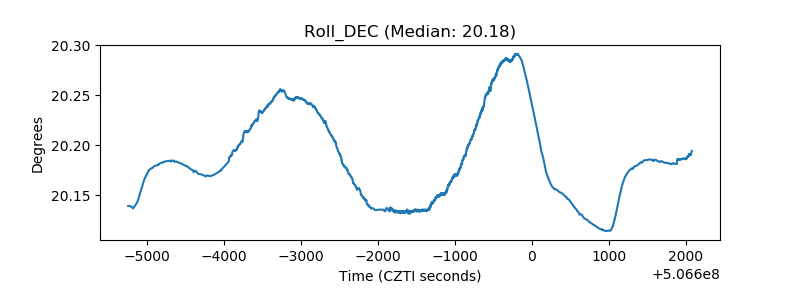 |
| _Roll_RA | 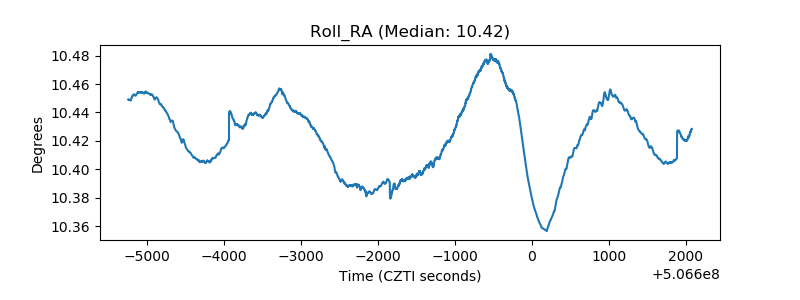 |
| Veto Counter | 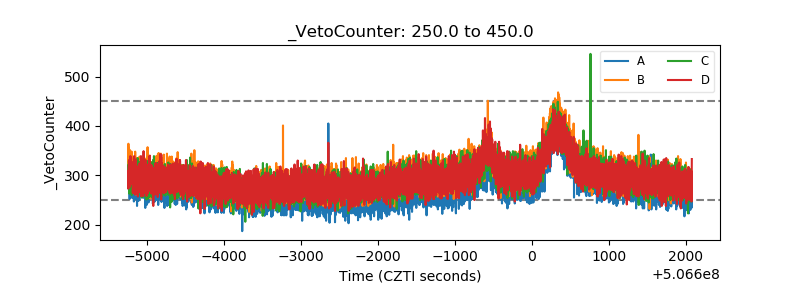 |