| Param | Original file | Final file |
|---|---|---|
| Filename | modeM0/AS1A14_127T10_9000006542_55803cztM0_level2.fits | modeM0/AS1A14_127T10_9000006542_55803cztM0_level2_quad_clean.evt |
| Size (bytes) | 1,405,704,960 | 268,318,080 |
| Size | 1.3 GB | 255.9 MB |
| Events in quadrant A | 17,347,336 | 1,731,633 |
| Events in quadrant B | 11,833,328 | 1,733,307 |
| Events in quadrant C | 8,721,625 | 1,729,865 |
| Events in quadrant D | 12,654,813 | 1,614,463 |
| Mode M0 | |||
|---|---|---|---|
| Quadrant | BADHDUFLAG | Total packets | Discarded packets |
| A | 0 | 64664 | 2 |
| B | 0 | 50760 | 2 |
| C | 0 | 42418 | 2 |
| D | 0 | 52177 | 2 |
| Mode M9 | |||
|---|---|---|---|
| Quadrant | BADHDUFLAG | Total packets | Discarded packets |
| A | 0 | 8 | 0 |
| B | 0 | 8 | 0 |
| C | 0 | 8 | 0 |
| D | 0 | 8 | 0 |
| Mode SS | |||
|---|---|---|---|
| Quadrant | BADHDUFLAG | Total packets | Discarded packets |
| A | 0 | 386 | 0 |
| B | 0 | 386 | 0 |
| C | 0 | 386 | 0 |
| D | 0 | 386 | 0 |
| Quadrant | Total seconds | Saturated seconds | Saturation percentage |
|---|---|---|---|
| A | 19093 | 1801 | 9.432776% |
| B | 19092 | 1616 | 8.464278% |
| C | 19092 | 359 | 1.880369% |
| D | 19092 | 1137 | 5.955374% |
Noise dominated data is calculated using 1-second bins in cleaned event files. If a bin has >2000 counts, and if more than 50% of those come from <1% of pixels, then it is considered to be noise-dominated and hence unusable.
| Quadrant | # 1 sec bins | Bins with >0 counts | Bins with >2000 counts | High rate bins dominated by noise | Noise dominated (total time) | Noise dominated (detector-on time) | Marked lightcurve |
|---|---|---|---|---|---|---|---|
| A | 19818 | 19096 | 1748 | 1748 | 8.82% | 9.15% | 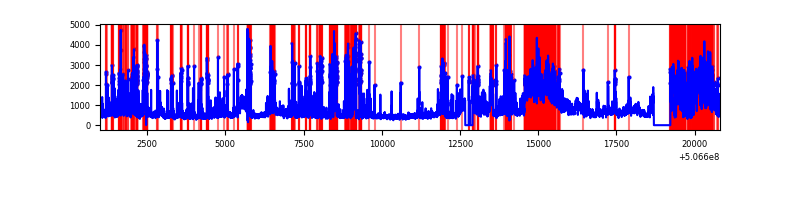 |
| B | 19817 | 19094 | 1283 | 1283 | 6.47% | 6.72% | 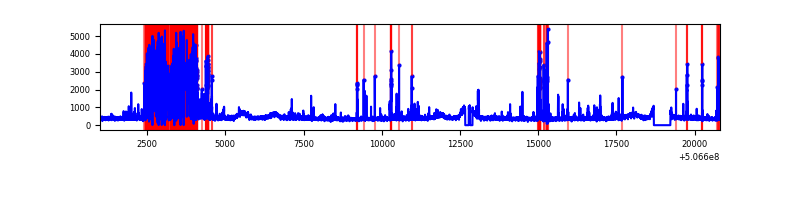 |
| C | 19817 | 19095 | 230 | 230 | 1.16% | 1.20% | 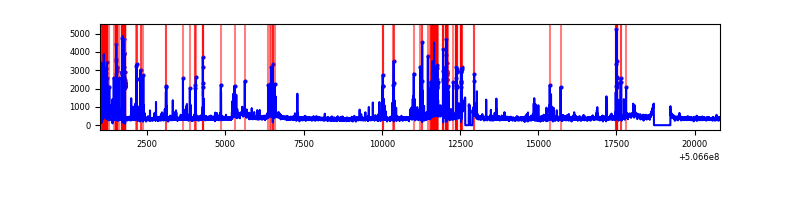 |
| D | 19817 | 19095 | 996 | 996 | 5.03% | 5.22% | 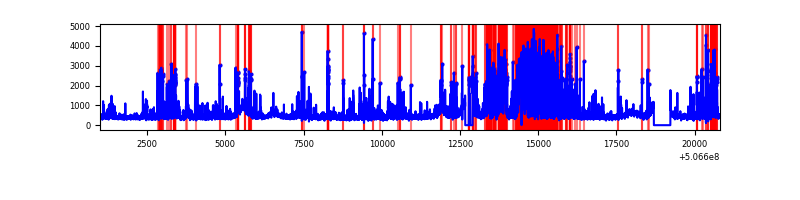 |
Top three noisy pixels from each quadrant. If the there are fewer than three noisy pixels in the level2.evt file, extra rows are filled as -1
| Pixel properties | Quadrant properties | ||||||
|---|---|---|---|---|---|---|---|
| Quadrant | DetID | PixID | Counts | Sigma | Mean | Median | Sigma |
| A | 12 | 115 | 3418162 | 7112.61 | 1874 | 1830 | 480.3 |
| A | 15 | 32 | 2643931 | 5500.71 | 1874 | 1830 | 480.3 |
| A | 0 | 8 | 1378783 | 2866.74 | 1874 | 1830 | 480.3 |
| B | 4 | 206 | 3991228 | 10072.29 | 1814 | 1749 | 396.1 |
| B | 0 | 153 | 206293 | 516.41 | 1814 | 1749 | 396.1 |
| B | 0 | 213 | 162758 | 406.5 | 1814 | 1749 | 396.1 |
| C | 13 | 3 | 765911 | 1481.69 | 1850 | 1836 | 515.7 |
| C | 6 | 223 | 261435 | 503.41 | 1850 | 1836 | 515.7 |
| C | 15 | 147 | 229236 | 440.97 | 1850 | 1836 | 515.7 |
| D | 11 | 129 | 3043330 | 5682.74 | 1841 | 1761 | 535.2 |
| D | 7 | 96 | 439639 | 818.11 | 1841 | 1761 | 535.2 |
| D | 8 | 245 | 372828 | 693.29 | 1841 | 1761 | 535.2 |
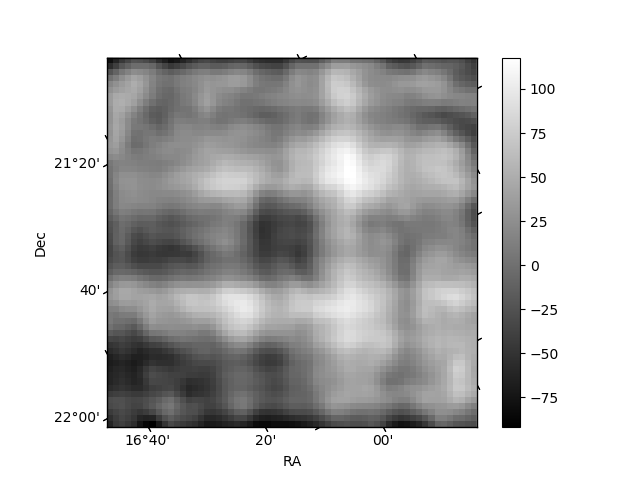
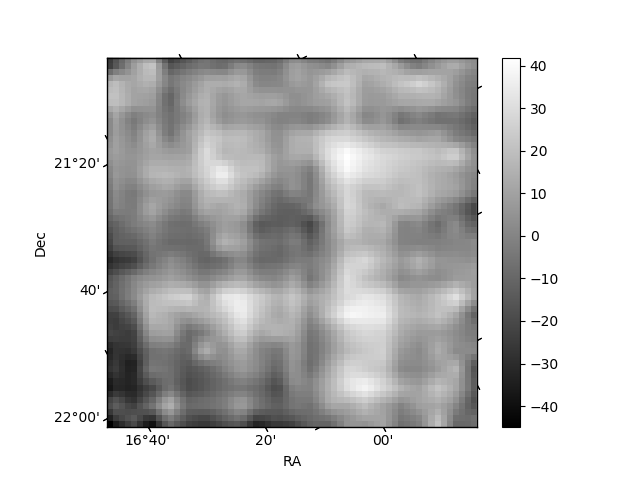
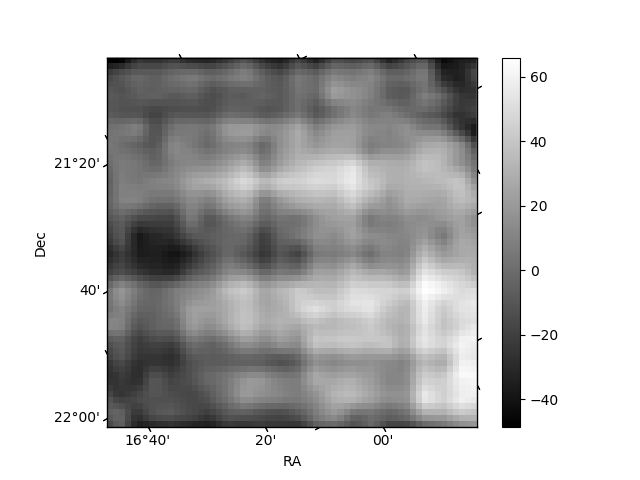
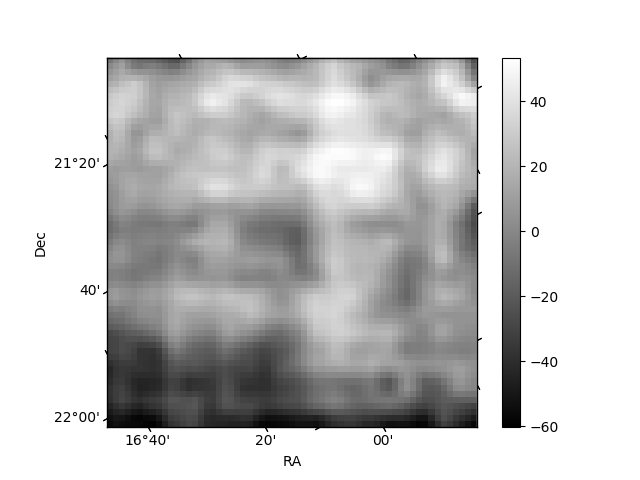
Histogram calculated using DETX and DETY for each event in the final _common_clean file
| Quadrant A | 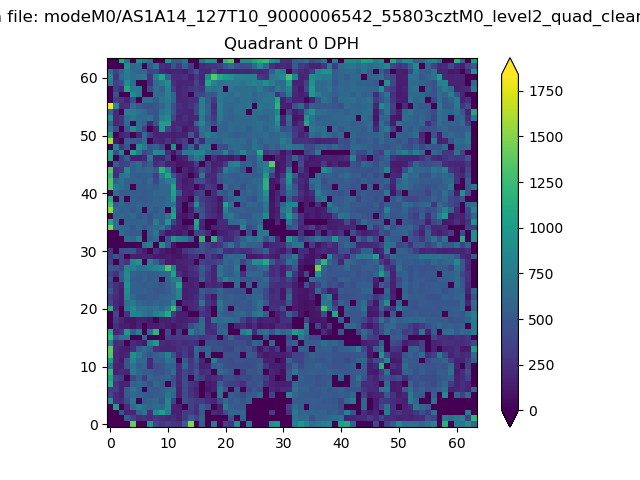 |
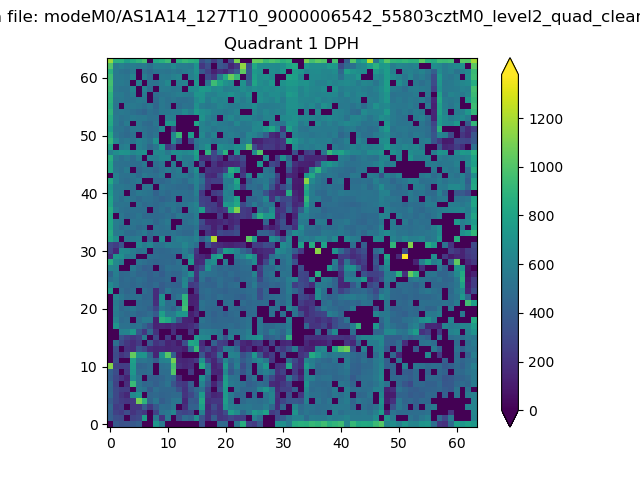 |
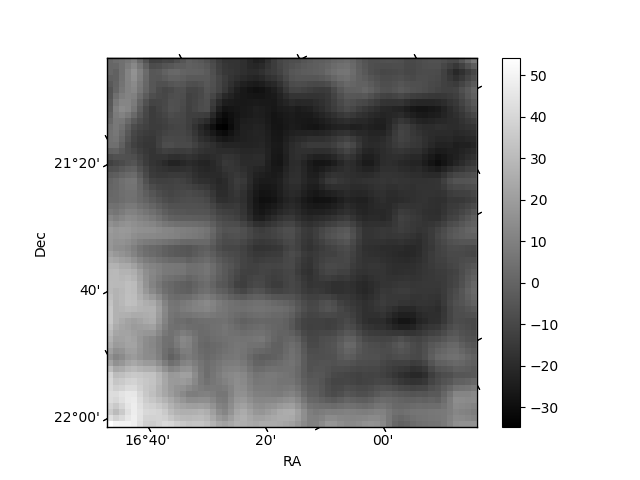
Quadrant B |
|---|---|---|---|
| Quadrant D | 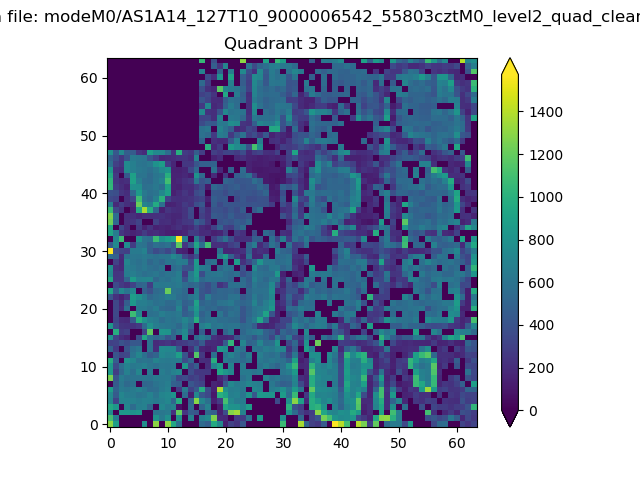 |
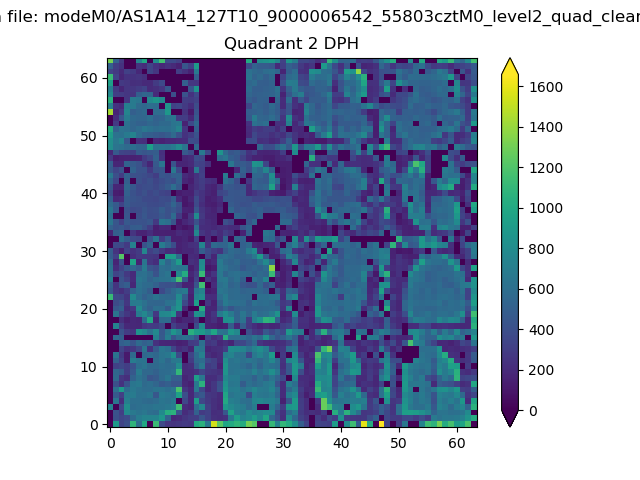 |
Quadrant C |
| Plot type | Count rate plots | Images |
|---|---|---|
| Comparison with Poisson distribution Blue bars denote a histogram of data divided into 1 sec bins. Red curve is a Poisson curve with rate = median count rate of data. |
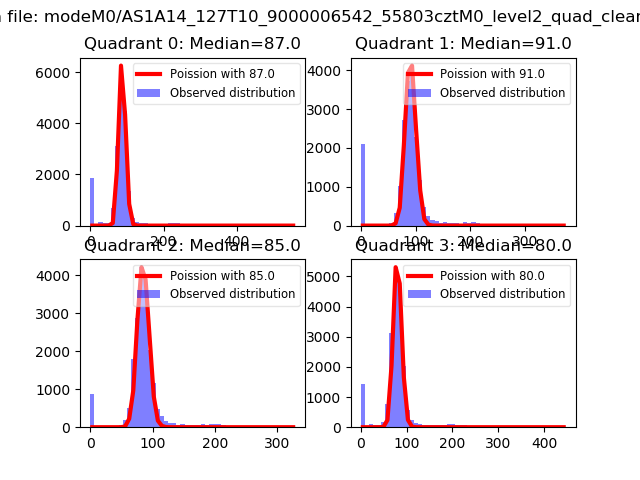 |
 |
| Quadrant-wise count rates Data is divided into 100 sec bins |
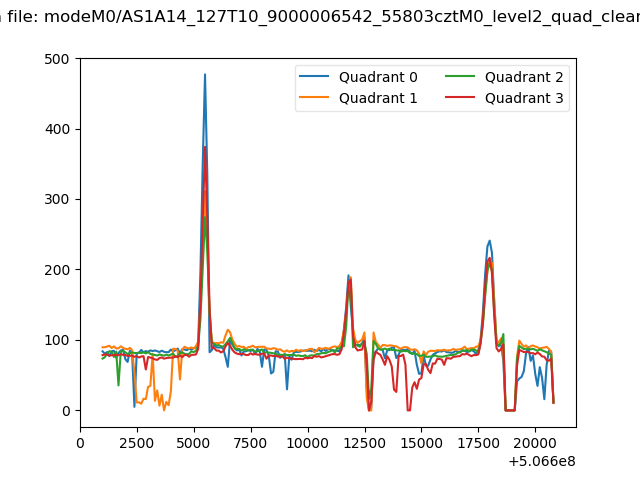 |
|
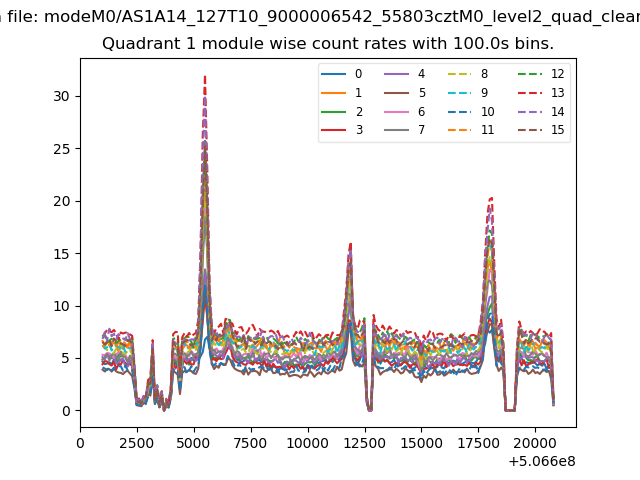
| Module-wise count rates for Quadrant A Data is divided into 100 sec bins |
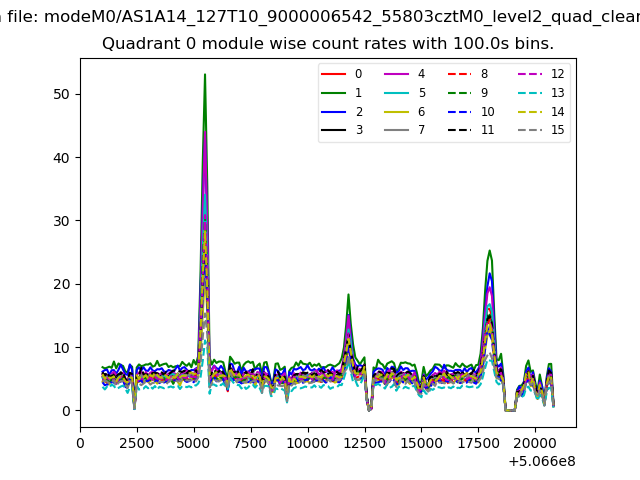 |
 |
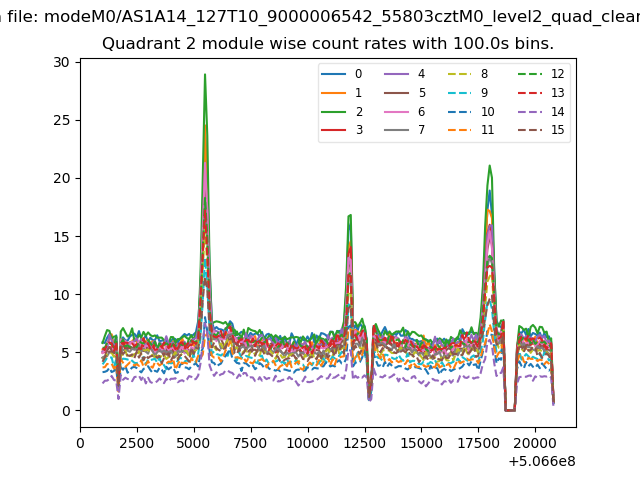
| Module-wise count rates for Quadrant B Data is divided into 100 sec bins |
 |
 |
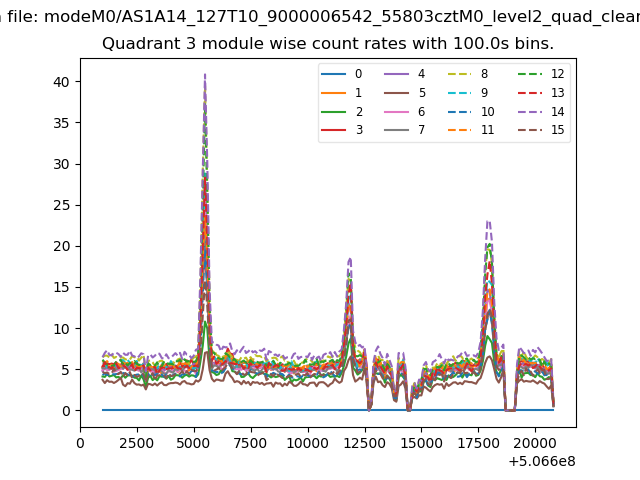
| Module-wise count rates for Quadrant C Data is divided into 100 sec bins |
 |
 |
| Module-wise count rates for Quadrant D Data is divided into 100 sec bins |
 |
 |
| Parameter | Plot |
|---|---|
| CZT HV Monitor | 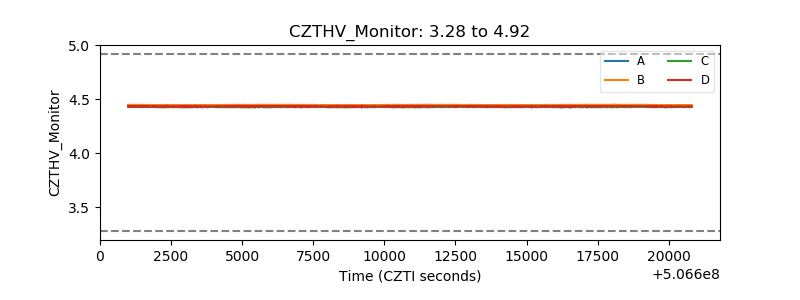 |
| D_VDD | 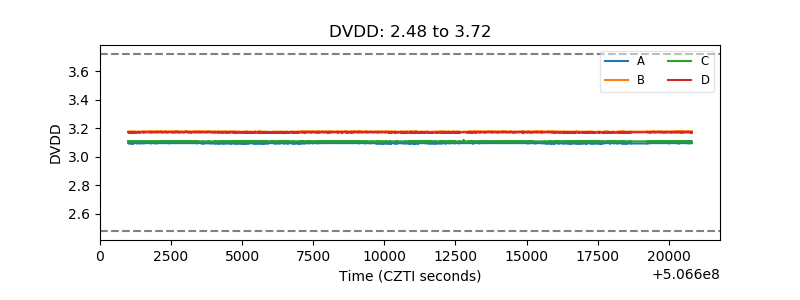 |
| Temperature 1 | 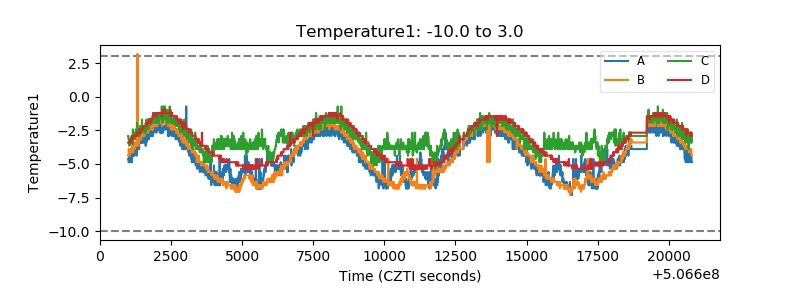 |
| Veto HV Monitor | 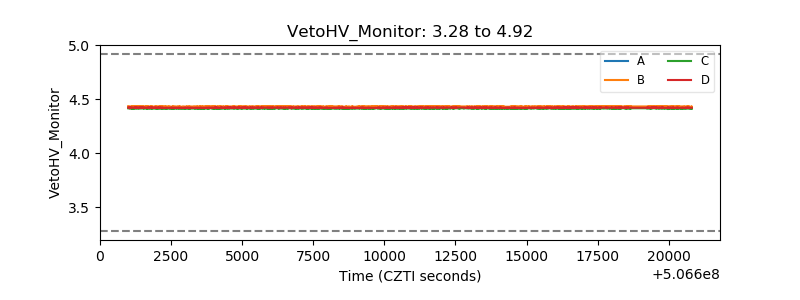 |
| Veto LLD | 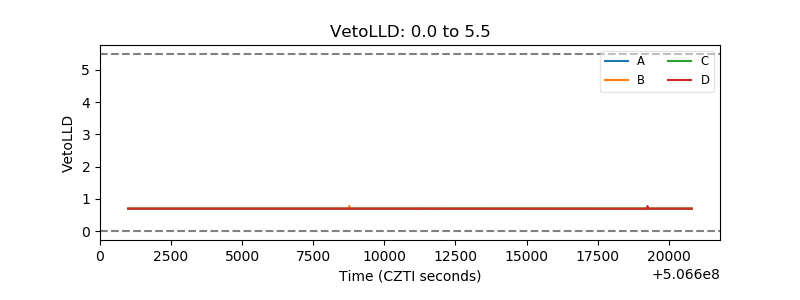 |
| Alpha Counter | 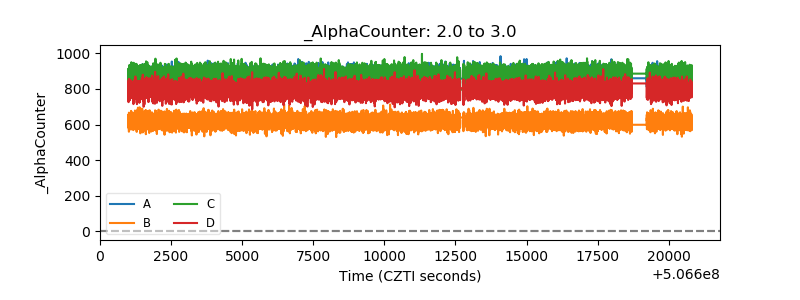 |
| _CPM_Rate | 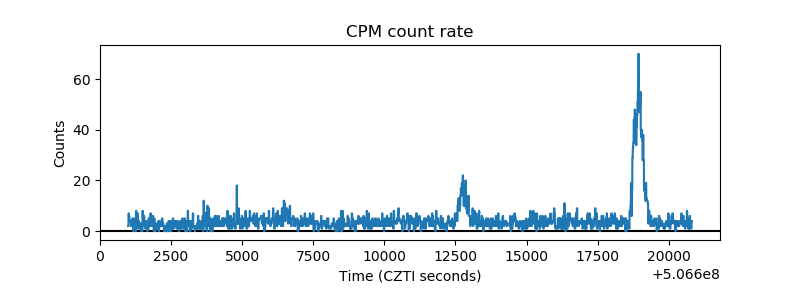 |
| CZT Counter | 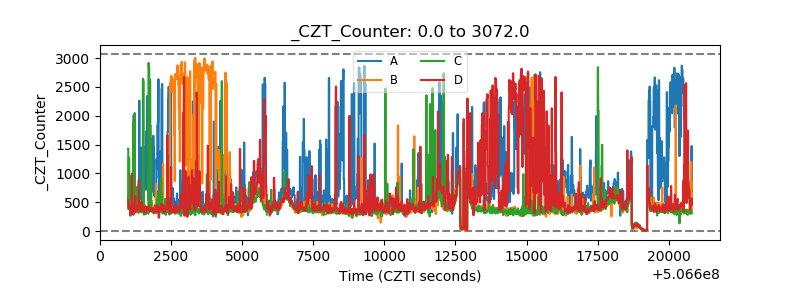 |
| +2.5 Volts monitor |  |
| +5 Volts monitor |  |
| _ROLL_ROT | 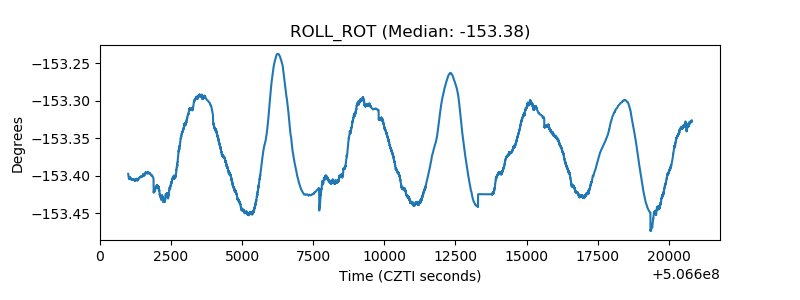 |
| _Roll_DEC | 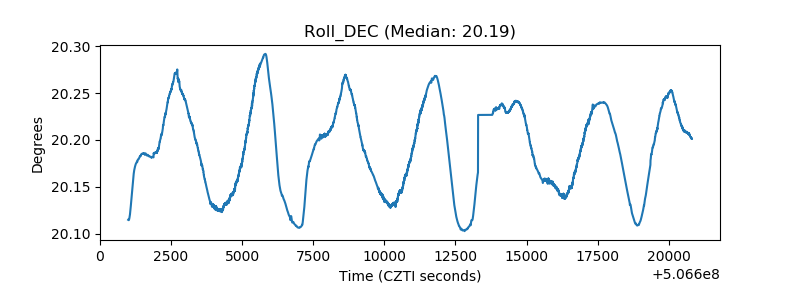 |
| _Roll_RA | 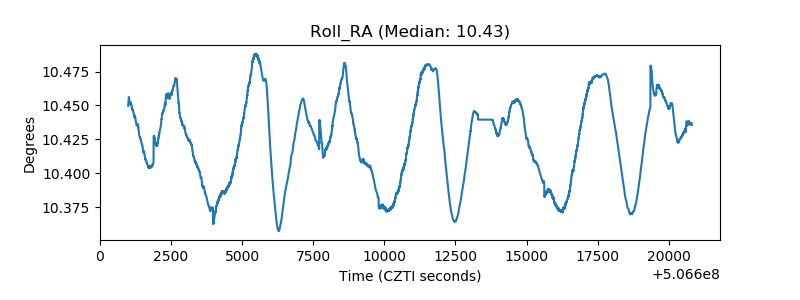 |
| Veto Counter | 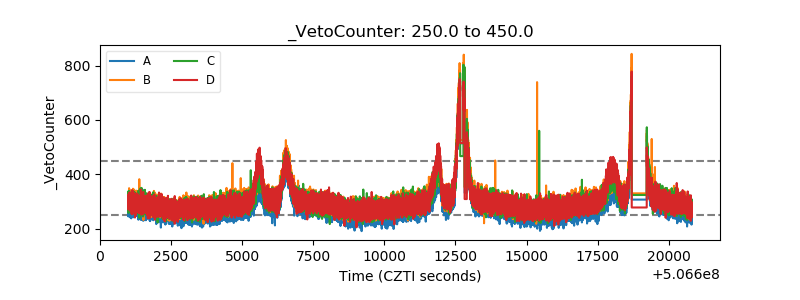 |