| Param | Original file | Final file |
|---|---|---|
| Filename | modeM0/AS1A14_127T10_9000006542_55805cztM0_level2.fits | modeM0/AS1A14_127T10_9000006542_55805cztM0_level2_quad_clean.evt |
| Size (bytes) | 546,197,760 | 108,826,560 |
| Size | 520.9 MB | 103.8 MB |
| Events in quadrant A | 8,434,376 | 646,786 |
| Events in quadrant B | 3,057,894 | 795,770 |
| Events in quadrant C | 3,544,233 | 701,068 |
| Events in quadrant D | 4,649,770 | 674,345 |
| Mode M0 | |||
|---|---|---|---|
| Quadrant | BADHDUFLAG | Total packets | Discarded packets |
| A | 0 | 29872 | 2 |
| B | 0 | 14818 | 2 |
| C | 0 | 16221 | 3 |
| D | 0 | 18896 | 2 |
| Mode M9 | |||
|---|---|---|---|
| Quadrant | BADHDUFLAG | Total packets | Discarded packets |
| A | 0 | 16 | 0 |
| B | 0 | 17 | 0 |
| C | 0 | 17 | 0 |
| D | 0 | 17 | 0 |
| Mode SS | |||
|---|---|---|---|
| Quadrant | BADHDUFLAG | Total packets | Discarded packets |
| A | 0 | 138 | 0 |
| B | 0 | 140 | 0 |
| C | 0 | 140 | 0 |
| D | 0 | 140 | 0 |
| Quadrant | Total seconds | Saturated seconds | Saturation percentage |
|---|---|---|---|
| A | 6855 | 1330 | 19.401896% |
| B | 6855 | 55 | 0.802334% |
| C | 6854 | 181 | 2.640794% |
| D | 6854 | 329 | 4.800117% |
Noise dominated data is calculated using 1-second bins in cleaned event files. If a bin has >2000 counts, and if more than 50% of those come from <1% of pixels, then it is considered to be noise-dominated and hence unusable.
| Quadrant | # 1 sec bins | Bins with >0 counts | Bins with >2000 counts | High rate bins dominated by noise | Noise dominated (total time) | Noise dominated (detector-on time) | Marked lightcurve |
|---|---|---|---|---|---|---|---|
| A | 7810 | 6856 | 1313 | 1313 | 16.81% | 19.15% | 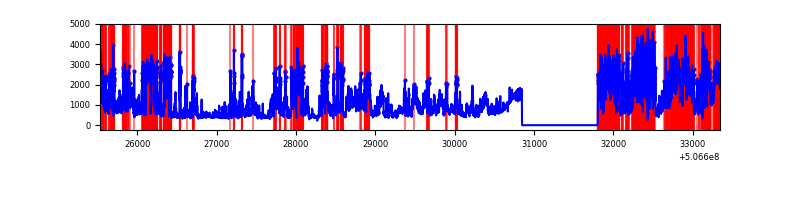 |
| B | 7810 | 6856 | 17 | 17 | 0.22% | 0.25% | 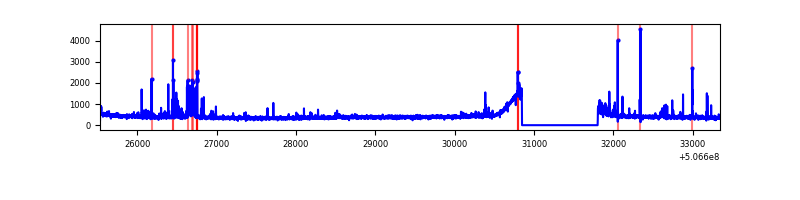 |
| C | 7809 | 6855 | 121 | 121 | 1.55% | 1.77% | 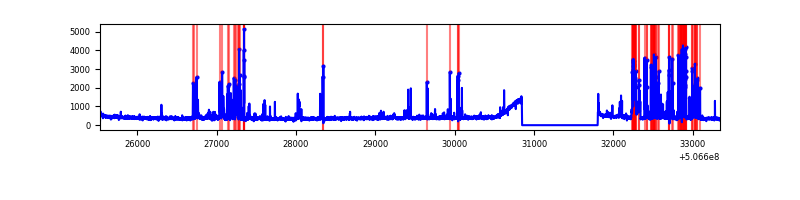 |
| D | 7809 | 6855 | 340 | 340 | 4.35% | 4.96% | 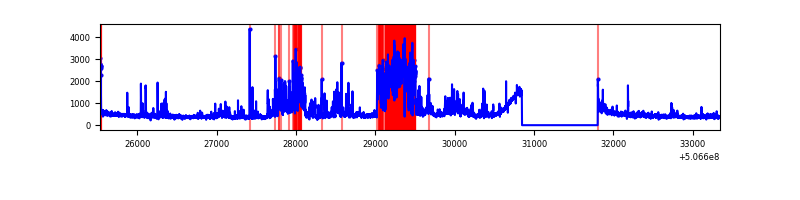 |
Top three noisy pixels from each quadrant. If the there are fewer than three noisy pixels in the level2.evt file, extra rows are filled as -1
| Pixel properties | Quadrant properties | ||||||
|---|---|---|---|---|---|---|---|
| Quadrant | DetID | PixID | Counts | Sigma | Mean | Median | Sigma |
| A | 12 | 115 | 3173703 | 17778.66 | 670 | 654 | 178.5 |
| A | 15 | 32 | 1796908 | 10064.45 | 670 | 654 | 178.5 |
| A | 7 | 64 | 273253 | 1527.38 | 670 | 654 | 178.5 |
| B | 0 | 153 | 84915 | 537.65 | 706 | 683 | 156.7 |
| B | 10 | 247 | 65627 | 414.54 | 706 | 683 | 156.7 |
| B | 0 | 213 | 59371 | 374.6 | 706 | 683 | 156.7 |
| C | 13 | 3 | 706420 | 3586.44 | 687 | 679 | 196.8 |
| C | 6 | 223 | 97700 | 493.04 | 687 | 679 | 196.8 |
| C | 12 | 252 | 24785 | 122.5 | 687 | 679 | 196.8 |
| D | 7 | 70 | 1463835 | 7059.09 | 695 | 662 | 207.3 |
| D | 3 | 12 | 135222 | 649.19 | 695 | 662 | 207.3 |
| D | 8 | 245 | 86640 | 414.8 | 695 | 662 | 207.3 |
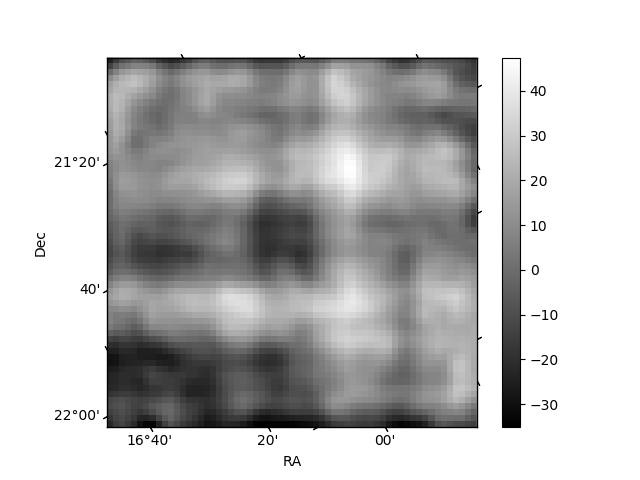
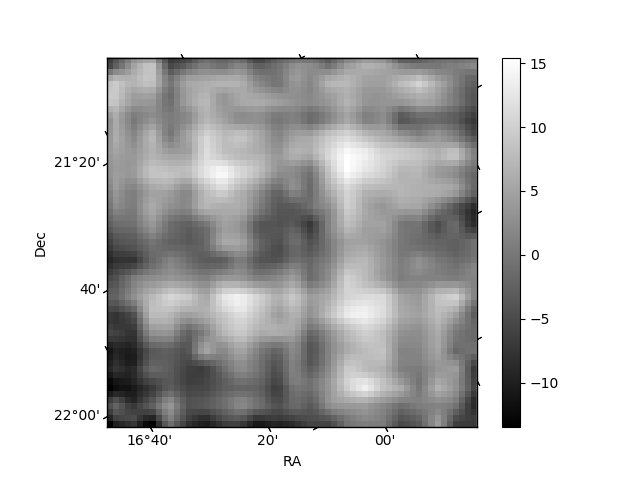
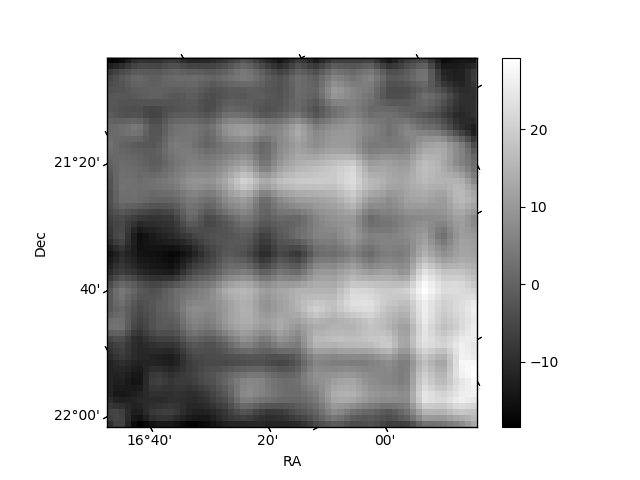
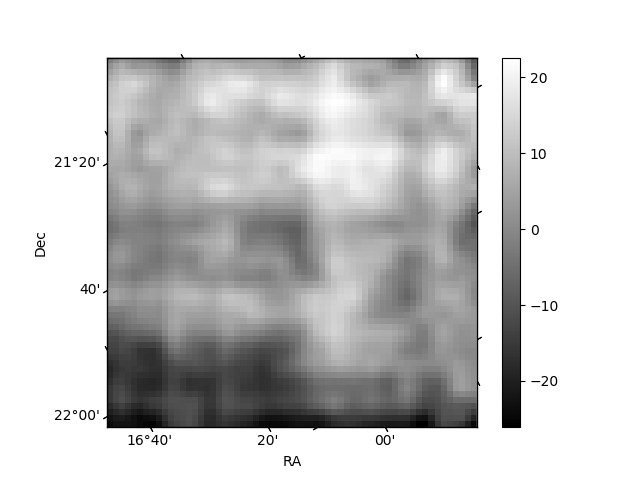
Histogram calculated using DETX and DETY for each event in the final _common_clean file
| Quadrant A | 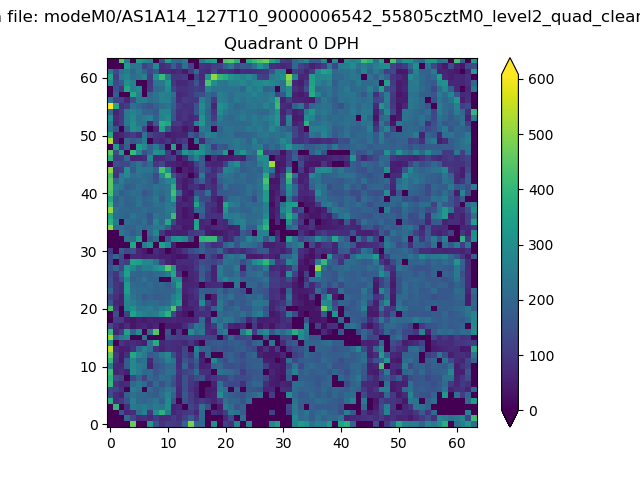 |
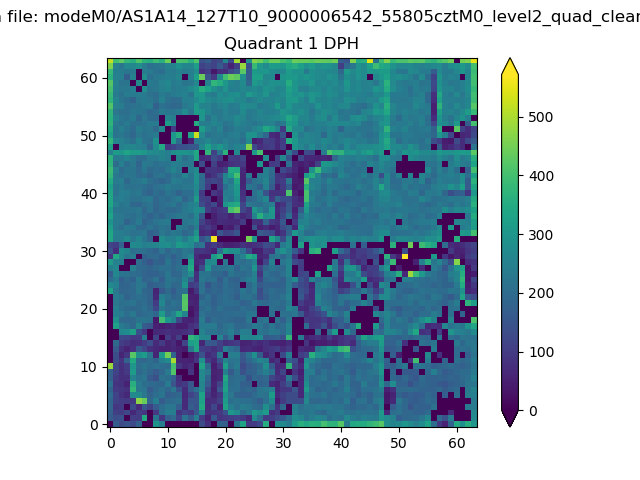 |
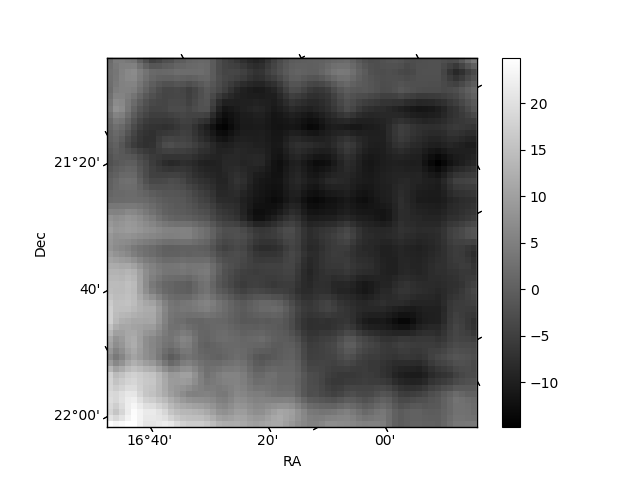
Quadrant B |
|---|---|---|---|
| Quadrant D | 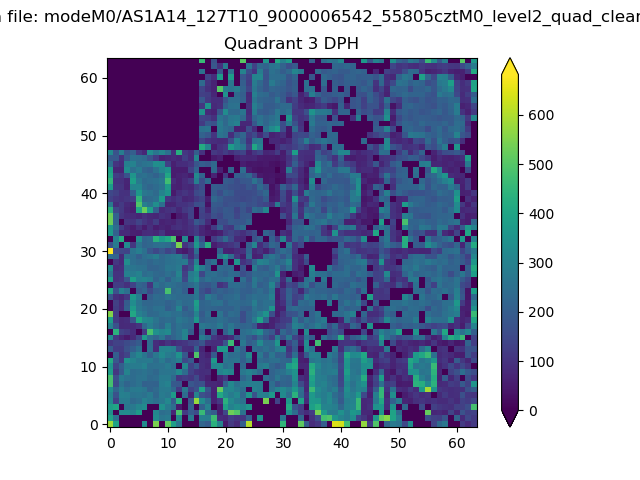 |
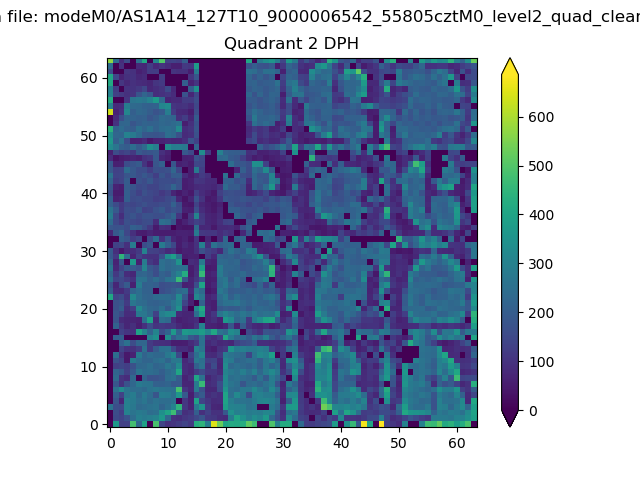 |
Quadrant C |
| Plot type | Count rate plots | Images |
|---|---|---|
| Comparison with Poisson distribution Blue bars denote a histogram of data divided into 1 sec bins. Red curve is a Poisson curve with rate = median count rate of data. |
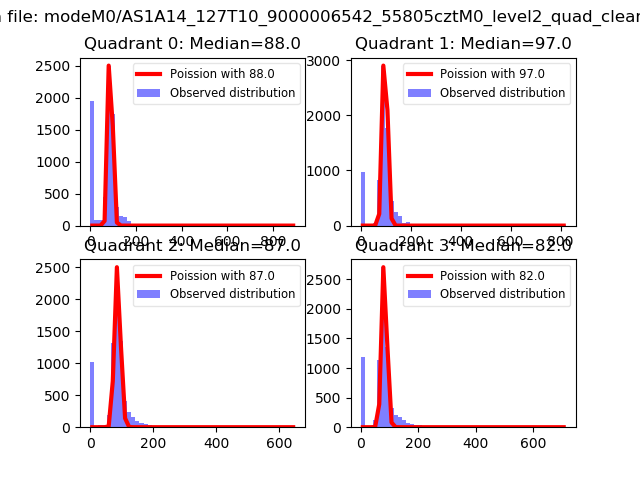 |
 |
| Quadrant-wise count rates Data is divided into 100 sec bins |
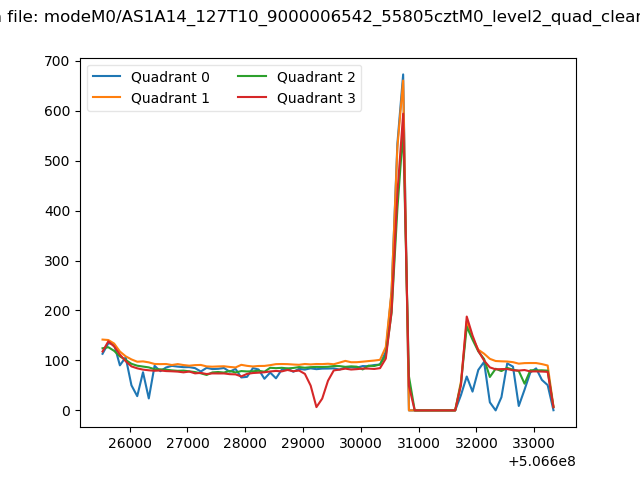 |
|
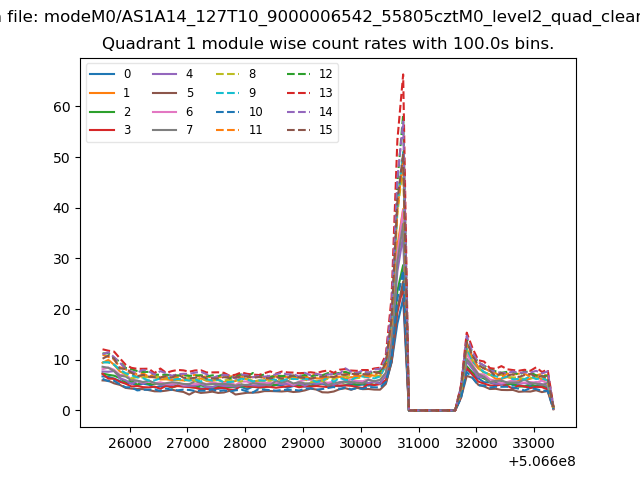
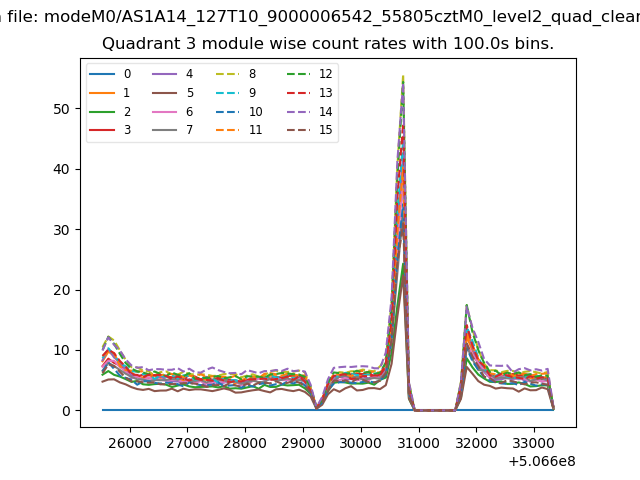
| Module-wise count rates for Quadrant A Data is divided into 100 sec bins |
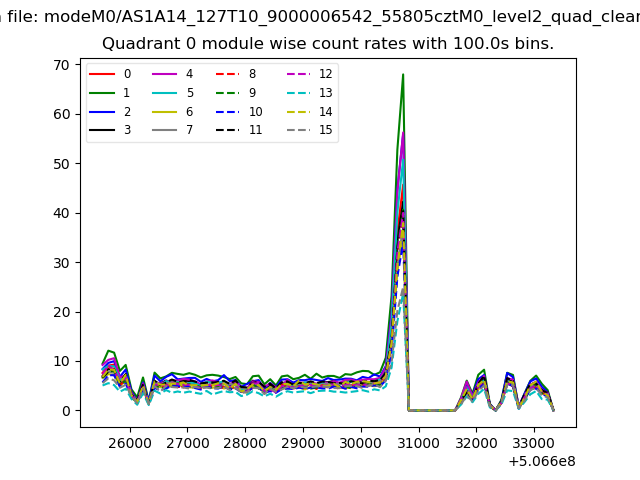 |
 |
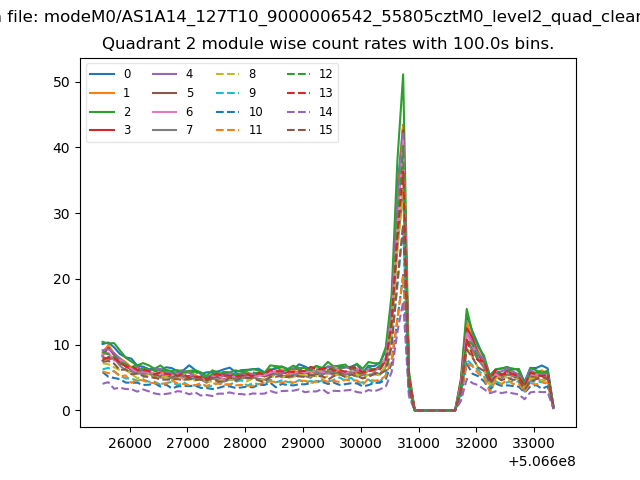
| Module-wise count rates for Quadrant B Data is divided into 100 sec bins |
 |
 |
| Module-wise count rates for Quadrant C Data is divided into 100 sec bins |
 |
 |
| Module-wise count rates for Quadrant D Data is divided into 100 sec bins |
 |
 |
| Parameter | Plot |
|---|---|
| CZT HV Monitor | 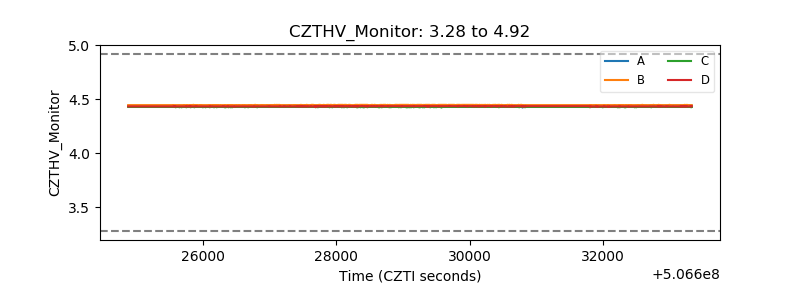 |
| D_VDD | 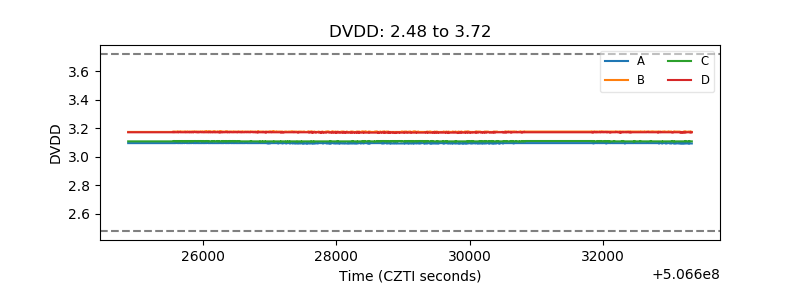 |
| Temperature 1 | 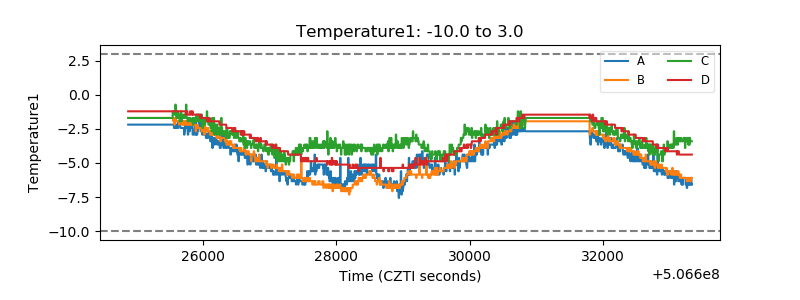 |
| Veto HV Monitor | 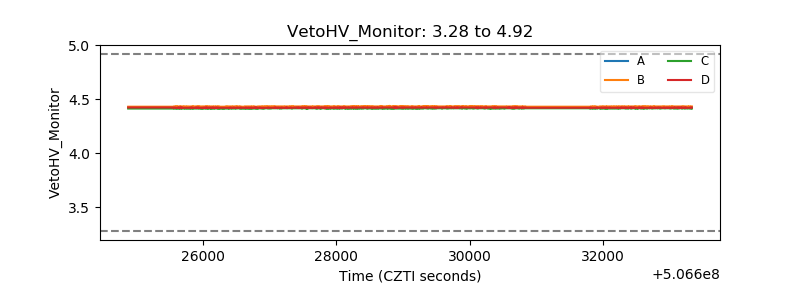 |
| Veto LLD | 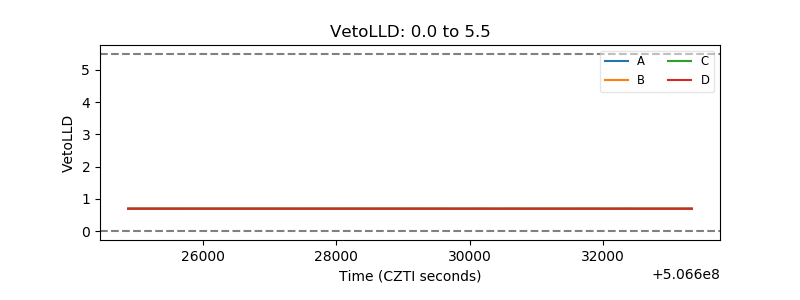 |
| Alpha Counter | 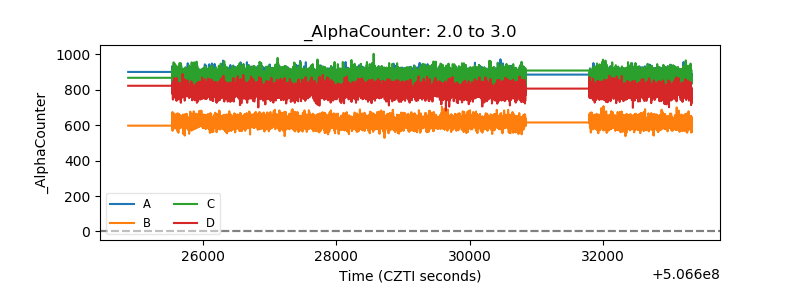 |
| _CPM_Rate | 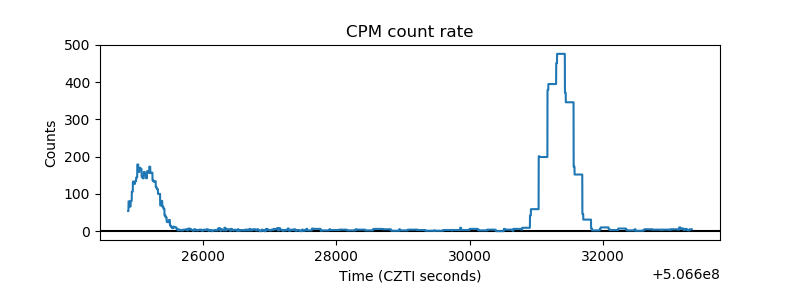 |
| CZT Counter | 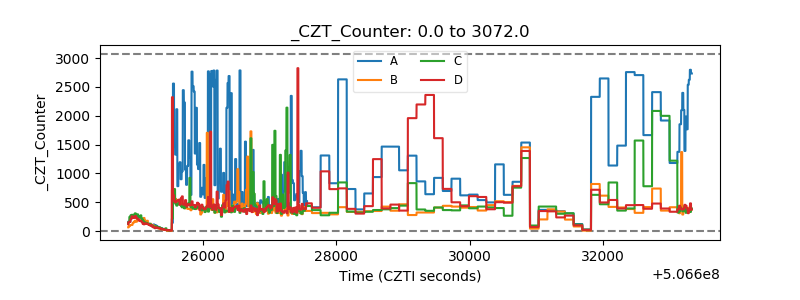 |
| +2.5 Volts monitor |  |
| +5 Volts monitor |  |
| _ROLL_ROT | 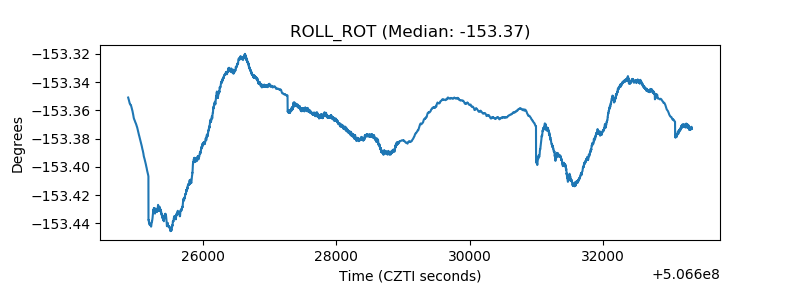 |
| _Roll_DEC | 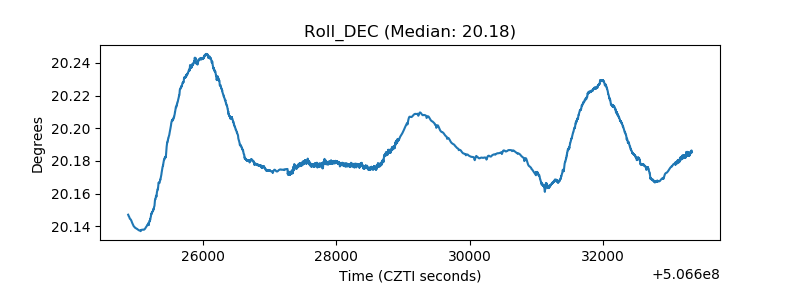 |
| _Roll_RA | 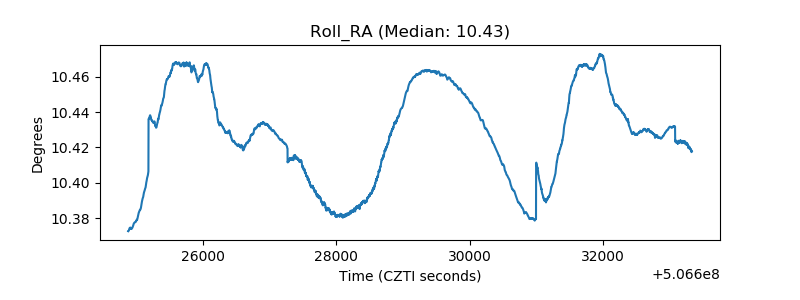 |
| Veto Counter | 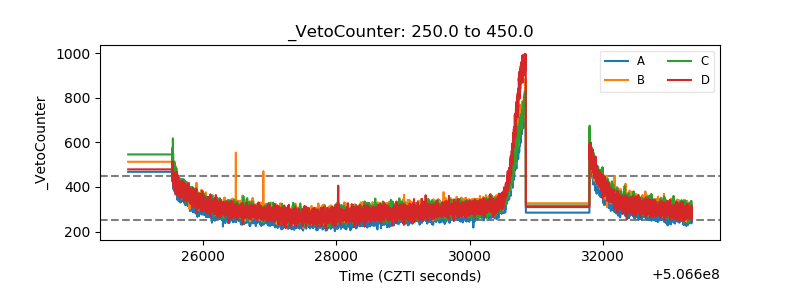 |