| Param | Original file | Final file |
|---|---|---|
| Filename | modeM0/AS1A14_127T10_9000006542_55807cztM0_level2.fits | modeM0/AS1A14_127T10_9000006542_55807cztM0_level2_quad_clean.evt |
| Size (bytes) | 497,704,320 | 92,949,120 |
| Size | 474.6 MB | 88.6 MB |
| Events in quadrant A | 7,358,639 | 532,077 |
| Events in quadrant B | 2,789,060 | 666,855 |
| Events in quadrant C | 3,405,454 | 591,811 |
| Events in quadrant D | 4,363,759 | 568,620 |
| Mode M0 | |||
|---|---|---|---|
| Quadrant | BADHDUFLAG | Total packets | Discarded packets |
| A | 0 | 26317 | 1 |
| B | 0 | 13668 | 1 |
| C | 0 | 15463 | 1 |
| D | 0 | 17665 | 1 |
| Mode M9 | |||
|---|---|---|---|
| Quadrant | BADHDUFLAG | Total packets | Discarded packets |
| A | 0 | 10 | 0 |
| B | 0 | 10 | 0 |
| C | 0 | 10 | 0 |
| D | 0 | 10 | 0 |
| Mode SS | |||
|---|---|---|---|
| Quadrant | BADHDUFLAG | Total packets | Discarded packets |
| A | 0 | 134 | 0 |
| B | 0 | 134 | 0 |
| C | 0 | 134 | 0 |
| D | 0 | 134 | 0 |
| Quadrant | Total seconds | Saturated seconds | Saturation percentage |
|---|---|---|---|
| A | 6519 | 1119 | 17.165209% |
| B | 6519 | 51 | 0.782329% |
| C | 6519 | 209 | 3.206013% |
| D | 6520 | 161 | 2.469325% |
Noise dominated data is calculated using 1-second bins in cleaned event files. If a bin has >2000 counts, and if more than 50% of those come from <1% of pixels, then it is considered to be noise-dominated and hence unusable.
| Quadrant | # 1 sec bins | Bins with >0 counts | Bins with >2000 counts | High rate bins dominated by noise | Noise dominated (total time) | Noise dominated (detector-on time) | Marked lightcurve |
|---|---|---|---|---|---|---|---|
| A | 7569 | 6520 | 1148 | 1148 | 15.17% | 17.61% | 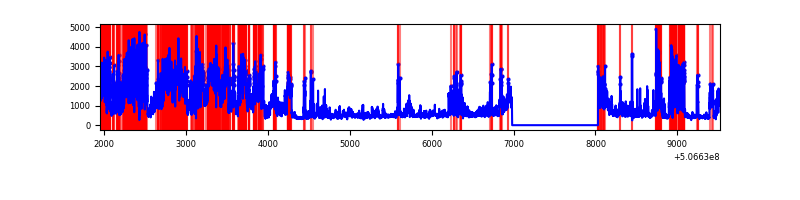 |
| B | 7569 | 6520 | 11 | 11 | 0.15% | 0.17% | 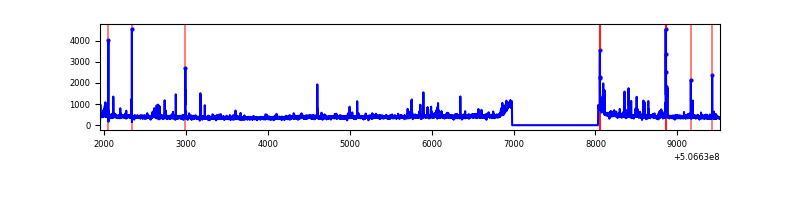 |
| C | 7569 | 6520 | 154 | 154 | 2.03% | 2.36% | 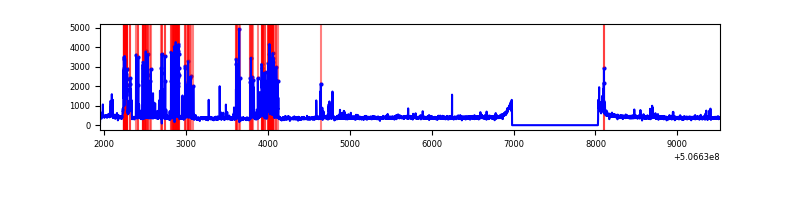 |
| D | 7570 | 6521 | 201 | 201 | 2.66% | 3.08% | 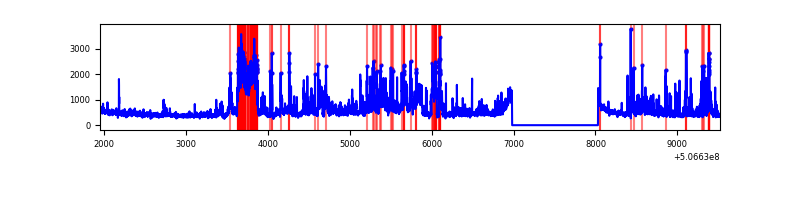 |
Top three noisy pixels from each quadrant. If the there are fewer than three noisy pixels in the level2.evt file, extra rows are filled as -1
| Pixel properties | Quadrant properties | ||||||
|---|---|---|---|---|---|---|---|
| Quadrant | DetID | PixID | Counts | Sigma | Mean | Median | Sigma |
| A | 12 | 115 | 2377200 | 15419.86 | 609 | 596 | 154.1 |
| A | 15 | 32 | 1671608 | 10841.84 | 609 | 596 | 154.1 |
| A | 3 | 14 | 310242 | 2009.04 | 609 | 596 | 154.1 |
| B | 0 | 213 | 58764 | 410.84 | 647 | 623 | 141.5 |
| B | 10 | 247 | 46448 | 323.81 | 647 | 623 | 141.5 |
| B | 5 | 172 | 36770 | 255.42 | 647 | 623 | 141.5 |
| C | 13 | 3 | 796523 | 4473.29 | 634 | 630 | 177.9 |
| C | 9 | 38 | 44747 | 247.96 | 634 | 630 | 177.9 |
| C | 6 | 223 | 29617 | 162.92 | 634 | 630 | 177.9 |
| D | 7 | 70 | 1259569 | 6807.96 | 638 | 608 | 184.9 |
| D | 11 | 129 | 158156 | 851.96 | 638 | 608 | 184.9 |
| D | 3 | 12 | 138291 | 744.53 | 638 | 608 | 184.9 |
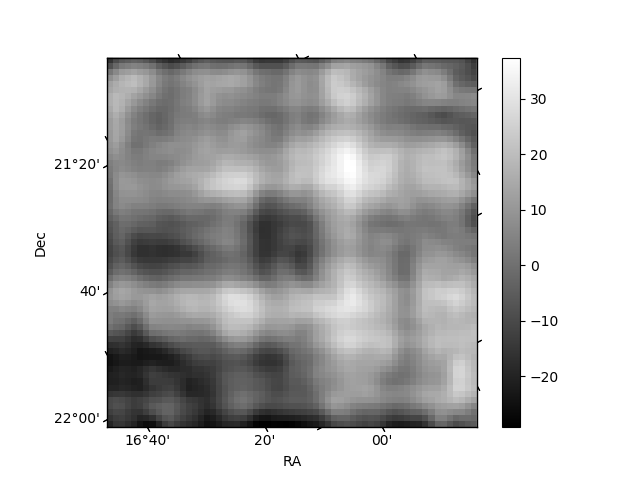
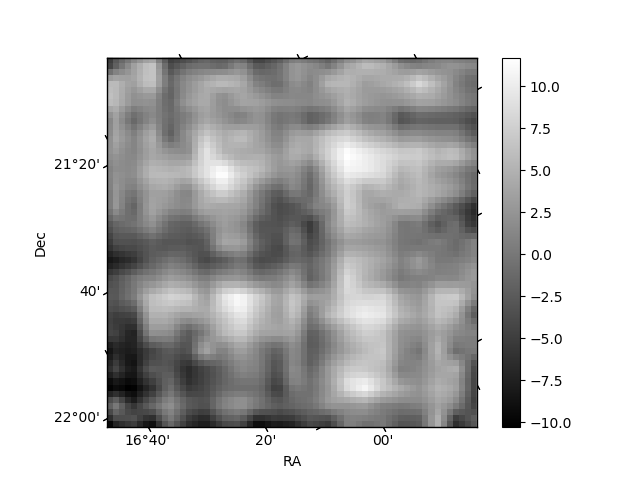
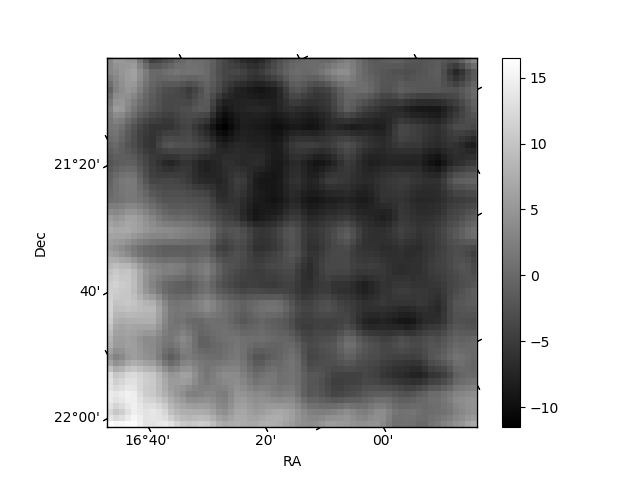
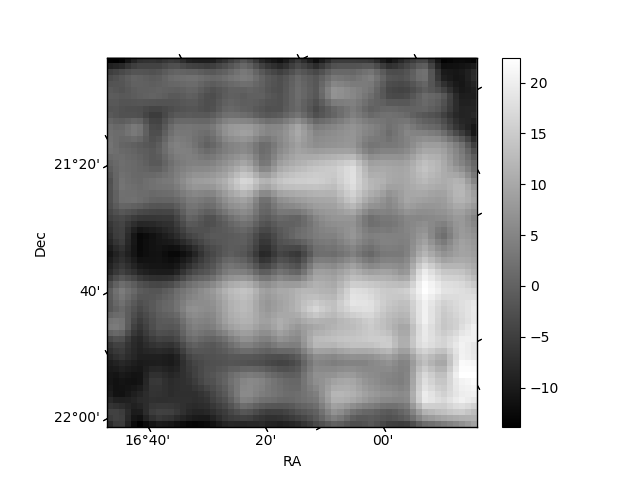
Histogram calculated using DETX and DETY for each event in the final _common_clean file
| Quadrant A | 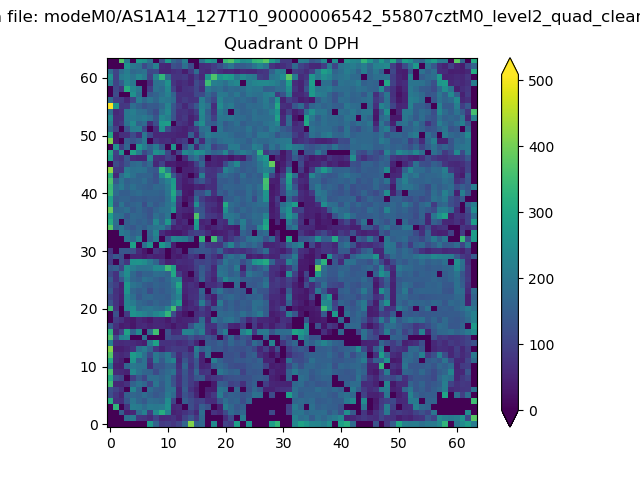 |
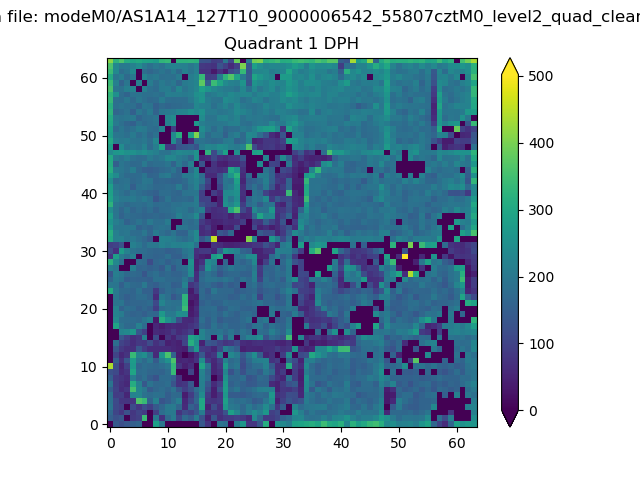 |
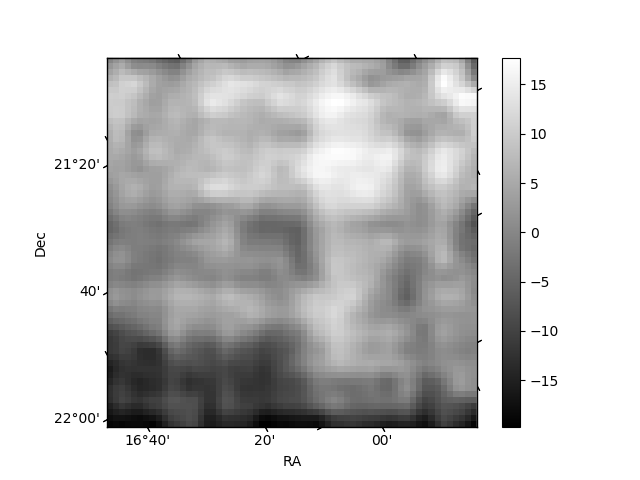
Quadrant B |
|---|---|---|---|
| Quadrant D | 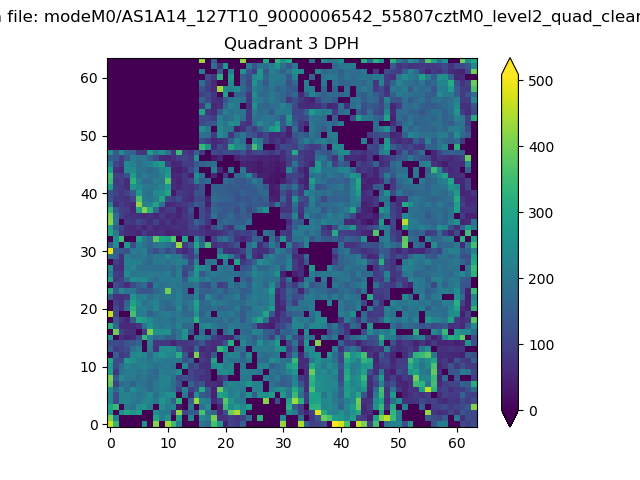 |
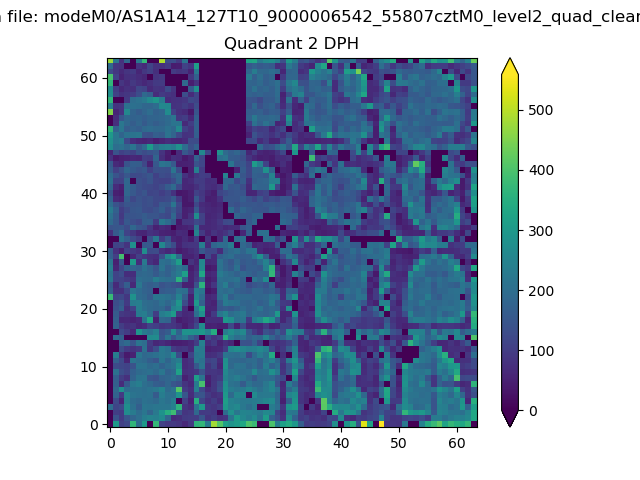 |
Quadrant C |
| Plot type | Count rate plots | Images |
|---|---|---|
| Comparison with Poisson distribution Blue bars denote a histogram of data divided into 1 sec bins. Red curve is a Poisson curve with rate = median count rate of data. |
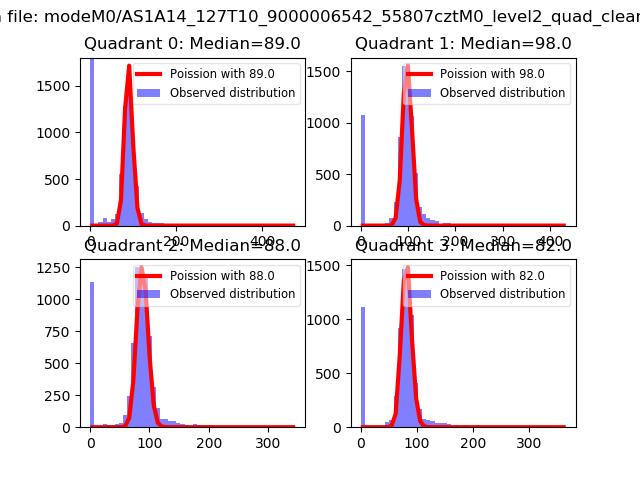 |
 |
| Quadrant-wise count rates Data is divided into 100 sec bins |
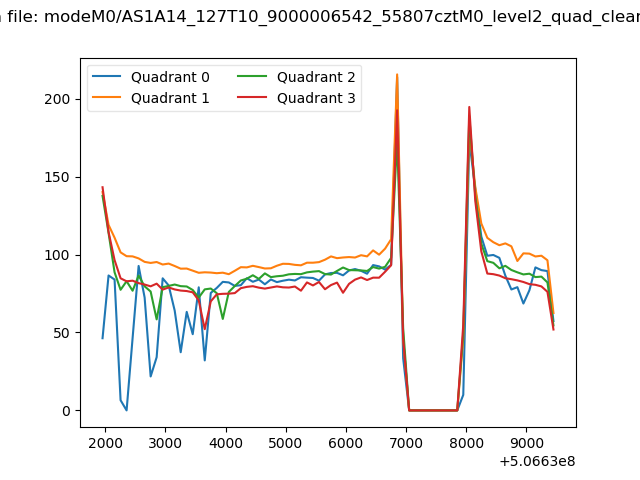 |
|
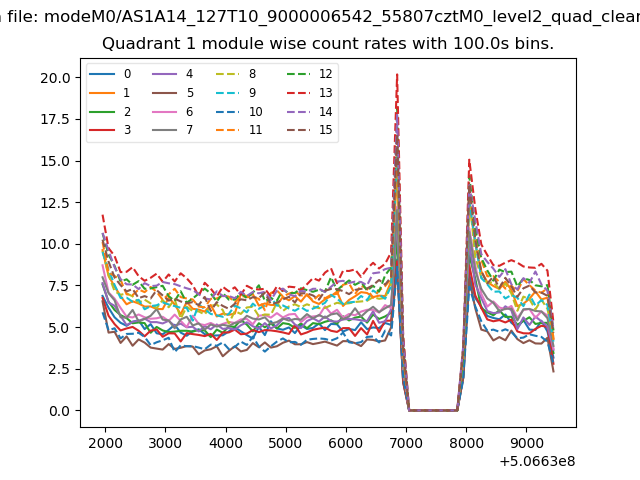
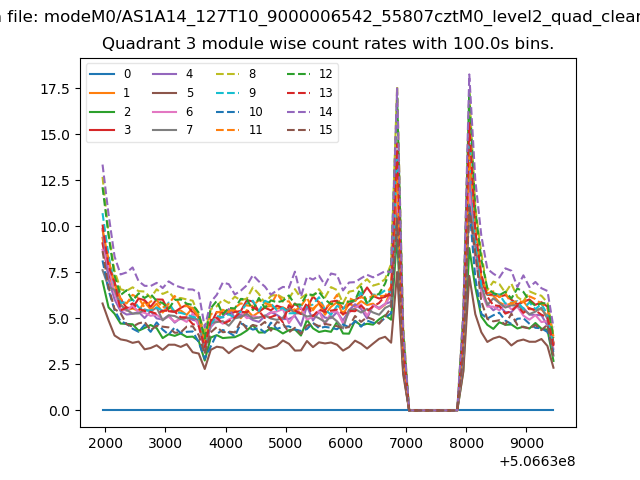
| Module-wise count rates for Quadrant A Data is divided into 100 sec bins |
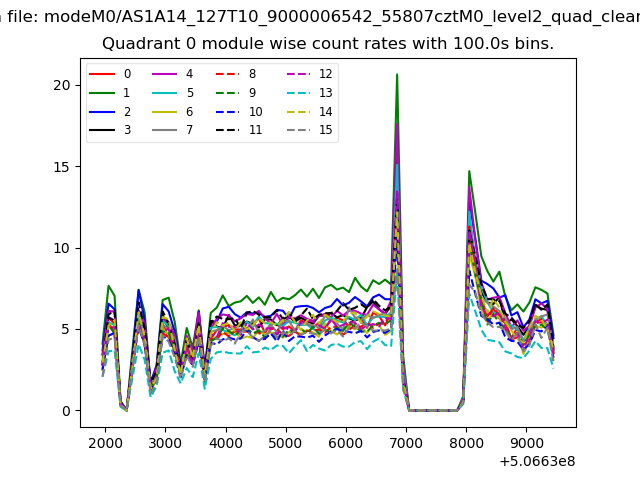 |
 |
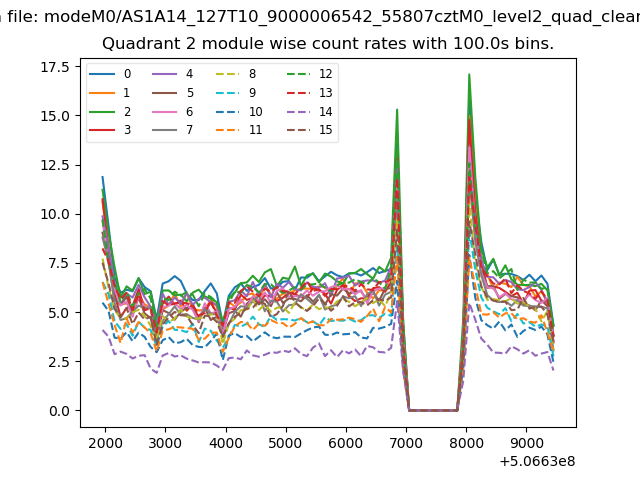
| Module-wise count rates for Quadrant B Data is divided into 100 sec bins |
 |
 |
| Module-wise count rates for Quadrant C Data is divided into 100 sec bins |
 |
 |
| Module-wise count rates for Quadrant D Data is divided into 100 sec bins |
 |
 |
| Parameter | Plot |
|---|---|
| CZT HV Monitor | 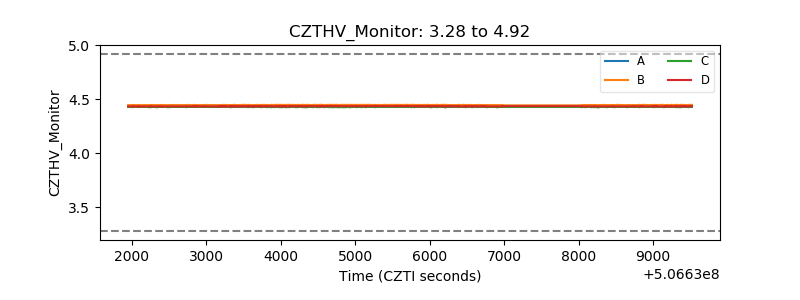 |
| D_VDD | 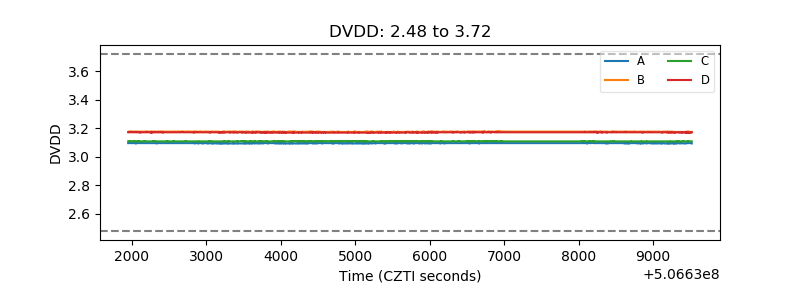 |
| Temperature 1 | 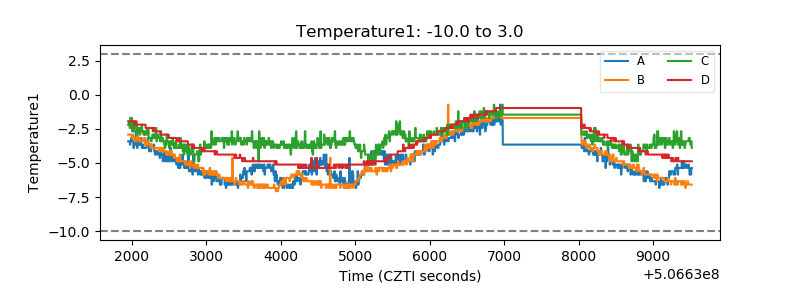 |
| Veto HV Monitor |  |
| Veto LLD | 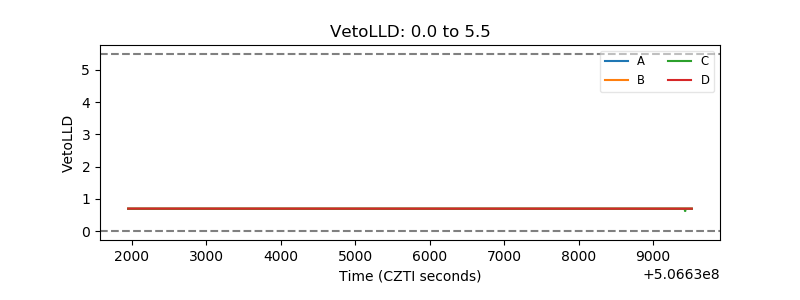 |
| Alpha Counter | 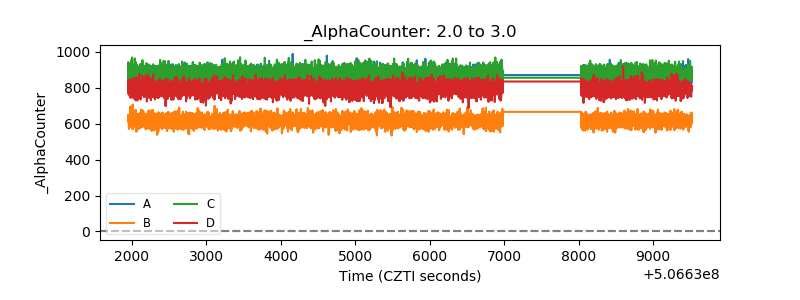 |
| _CPM_Rate | 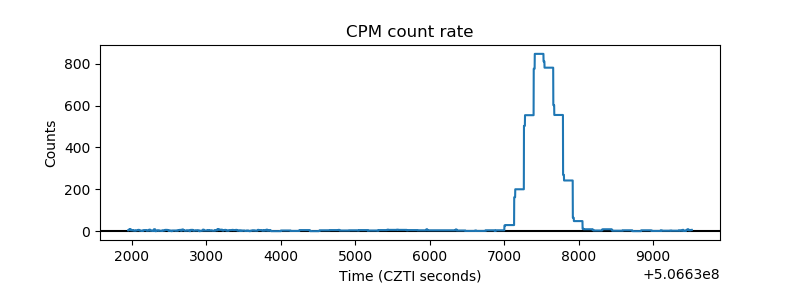 |
| CZT Counter | 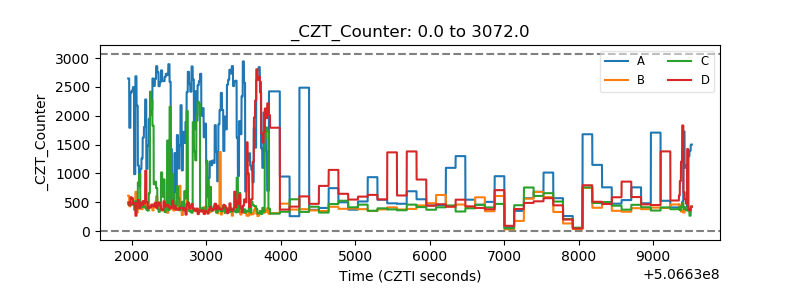 |
| +2.5 Volts monitor |  |
| +5 Volts monitor |  |
| _ROLL_ROT | 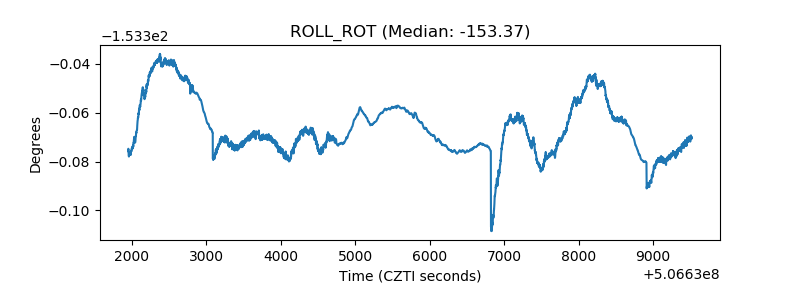 |
| _Roll_DEC | 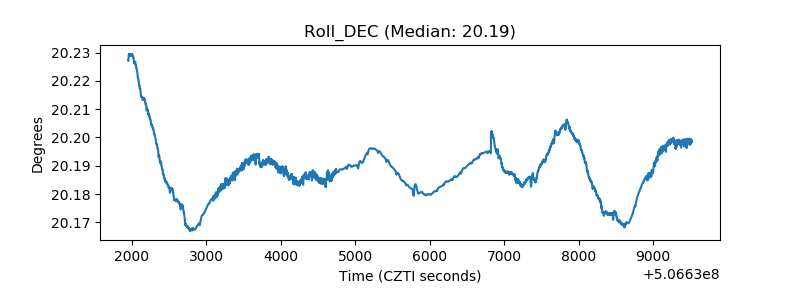 |
| _Roll_RA | 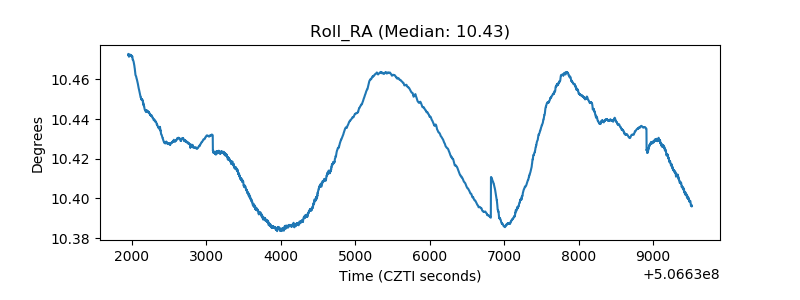 |
| Veto Counter | 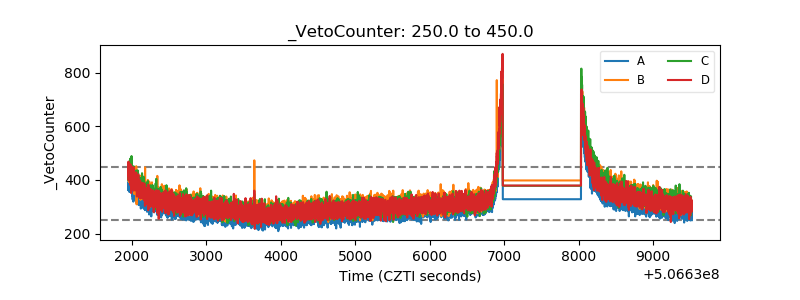 |