| Param | Original file | Final file |
|---|---|---|
| Filename | modeM0/AS1A14_127T10_9000006542_55808cztM0_level2.fits | modeM0/AS1A14_127T10_9000006542_55808cztM0_level2_quad_clean.evt |
| Size (bytes) | 459,169,920 | 99,086,400 |
| Size | 437.9 MB | 94.5 MB |
| Events in quadrant A | 6,813,726 | 617,556 |
| Events in quadrant B | 3,221,683 | 689,885 |
| Events in quadrant C | 2,964,377 | 628,719 |
| Events in quadrant D | 3,474,092 | 594,596 |
| Mode M0 | |||
|---|---|---|---|
| Quadrant | BADHDUFLAG | Total packets | Discarded packets |
| A | 0 | 24895 | 2 |
| B | 0 | 14912 | 2 |
| C | 0 | 14403 | 3 |
| D | 0 | 15431 | 2 |
| Mode M9 | |||
|---|---|---|---|
| Quadrant | BADHDUFLAG | Total packets | Discarded packets |
| A | 0 | 14 | 0 |
| B | 0 | 14 | 0 |
| C | 0 | 15 | 0 |
| D | 0 | 15 | 0 |
| Mode SS | |||
|---|---|---|---|
| Quadrant | BADHDUFLAG | Total packets | Discarded packets |
| A | 0 | 138 | 0 |
| B | 0 | 138 | 0 |
| C | 0 | 138 | 0 |
| D | 0 | 138 | 0 |
| Quadrant | Total seconds | Saturated seconds | Saturation percentage |
|---|---|---|---|
| A | 6735 | 469 | 6.963623% |
| B | 6735 | 116 | 1.722346% |
| C | 6734 | 26 | 0.386100% |
| D | 6734 | 49 | 0.727651% |
Noise dominated data is calculated using 1-second bins in cleaned event files. If a bin has >2000 counts, and if more than 50% of those come from <1% of pixels, then it is considered to be noise-dominated and hence unusable.
| Quadrant | # 1 sec bins | Bins with >0 counts | Bins with >2000 counts | High rate bins dominated by noise | Noise dominated (total time) | Noise dominated (detector-on time) | Marked lightcurve |
|---|---|---|---|---|---|---|---|
| A | 7880 | 6736 | 482 | 482 | 6.12% | 7.16% | 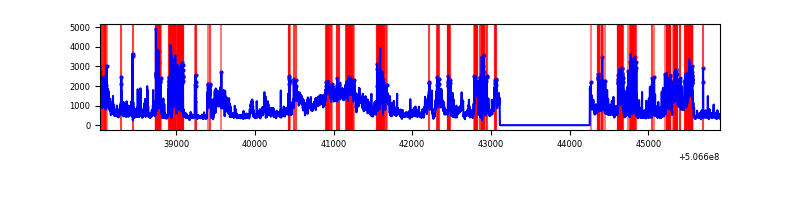 |
| B | 7880 | 6736 | 90 | 90 | 1.14% | 1.34% | 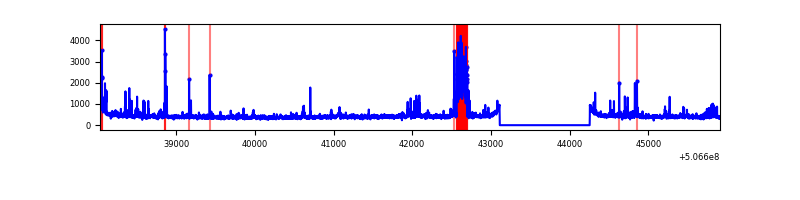 |
| C | 7879 | 6735 | 30 | 30 | 0.38% | 0.45% | 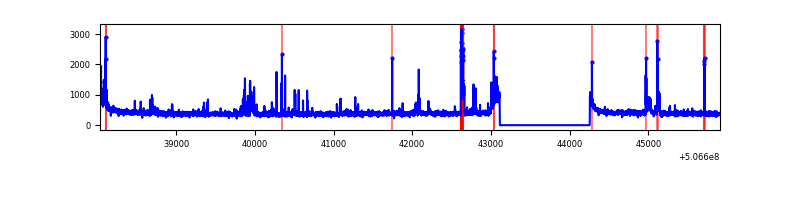 |
| D | 7879 | 6735 | 46 | 46 | 0.58% | 0.68% | 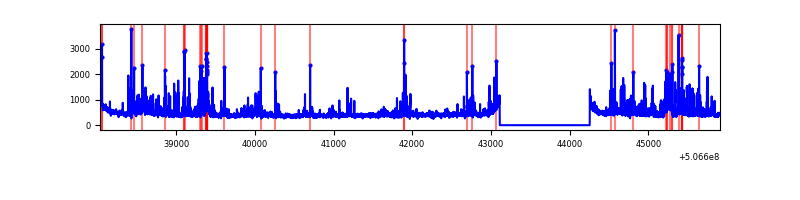 |
Top three noisy pixels from each quadrant. If the there are fewer than three noisy pixels in the level2.evt file, extra rows are filled as -1
| Pixel properties | Quadrant properties | ||||||
|---|---|---|---|---|---|---|---|
| Quadrant | DetID | PixID | Counts | Sigma | Mean | Median | Sigma |
| A | 15 | 32 | 2878222 | 17187.04 | 666 | 649 | 167.4 |
| A | 12 | 115 | 521067 | 3108.33 | 666 | 649 | 167.4 |
| A | 8 | 192 | 221467 | 1318.89 | 666 | 649 | 167.4 |
| B | 0 | 153 | 278409 | 1912.15 | 674 | 653 | 145.3 |
| B | 0 | 213 | 102105 | 698.43 | 674 | 653 | 145.3 |
| B | 10 | 247 | 42617 | 288.89 | 674 | 653 | 145.3 |
| C | 13 | 3 | 273598 | 1458.9 | 671 | 665 | 187.1 |
| C | 7 | 220 | 36426 | 191.15 | 671 | 665 | 187.1 |
| C | 14 | 254 | 18831 | 97.1 | 671 | 665 | 187.1 |
| D | 11 | 129 | 379066 | 1971.17 | 666 | 638 | 192.0 |
| D | 3 | 12 | 206130 | 1070.37 | 666 | 638 | 192.0 |
| D | 7 | 96 | 143525 | 744.27 | 666 | 638 | 192.0 |
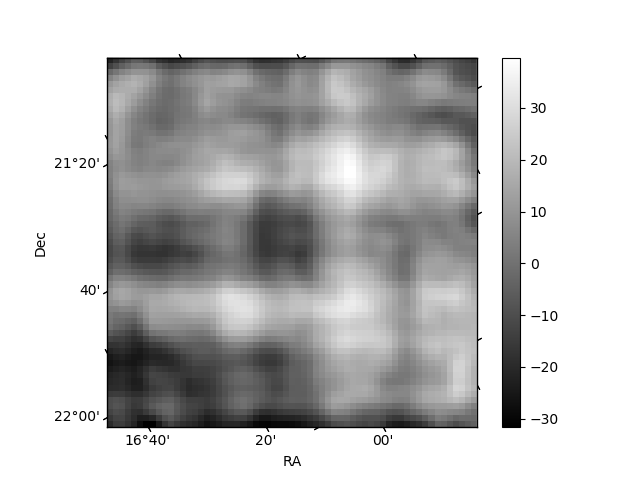
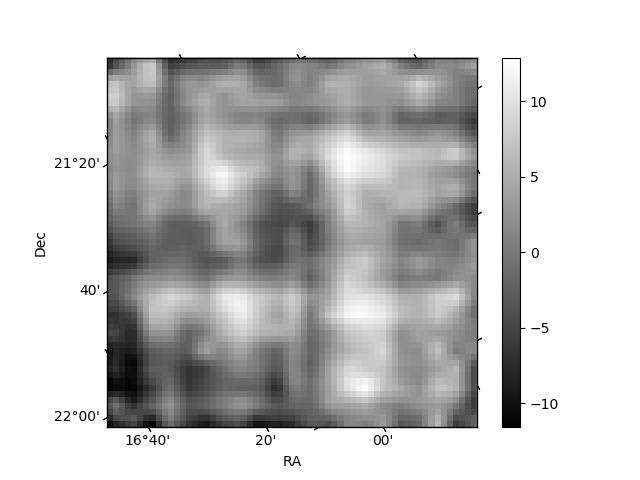
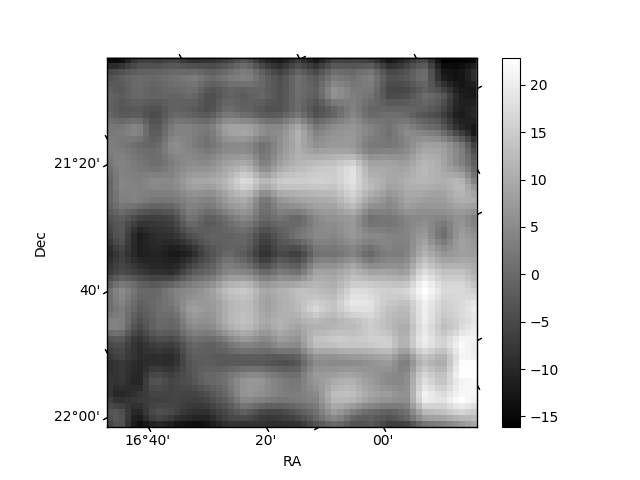
Histogram calculated using DETX and DETY for each event in the final _common_clean file
| Quadrant A | 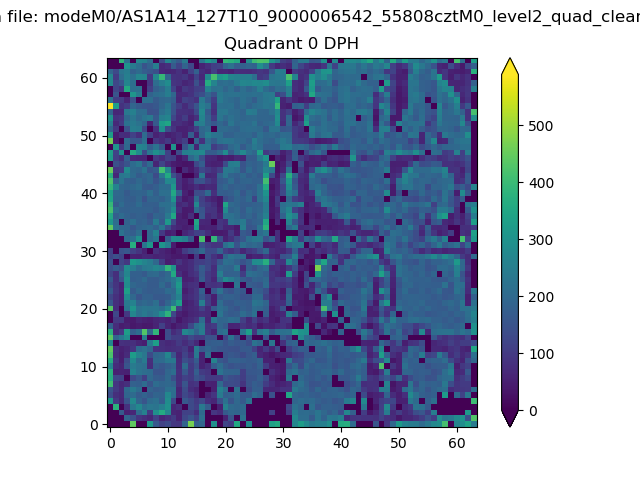 |
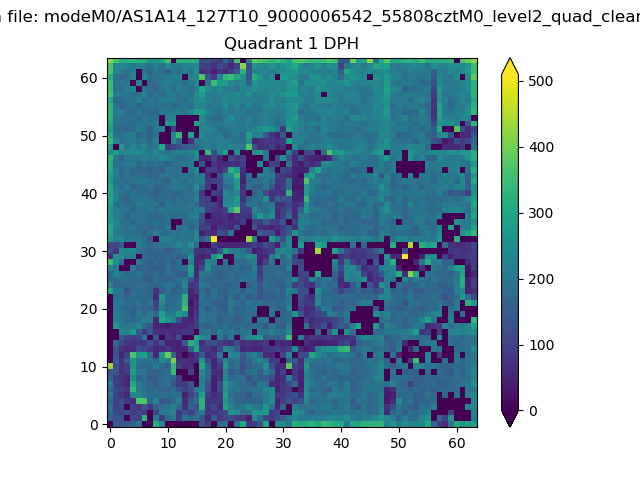 |
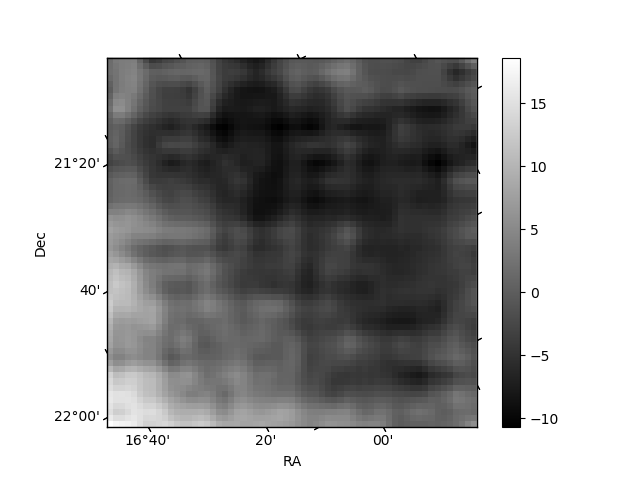
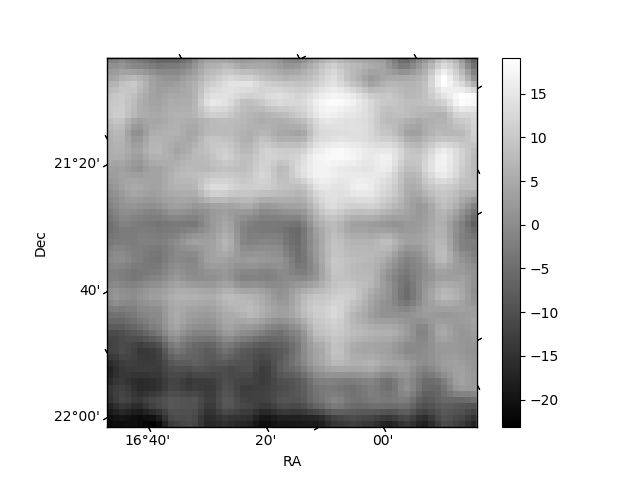
Quadrant B |
|---|---|---|---|
| Quadrant D | 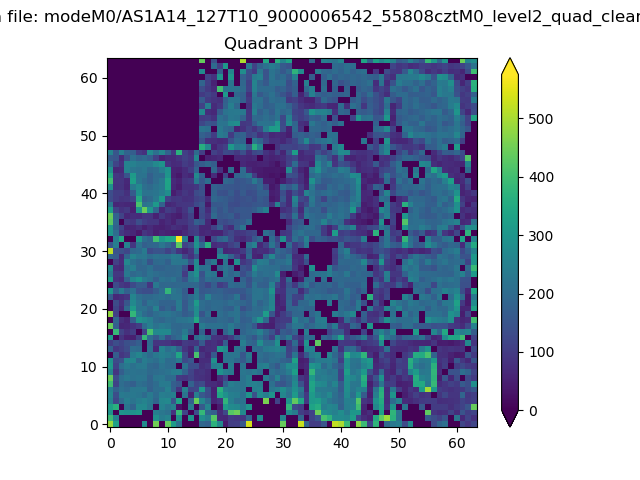 |
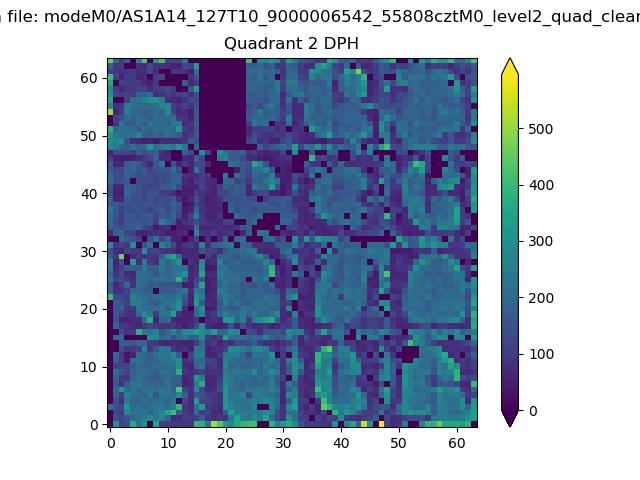 |
Quadrant C |
| Plot type | Count rate plots | Images |
|---|---|---|
| Comparison with Poisson distribution Blue bars denote a histogram of data divided into 1 sec bins. Red curve is a Poisson curve with rate = median count rate of data. |
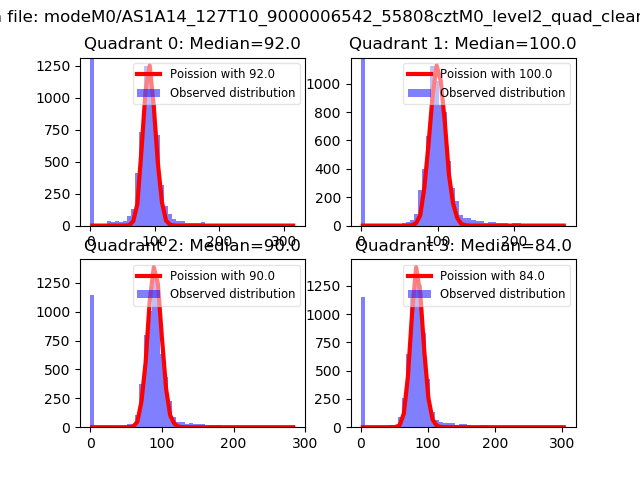 |
 |
| Quadrant-wise count rates Data is divided into 100 sec bins |
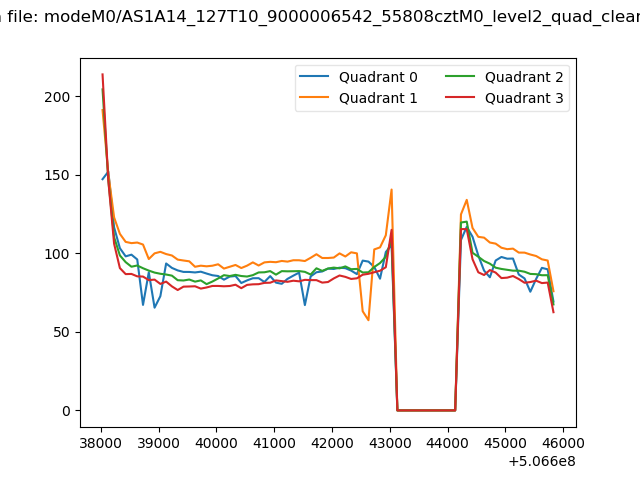 |
|
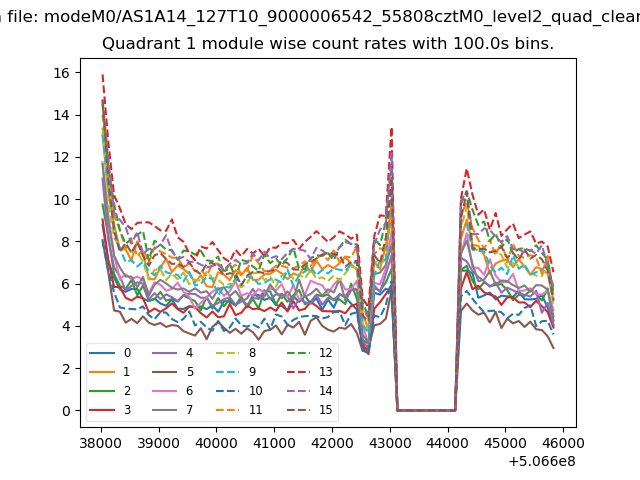
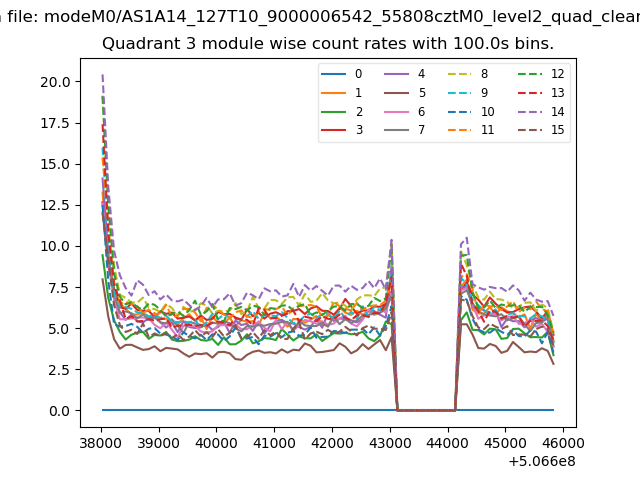
| Module-wise count rates for Quadrant A Data is divided into 100 sec bins |
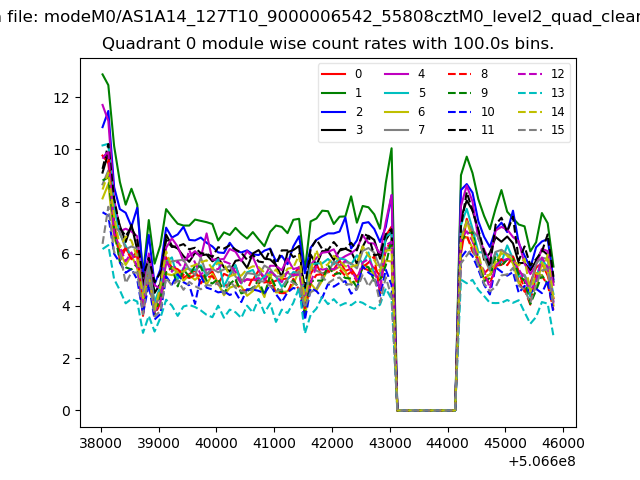 |
 |
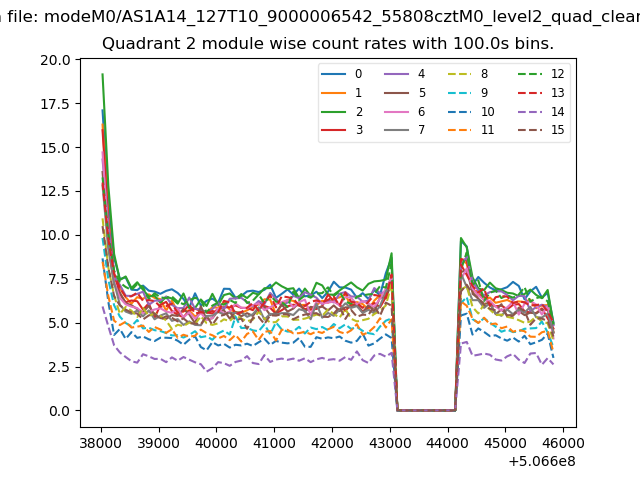
| Module-wise count rates for Quadrant B Data is divided into 100 sec bins |
 |
 |
| Module-wise count rates for Quadrant C Data is divided into 100 sec bins |
 |
 |
| Module-wise count rates for Quadrant D Data is divided into 100 sec bins |
 |
 |
| Parameter | Plot |
|---|---|
| CZT HV Monitor | 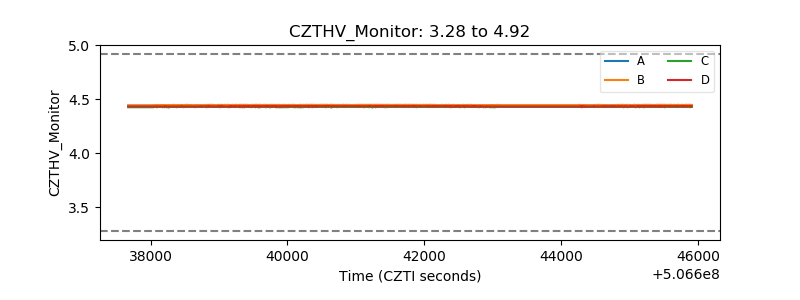 |
| D_VDD | 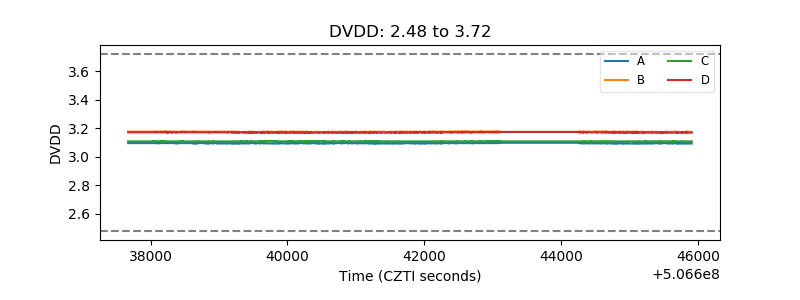 |
| Temperature 1 | 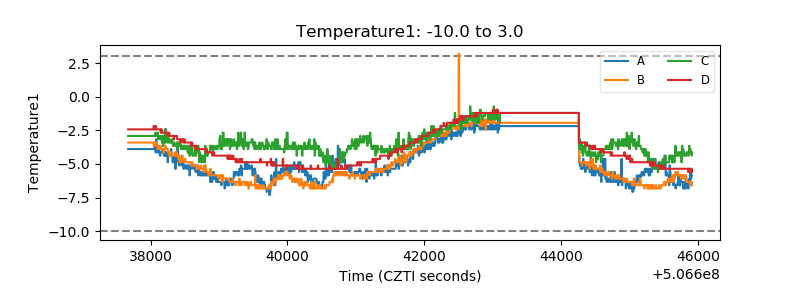 |
| Veto HV Monitor | 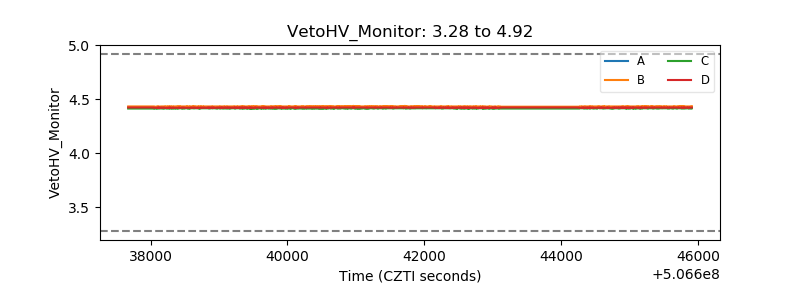 |
| Veto LLD | 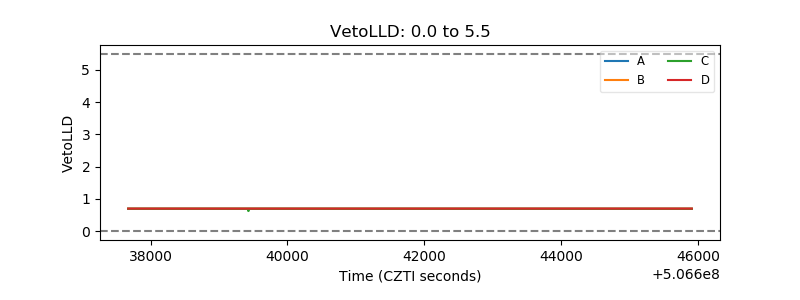 |
| Alpha Counter | 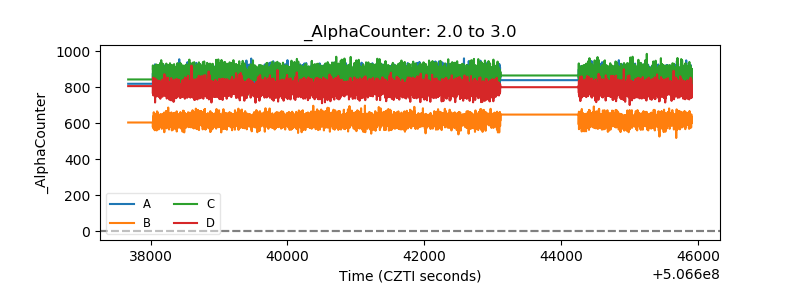 |
| _CPM_Rate | 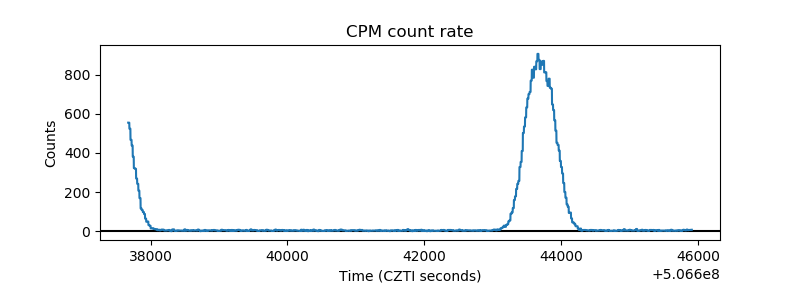 |
| CZT Counter | 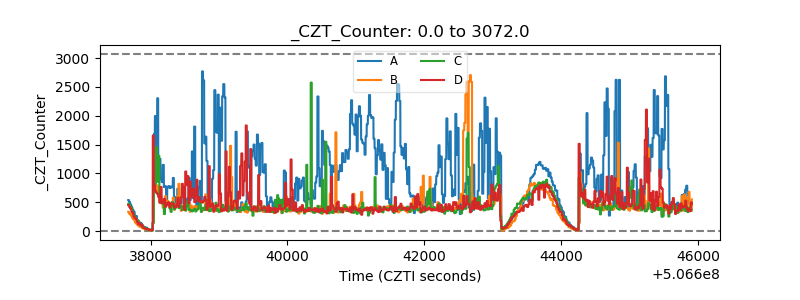 |
| +2.5 Volts monitor |  |
| +5 Volts monitor |  |
| _ROLL_ROT | 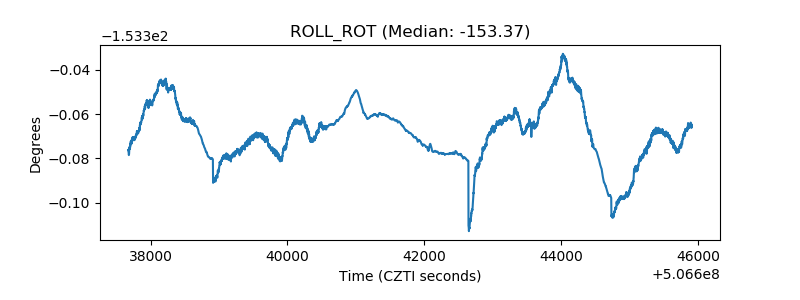 |
| _Roll_DEC | 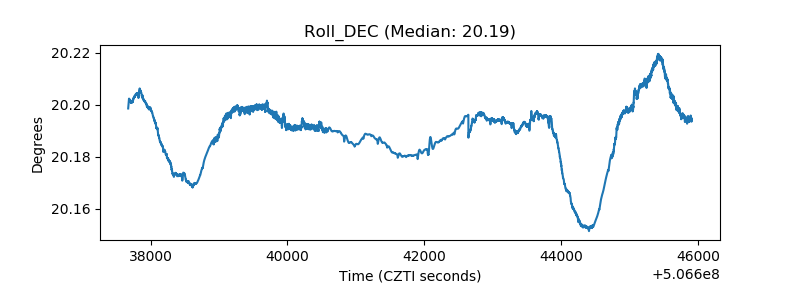 |
| _Roll_RA | 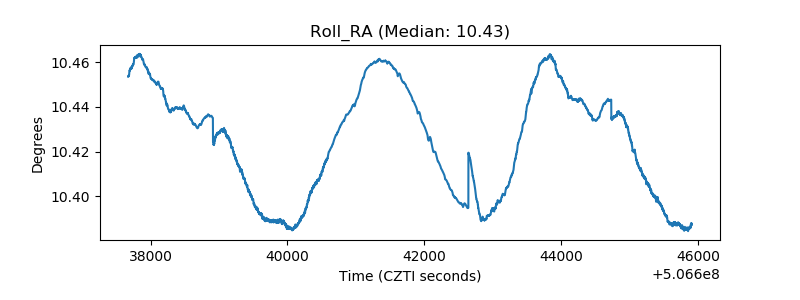 |
| Veto Counter | 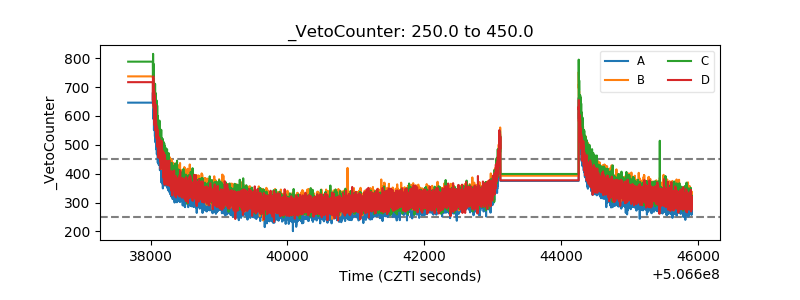 |