| Param | Original file | Final file |
|---|---|---|
| Filename | modeM0/AS1A14_127T10_9000006542_55809cztM0_level2.fits | modeM0/AS1A14_127T10_9000006542_55809cztM0_level2_quad_clean.evt |
| Size (bytes) | 471,430,080 | 97,099,200 |
| Size | 449.6 MB | 92.6 MB |
| Events in quadrant A | 5,313,101 | 618,087 |
| Events in quadrant B | 3,092,146 | 688,798 |
| Events in quadrant C | 2,853,329 | 619,790 |
| Events in quadrant D | 5,670,826 | 545,185 |
| Mode M0 | |||
|---|---|---|---|
| Quadrant | BADHDUFLAG | Total packets | Discarded packets |
| A | 0 | 20358 | 2 |
| B | 0 | 14409 | 2 |
| C | 0 | 14030 | 2 |
| D | 0 | 21622 | 2 |
| Mode M9 | |||
|---|---|---|---|
| Quadrant | BADHDUFLAG | Total packets | Discarded packets |
| A | 0 | 16 | 0 |
| B | 0 | 17 | 0 |
| C | 0 | 17 | 0 |
| D | 0 | 17 | 0 |
| Mode SS | |||
|---|---|---|---|
| Quadrant | BADHDUFLAG | Total packets | Discarded packets |
| A | 0 | 138 | 0 |
| B | 0 | 138 | 0 |
| C | 0 | 138 | 0 |
| D | 0 | 138 | 0 |
| Quadrant | Total seconds | Saturated seconds | Saturation percentage |
|---|---|---|---|
| A | 6714 | 313 | 4.661901% |
| B | 6714 | 63 | 0.938338% |
| C | 6714 | 40 | 0.595770% |
| D | 6714 | 517 | 7.700328% |
Noise dominated data is calculated using 1-second bins in cleaned event files. If a bin has >2000 counts, and if more than 50% of those come from <1% of pixels, then it is considered to be noise-dominated and hence unusable.
| Quadrant | # 1 sec bins | Bins with >0 counts | Bins with >2000 counts | High rate bins dominated by noise | Noise dominated (total time) | Noise dominated (detector-on time) | Marked lightcurve |
|---|---|---|---|---|---|---|---|
| A | 7864 | 6715 | 281 | 281 | 3.57% | 4.18% | 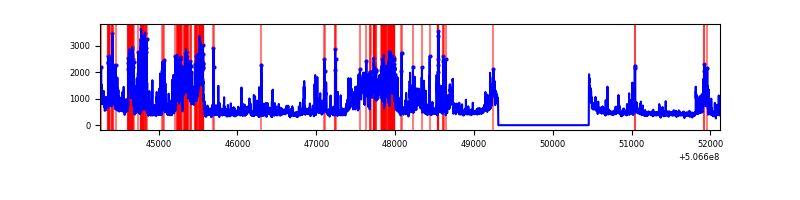 |
| B | 7864 | 6715 | 9 | 9 | 0.11% | 0.13% | 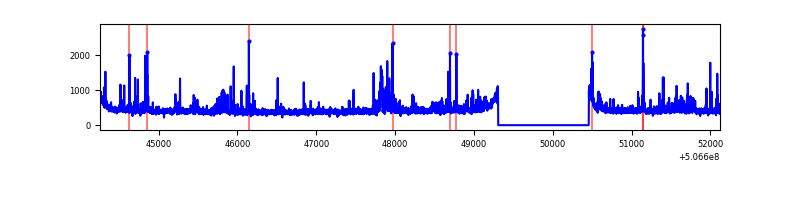 |
| C | 7864 | 6715 | 14 | 14 | 0.18% | 0.21% | 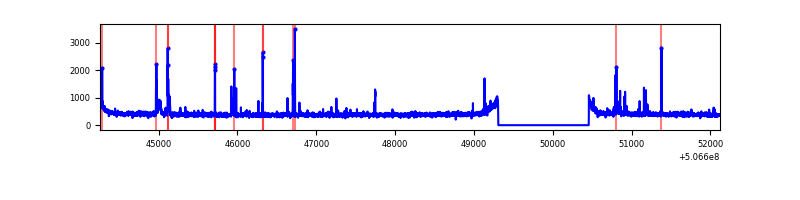 |
| D | 7864 | 6715 | 438 | 438 | 5.57% | 6.52% | 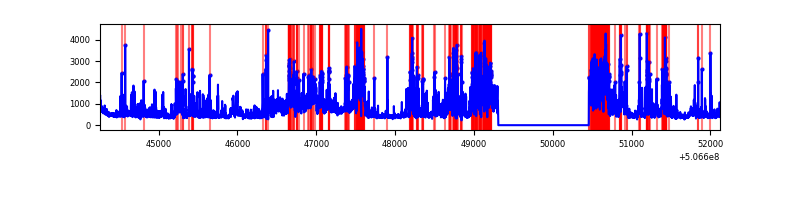 |
Top three noisy pixels from each quadrant. If the there are fewer than three noisy pixels in the level2.evt file, extra rows are filled as -1
| Pixel properties | Quadrant properties | ||||||
|---|---|---|---|---|---|---|---|
| Quadrant | DetID | PixID | Counts | Sigma | Mean | Median | Sigma |
| A | 15 | 32 | 1668550 | 9821.94 | 684 | 666 | 169.8 |
| A | 12 | 115 | 276026 | 1621.56 | 684 | 666 | 169.8 |
| A | 8 | 192 | 221271 | 1299.11 | 684 | 666 | 169.8 |
| B | 0 | 213 | 180303 | 1214.04 | 689 | 666 | 148.0 |
| B | 7 | 252 | 98178 | 659.02 | 689 | 666 | 148.0 |
| B | 10 | 247 | 33093 | 219.15 | 689 | 666 | 148.0 |
| C | 13 | 3 | 93499 | 489.55 | 681 | 675 | 189.6 |
| C | 15 | 200 | 39903 | 206.89 | 681 | 675 | 189.6 |
| C | 14 | 254 | 17084 | 86.54 | 681 | 675 | 189.6 |
| D | 11 | 129 | 1992577 | 10838.96 | 651 | 623 | 183.8 |
| D | 7 | 70 | 780276 | 4242.38 | 651 | 623 | 183.8 |
| D | 3 | 12 | 152632 | 827.14 | 651 | 623 | 183.8 |
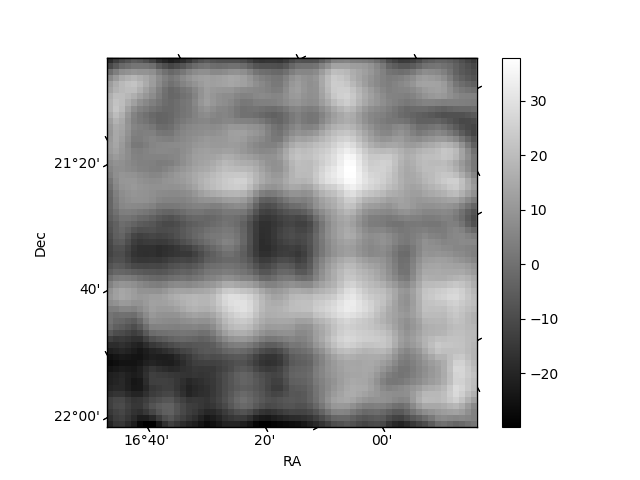
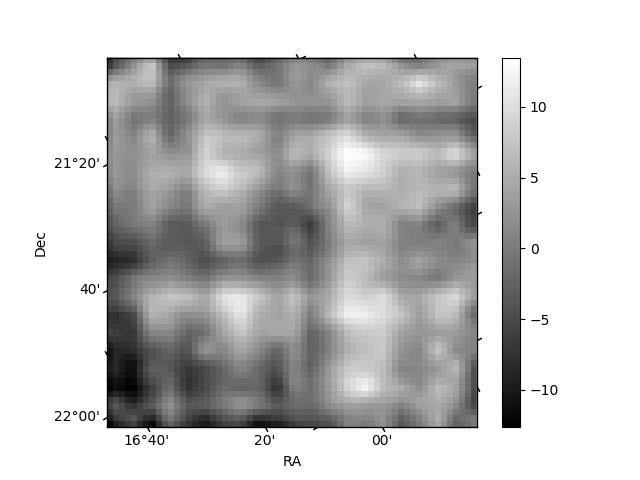
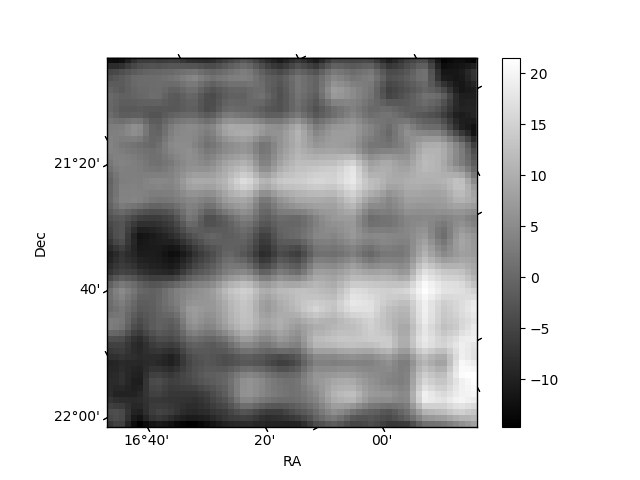
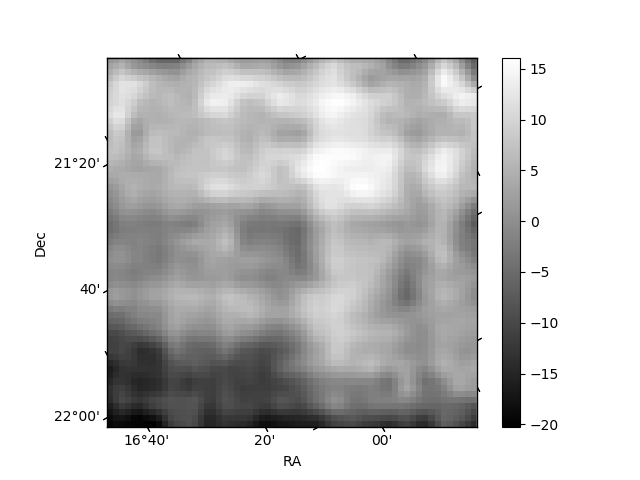
Histogram calculated using DETX and DETY for each event in the final _common_clean file
| Quadrant A | 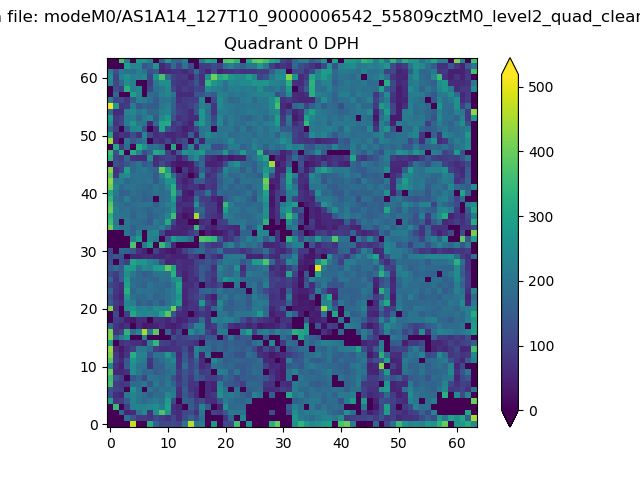 |
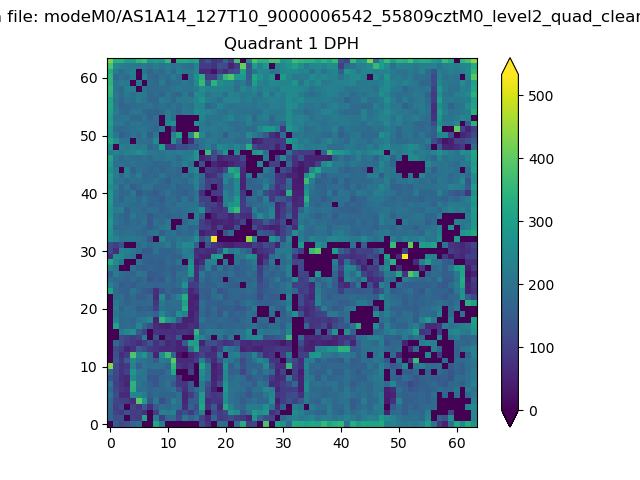 |
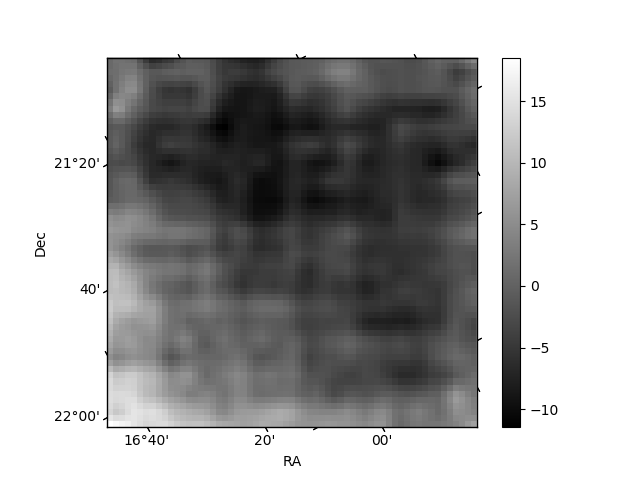
Quadrant B |
|---|---|---|---|
| Quadrant D | 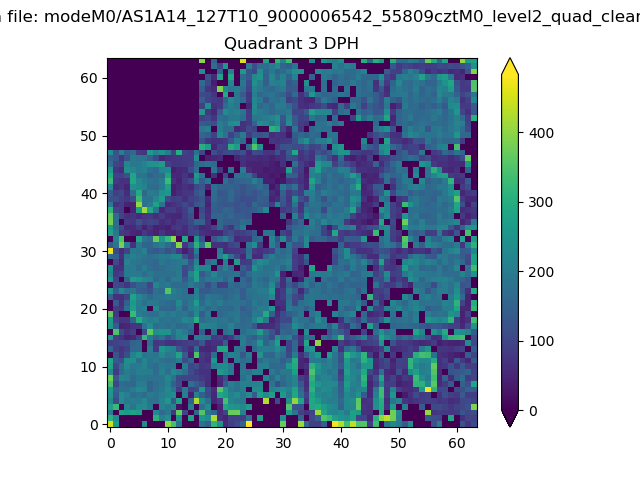 |
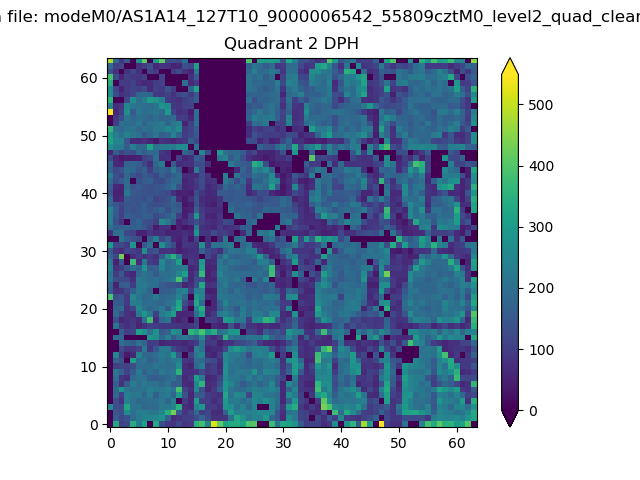 |
Quadrant C |
| Plot type | Count rate plots | Images |
|---|---|---|
| Comparison with Poisson distribution Blue bars denote a histogram of data divided into 1 sec bins. Red curve is a Poisson curve with rate = median count rate of data. |
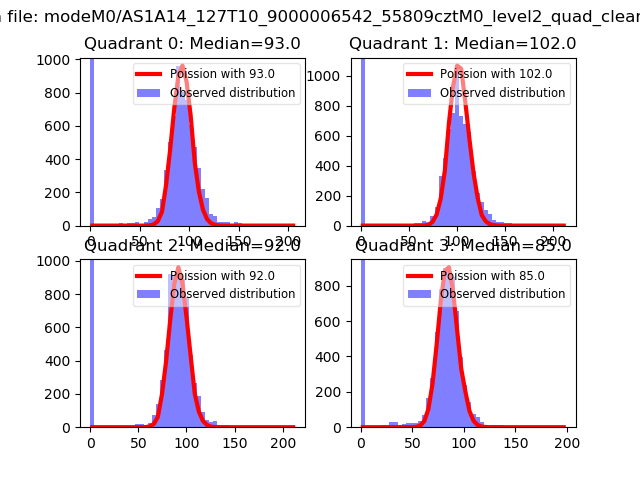 |
 |
| Quadrant-wise count rates Data is divided into 100 sec bins |
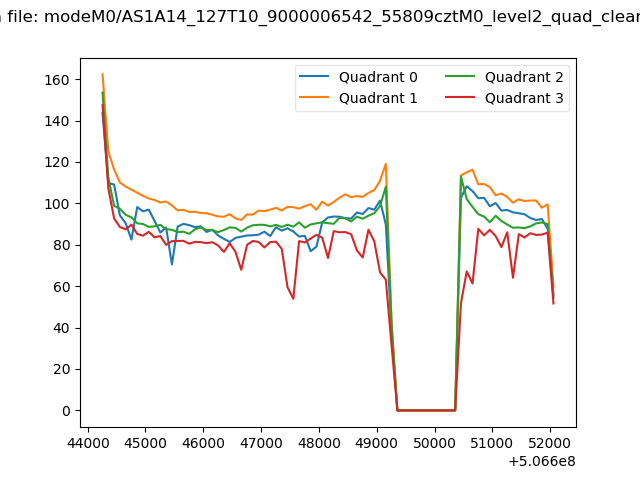 |
|
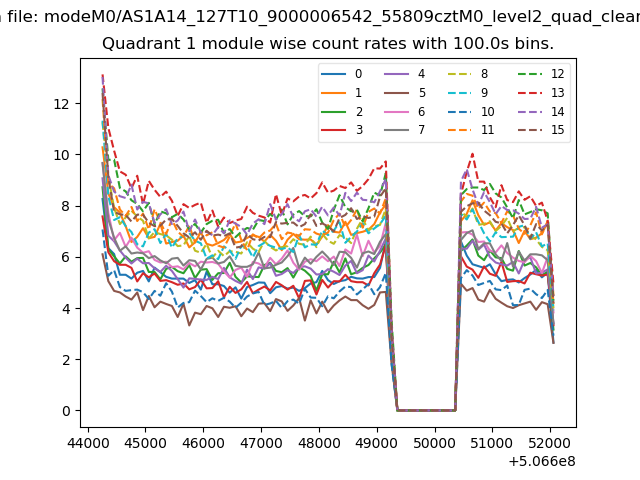
| Module-wise count rates for Quadrant A Data is divided into 100 sec bins |
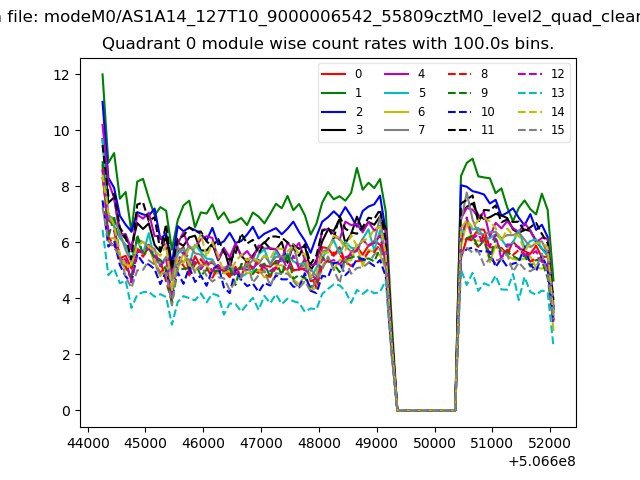 |
 |
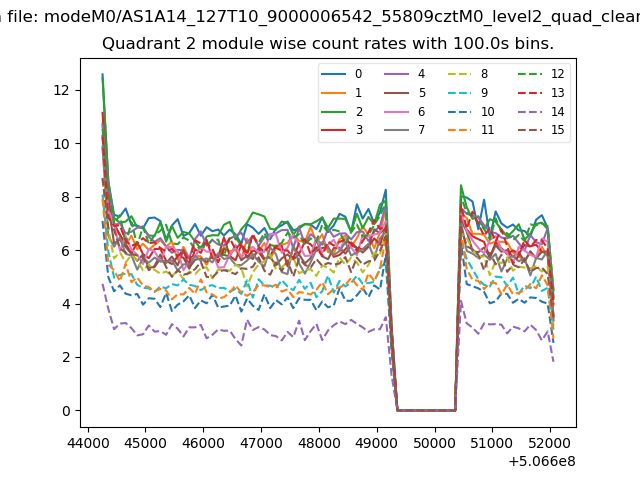
| Module-wise count rates for Quadrant B Data is divided into 100 sec bins |
 |
 |
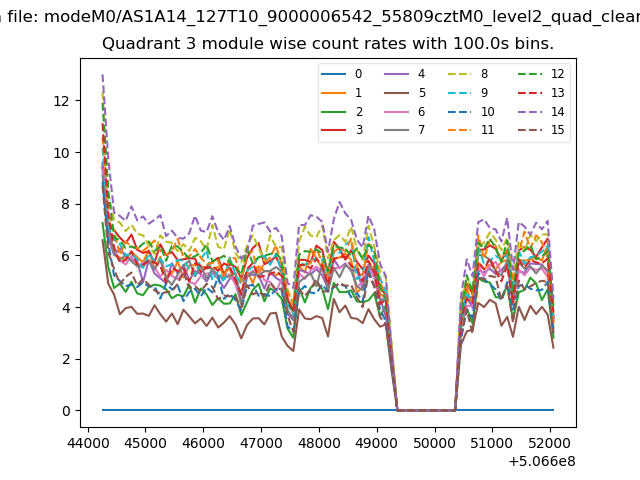
| Module-wise count rates for Quadrant C Data is divided into 100 sec bins |
 |
 |
| Module-wise count rates for Quadrant D Data is divided into 100 sec bins |
 |
 |
| Parameter | Plot |
|---|---|
| CZT HV Monitor | 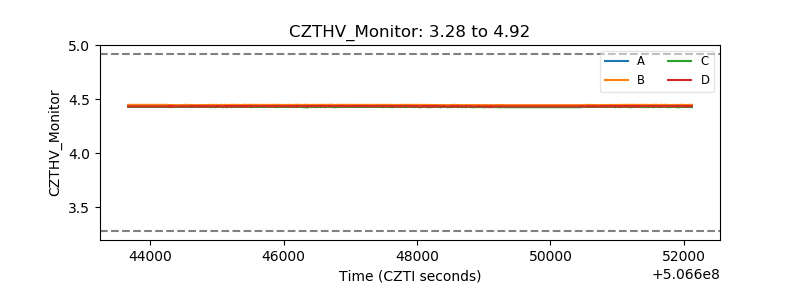 |
| D_VDD | 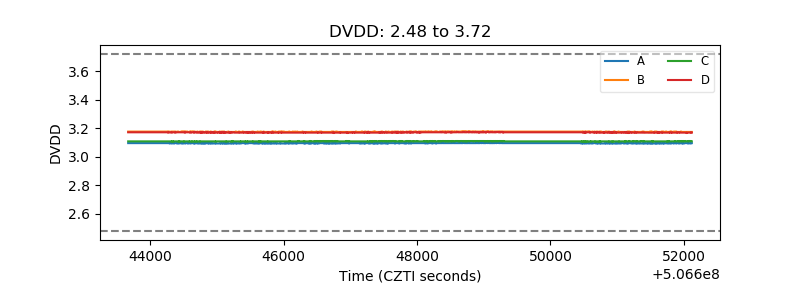 |
| Temperature 1 | 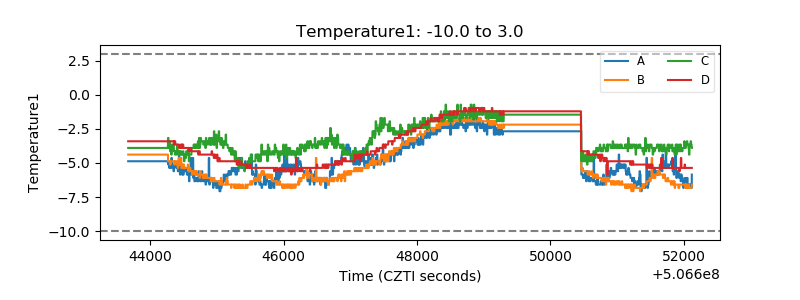 |
| Veto HV Monitor | 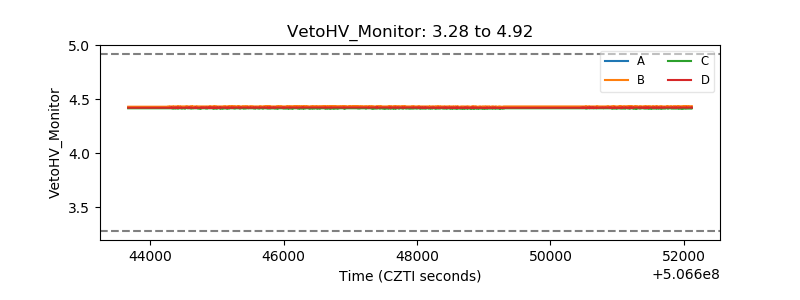 |
| Veto LLD | 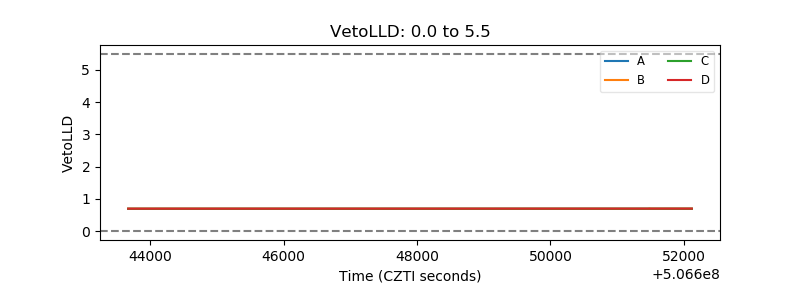 |
| Alpha Counter | 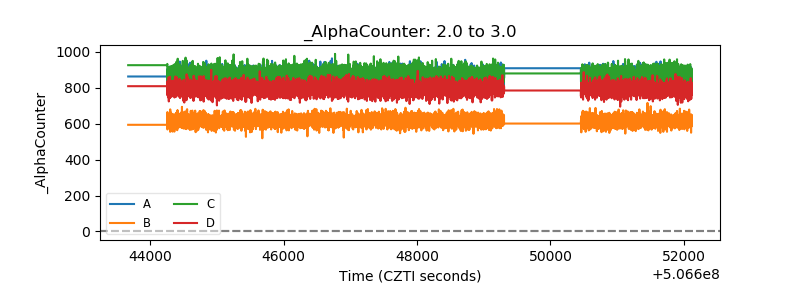 |
| _CPM_Rate | 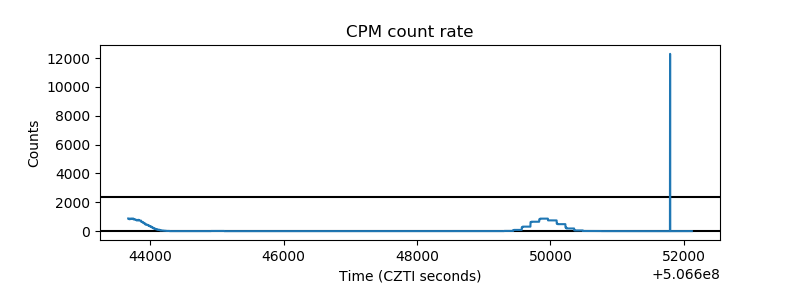 |
| CZT Counter | 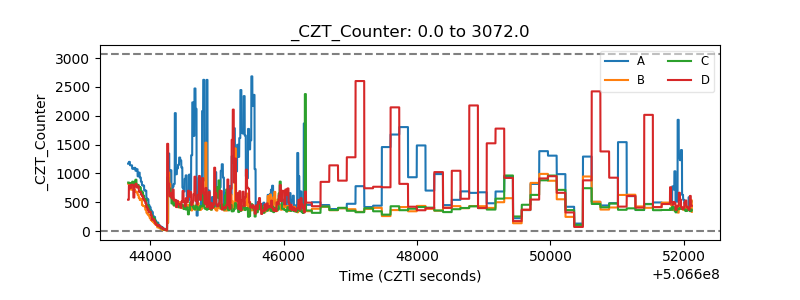 |
| +2.5 Volts monitor |  |
| +5 Volts monitor |  |
| _ROLL_ROT | 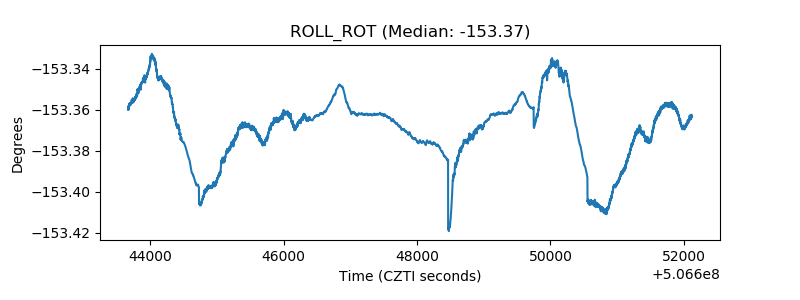 |
| _Roll_DEC | 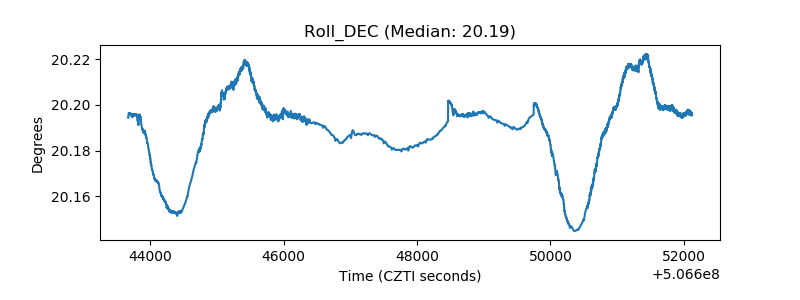 |
| _Roll_RA | 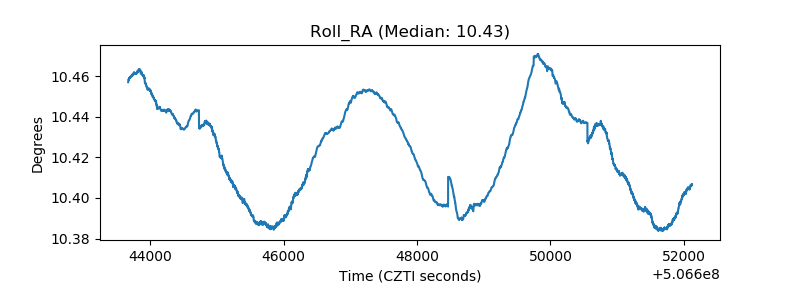 |
| Veto Counter | 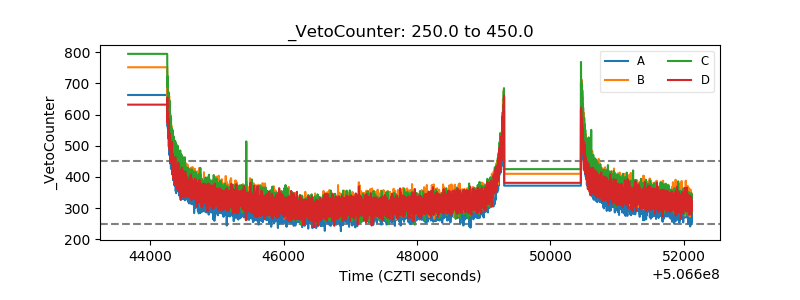 |