| Param | Original file | Final file |
|---|---|---|
| Filename | modeM0/AS1A14_127T10_9000006542_55810cztM0_level2.fits | modeM0/AS1A14_127T10_9000006542_55810cztM0_level2_quad_clean.evt |
| Size (bytes) | 419,662,080 | 97,021,440 |
| Size | 400.2 MB | 92.5 MB |
| Events in quadrant A | 3,913,746 | 618,616 |
| Events in quadrant B | 3,018,114 | 678,801 |
| Events in quadrant C | 3,692,582 | 609,487 |
| Events in quadrant D | 4,386,016 | 561,549 |
| Mode M0 | |||
|---|---|---|---|
| Quadrant | BADHDUFLAG | Total packets | Discarded packets |
| A | 0 | 16230 | 2 |
| B | 0 | 14266 | 2 |
| C | 0 | 16308 | 2 |
| D | 0 | 17949 | 2 |
| Mode M9 | |||
|---|---|---|---|
| Quadrant | BADHDUFLAG | Total packets | Discarded packets |
| A | 0 | 20 | 0 |
| B | 0 | 20 | 0 |
| C | 0 | 21 | 0 |
| D | 0 | 21 | 0 |
| Mode SS | |||
|---|---|---|---|
| Quadrant | BADHDUFLAG | Total packets | Discarded packets |
| A | 0 | 136 | 0 |
| B | 0 | 136 | 0 |
| C | 0 | 136 | 0 |
| D | 0 | 136 | 0 |
| Quadrant | Total seconds | Saturated seconds | Saturation percentage |
|---|---|---|---|
| A | 6738 | 192 | 2.849510% |
| B | 6738 | 104 | 1.543485% |
| C | 6738 | 169 | 2.508163% |
| D | 6738 | 283 | 4.200059% |
Noise dominated data is calculated using 1-second bins in cleaned event files. If a bin has >2000 counts, and if more than 50% of those come from <1% of pixels, then it is considered to be noise-dominated and hence unusable.
| Quadrant | # 1 sec bins | Bins with >0 counts | Bins with >2000 counts | High rate bins dominated by noise | Noise dominated (total time) | Noise dominated (detector-on time) | Marked lightcurve |
|---|---|---|---|---|---|---|---|
| A | 7843 | 6739 | 112 | 112 | 1.43% | 1.66% | 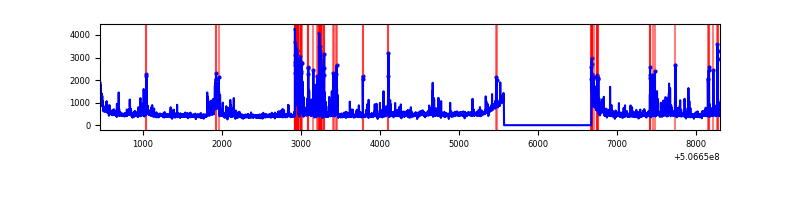 |
| B | 7843 | 6739 | 6 | 6 | 0.08% | 0.09% | 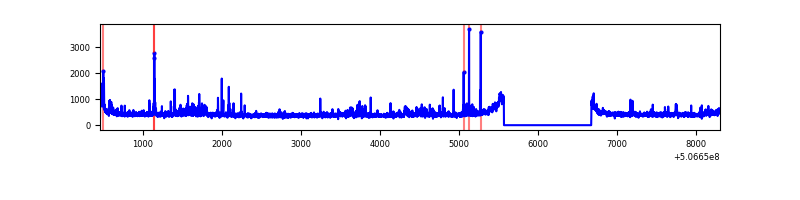 |
| C | 7843 | 6739 | 130 | 130 | 1.66% | 1.93% | 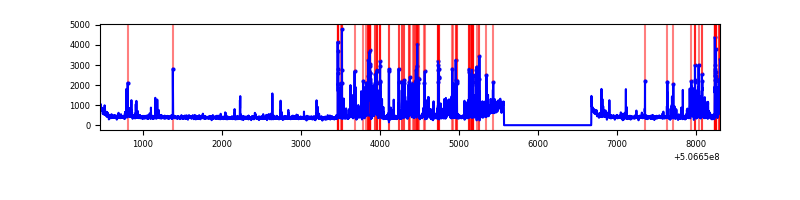 |
| D | 7843 | 6739 | 226 | 226 | 2.88% | 3.35% | 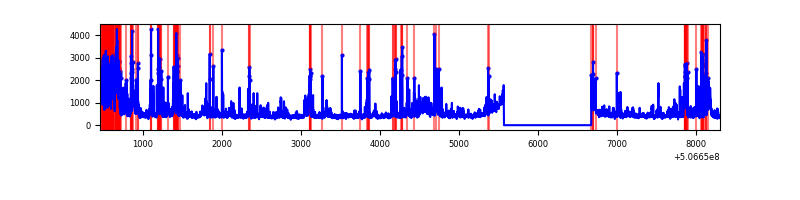 |
Top three noisy pixels from each quadrant. If the there are fewer than three noisy pixels in the level2.evt file, extra rows are filled as -1
| Pixel properties | Quadrant properties | ||||||
|---|---|---|---|---|---|---|---|
| Quadrant | DetID | PixID | Counts | Sigma | Mean | Median | Sigma |
| A | 0 | 8 | 375249 | 2184.37 | 691 | 675 | 171.5 |
| A | 12 | 115 | 234360 | 1362.76 | 691 | 675 | 171.5 |
| A | 8 | 192 | 226736 | 1318.3 | 691 | 675 | 171.5 |
| B | 0 | 213 | 111819 | 743.65 | 693 | 669 | 149.5 |
| B | 7 | 252 | 66527 | 440.62 | 693 | 669 | 149.5 |
| B | 10 | 247 | 29031 | 189.76 | 693 | 669 | 149.5 |
| C | 13 | 3 | 828944 | 4391.12 | 683 | 676 | 188.6 |
| C | 10 | 22 | 81010 | 425.9 | 683 | 676 | 188.6 |
| C | 15 | 200 | 44453 | 232.09 | 683 | 676 | 188.6 |
| D | 11 | 129 | 1375903 | 7290.65 | 670 | 641 | 188.6 |
| D | 7 | 96 | 111662 | 588.55 | 670 | 641 | 188.6 |
| D | 3 | 12 | 67593 | 354.93 | 670 | 641 | 188.6 |
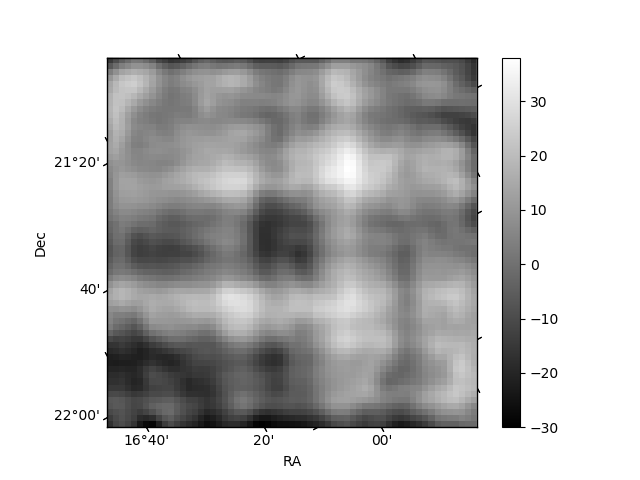
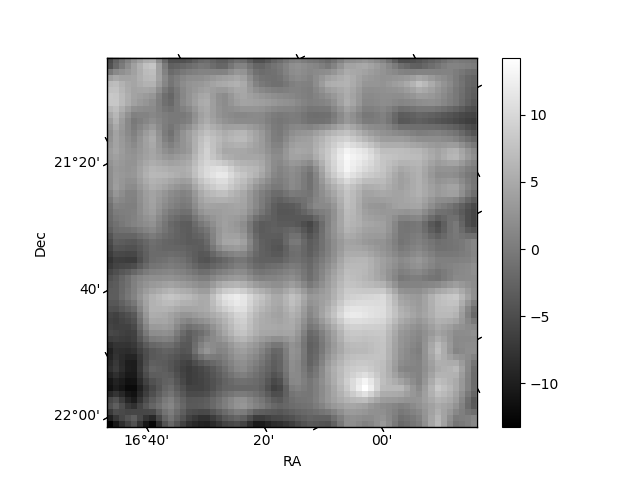
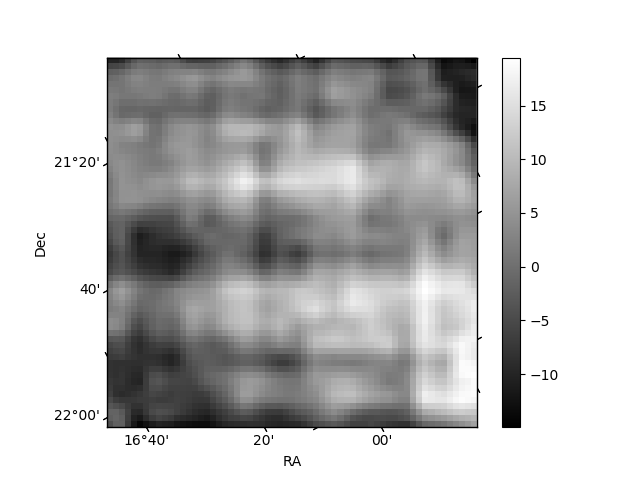
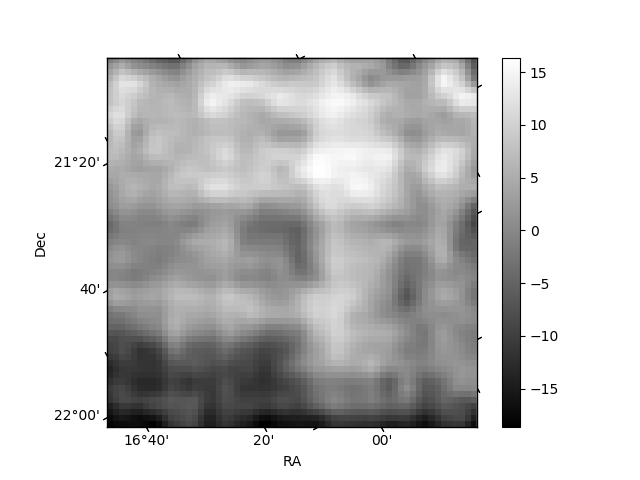
Histogram calculated using DETX and DETY for each event in the final _common_clean file
| Quadrant A | 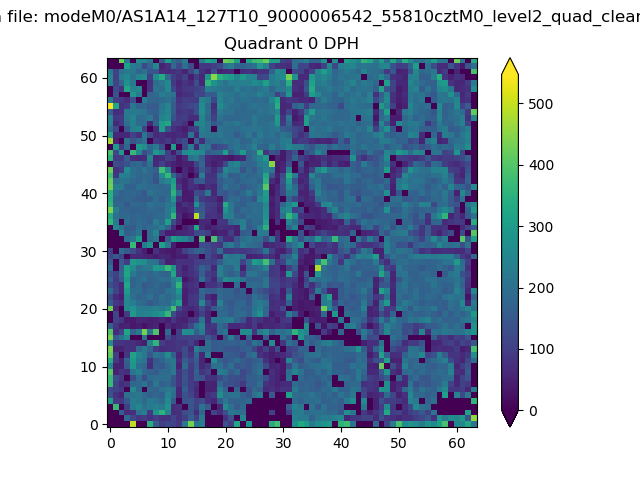 |
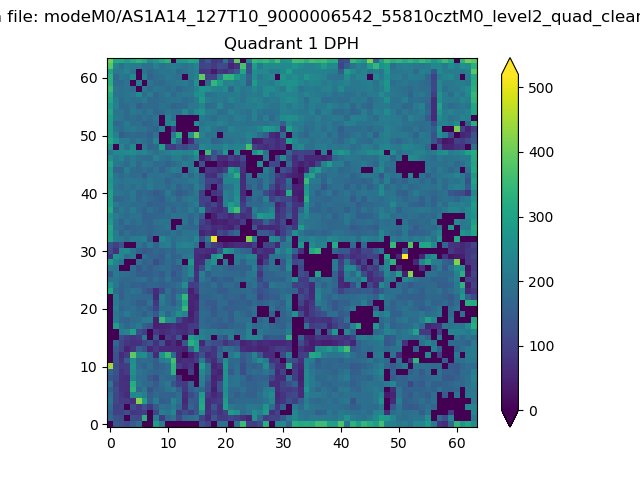 |
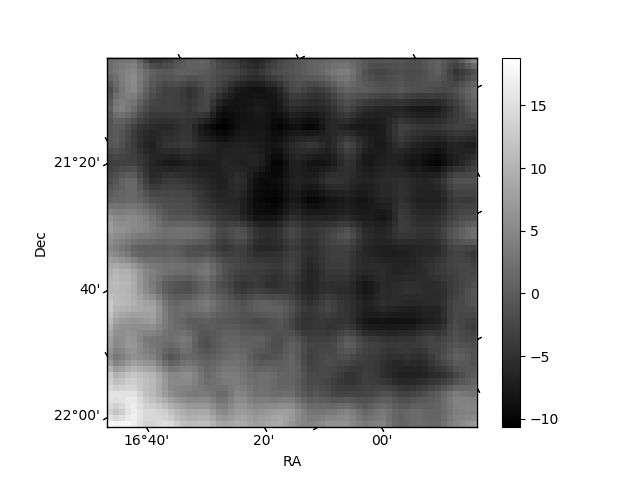
Quadrant B |
|---|---|---|---|
| Quadrant D | 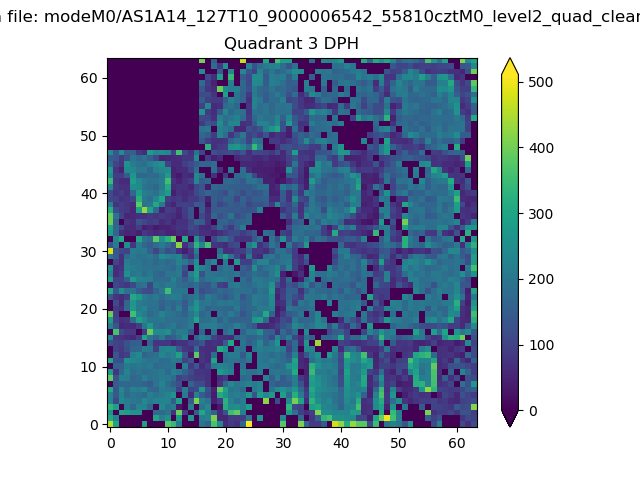 |
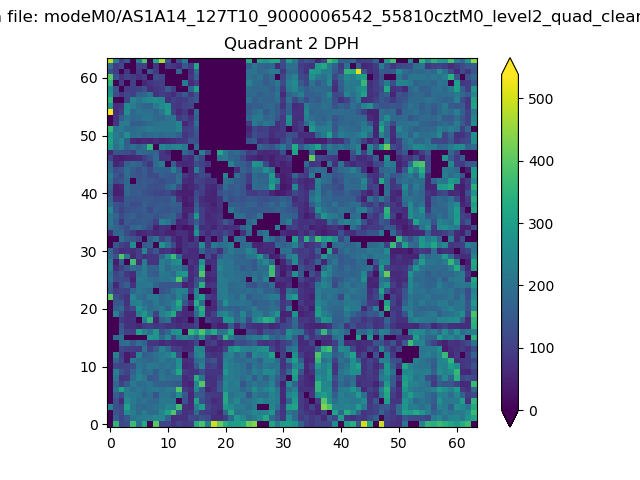 |
Quadrant C |
| Plot type | Count rate plots | Images |
|---|---|---|
| Comparison with Poisson distribution Blue bars denote a histogram of data divided into 1 sec bins. Red curve is a Poisson curve with rate = median count rate of data. |
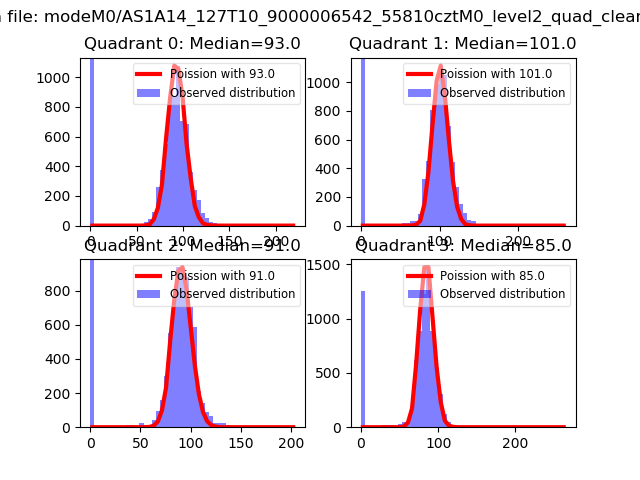 |
 |
| Quadrant-wise count rates Data is divided into 100 sec bins |
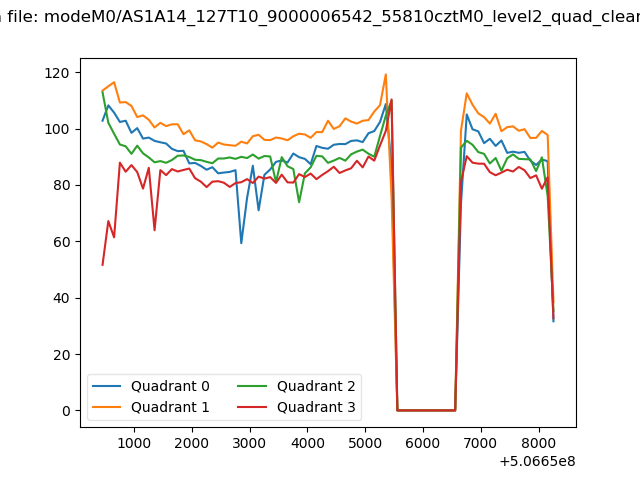 |
|
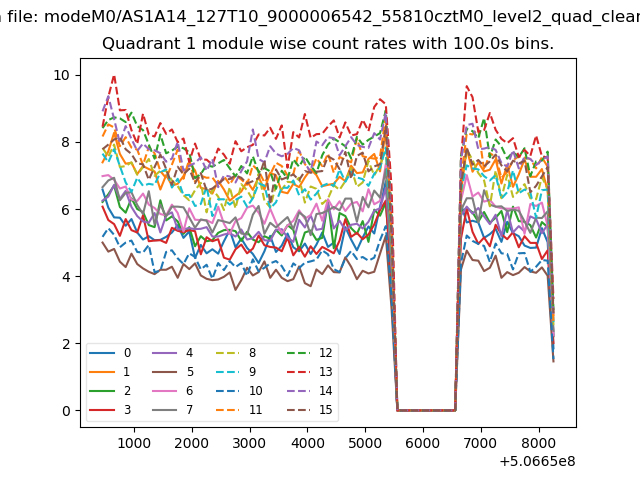
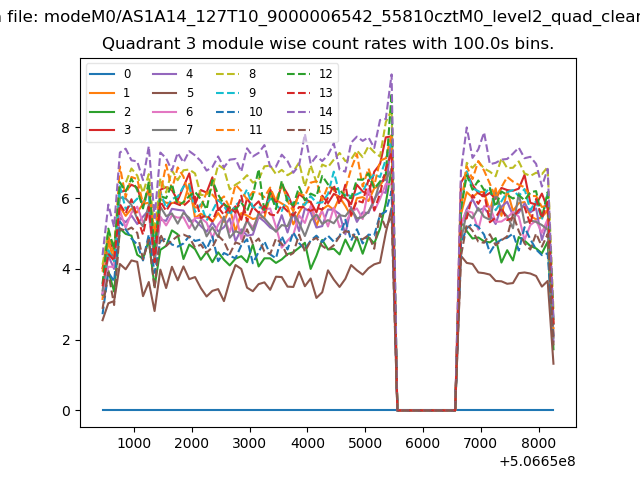
| Module-wise count rates for Quadrant A Data is divided into 100 sec bins |
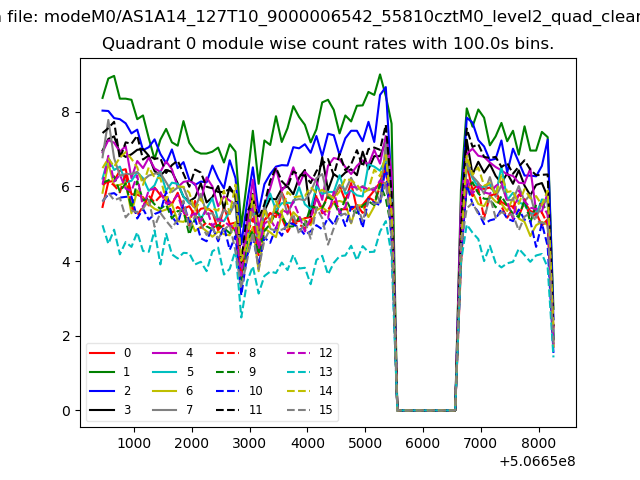 |
 |
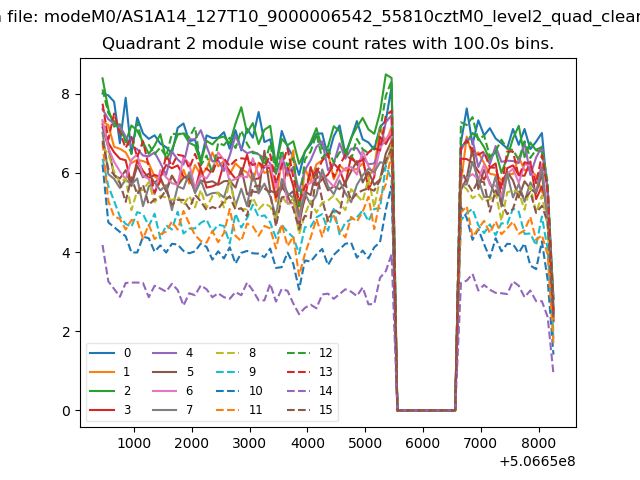
| Module-wise count rates for Quadrant B Data is divided into 100 sec bins |
 |
 |
| Module-wise count rates for Quadrant C Data is divided into 100 sec bins |
 |
 |
| Module-wise count rates for Quadrant D Data is divided into 100 sec bins |
 |
 |
| Parameter | Plot |
|---|---|
| CZT HV Monitor | 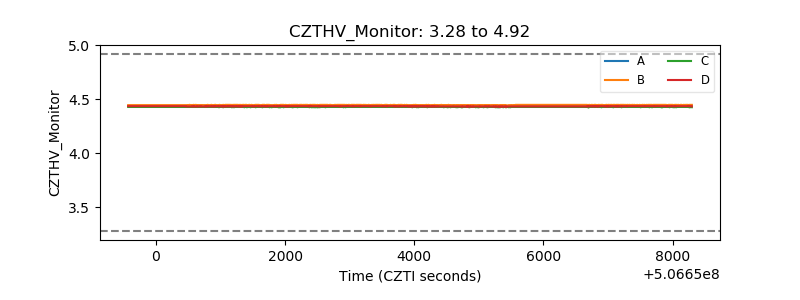 |
| D_VDD | 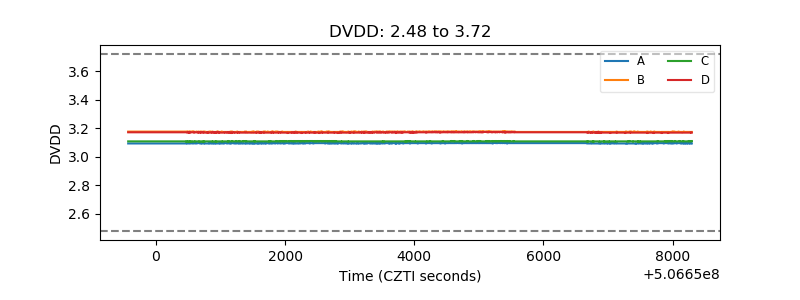 |
| Temperature 1 | 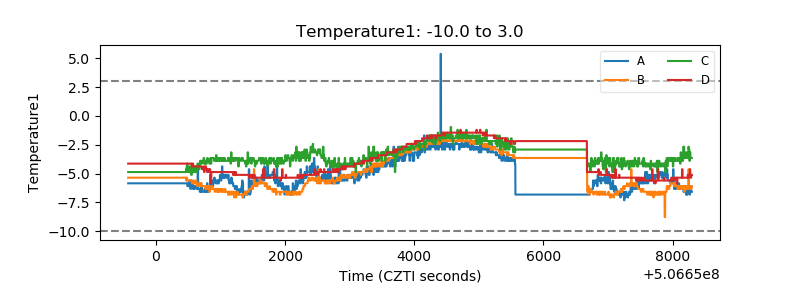 |
| Veto HV Monitor | 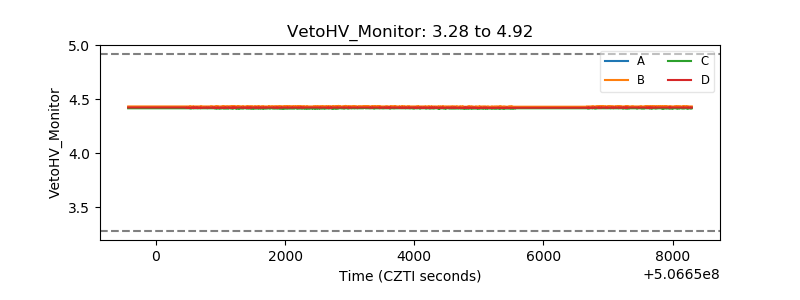 |
| Veto LLD | 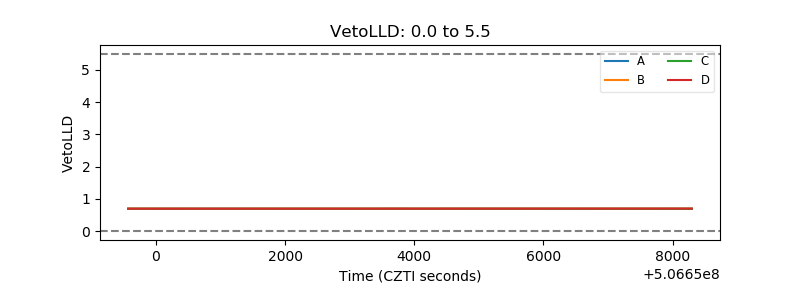 |
| Alpha Counter | 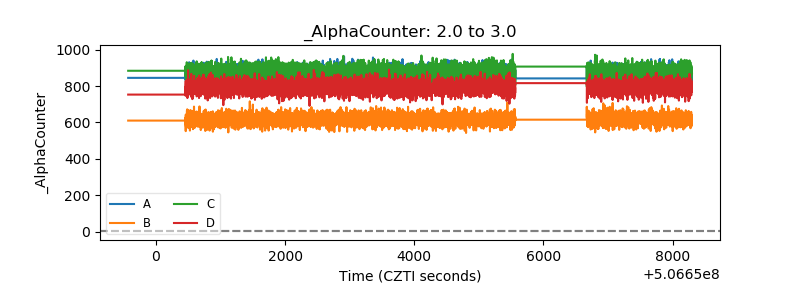 |
| _CPM_Rate | 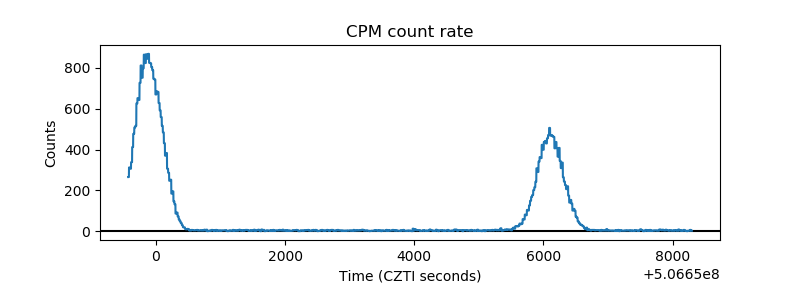 |
| CZT Counter | 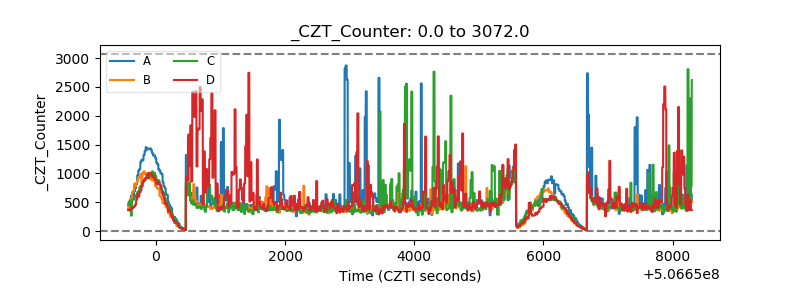 |
| +2.5 Volts monitor |  |
| +5 Volts monitor |  |
| _ROLL_ROT | 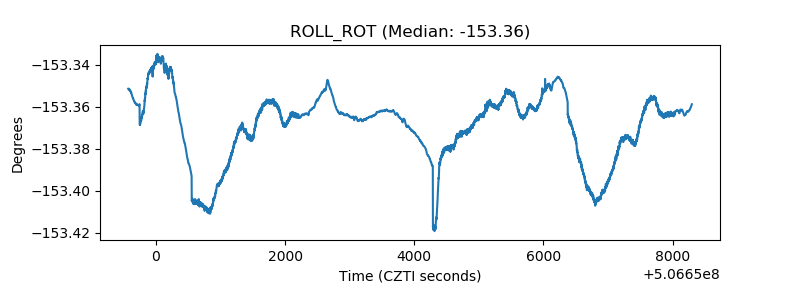 |
| _Roll_DEC | 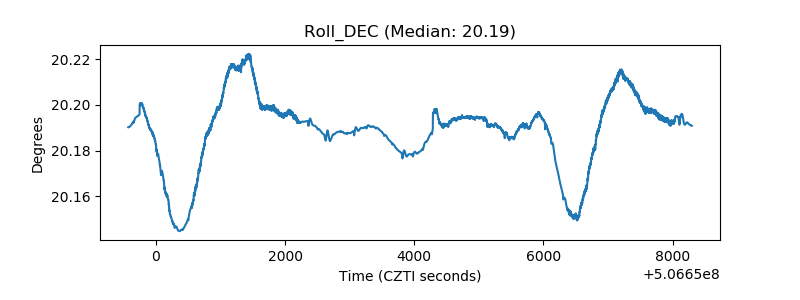 |
| _Roll_RA | 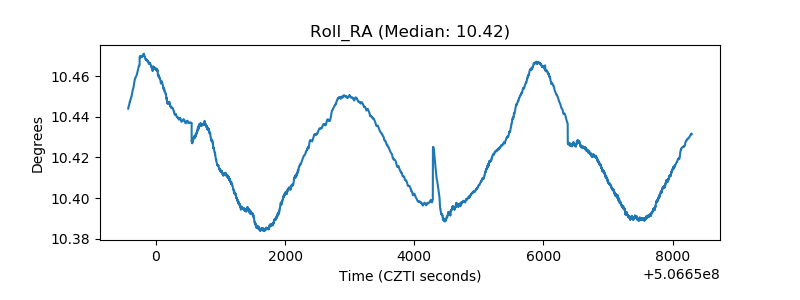 |
| Veto Counter | 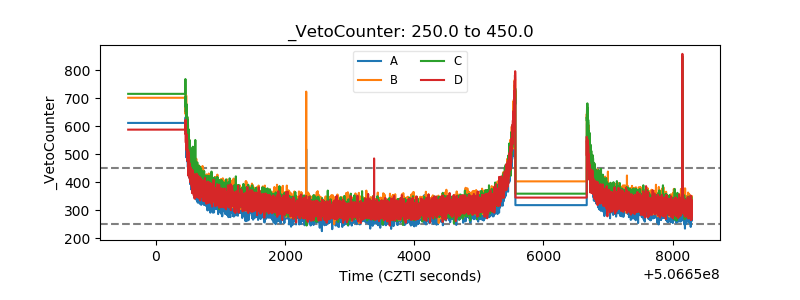 |