| Param | Original file | Final file |
|---|---|---|
| Filename | modeM0/AS1A14_127T10_9000006542_55811cztM0_level2.fits | modeM0/AS1A14_127T10_9000006542_55811cztM0_level2_quad_clean.evt |
| Size (bytes) | 441,987,840 | 96,183,360 |
| Size | 421.5 MB | 91.7 MB |
| Events in quadrant A | 4,696,140 | 598,041 |
| Events in quadrant B | 3,301,728 | 665,723 |
| Events in quadrant C | 3,203,856 | 610,087 |
| Events in quadrant D | 4,629,587 | 564,057 |
| Mode M0 | |||
|---|---|---|---|
| Quadrant | BADHDUFLAG | Total packets | Discarded packets |
| A | 0 | 18670 | 2 |
| B | 0 | 15116 | 2 |
| C | 0 | 15125 | 2 |
| D | 0 | 18635 | 2 |
| Mode M9 | |||
|---|---|---|---|
| Quadrant | BADHDUFLAG | Total packets | Discarded packets |
| A | 0 | 21 | 0 |
| B | 0 | 21 | 0 |
| C | 0 | 21 | 0 |
| D | 0 | 21 | 0 |
| Mode SS | |||
|---|---|---|---|
| Quadrant | BADHDUFLAG | Total packets | Discarded packets |
| A | 0 | 140 | 0 |
| B | 0 | 140 | 0 |
| C | 0 | 140 | 0 |
| D | 0 | 140 | 0 |
| Quadrant | Total seconds | Saturated seconds | Saturation percentage |
|---|---|---|---|
| A | 6810 | 415 | 6.093979% |
| B | 6811 | 204 | 2.995155% |
| C | 6811 | 139 | 2.040816% |
| D | 6810 | 251 | 3.685756% |
Noise dominated data is calculated using 1-second bins in cleaned event files. If a bin has >2000 counts, and if more than 50% of those come from <1% of pixels, then it is considered to be noise-dominated and hence unusable.
| Quadrant | # 1 sec bins | Bins with >0 counts | Bins with >2000 counts | High rate bins dominated by noise | Noise dominated (total time) | Noise dominated (detector-on time) | Marked lightcurve |
|---|---|---|---|---|---|---|---|
| A | 8850 | 6812 | 222 | 222 | 2.51% | 3.26% | 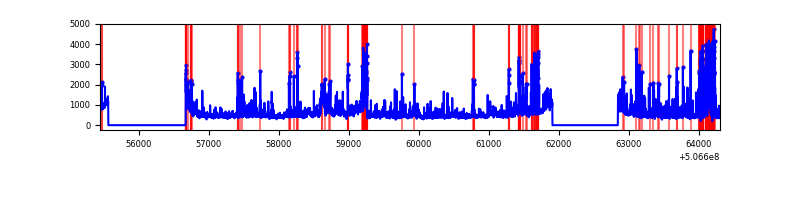 |
| B | 8851 | 6813 | 12 | 12 | 0.14% | 0.18% | 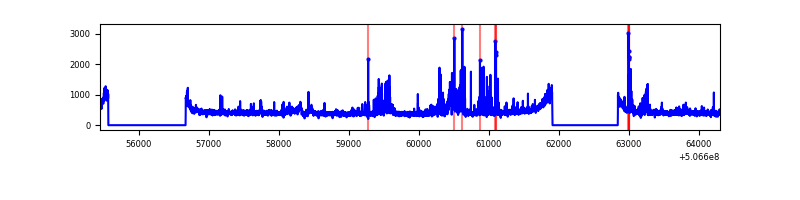 |
| C | 8851 | 6813 | 43 | 43 | 0.49% | 0.63% | 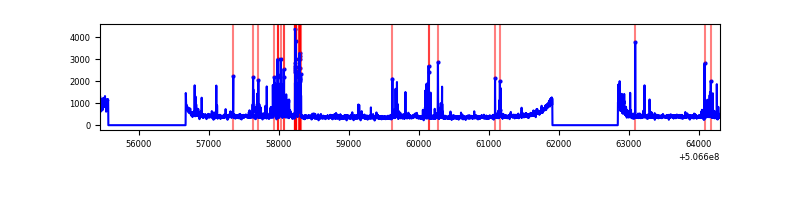 |
| D | 8850 | 6812 | 148 | 148 | 1.67% | 2.17% | 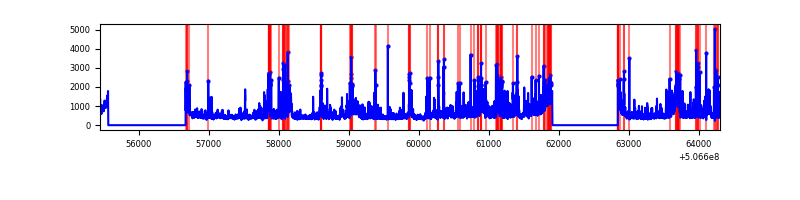 |
Top three noisy pixels from each quadrant. If the there are fewer than three noisy pixels in the level2.evt file, extra rows are filled as -1
| Pixel properties | Quadrant properties | ||||||
|---|---|---|---|---|---|---|---|
| Quadrant | DetID | PixID | Counts | Sigma | Mean | Median | Sigma |
| A | 0 | 8 | 581066 | 3297.17 | 708 | 690 | 176.0 |
| A | 12 | 115 | 437803 | 2483.28 | 708 | 690 | 176.0 |
| A | 15 | 32 | 429364 | 2435.34 | 708 | 690 | 176.0 |
| B | 5 | 185 | 177986 | 1146.0 | 712 | 686 | 154.7 |
| B | 0 | 213 | 171347 | 1103.09 | 712 | 686 | 154.7 |
| B | 10 | 247 | 47765 | 304.3 | 712 | 686 | 154.7 |
| C | 13 | 3 | 232678 | 1195.59 | 706 | 701 | 194.0 |
| C | 10 | 22 | 99612 | 509.78 | 706 | 701 | 194.0 |
| C | 14 | 254 | 50241 | 255.32 | 706 | 701 | 194.0 |
| D | 11 | 129 | 1035667 | 5243.29 | 693 | 665 | 197.4 |
| D | 8 | 245 | 198876 | 1004.13 | 693 | 665 | 197.4 |
| D | 7 | 96 | 185713 | 937.45 | 693 | 665 | 197.4 |
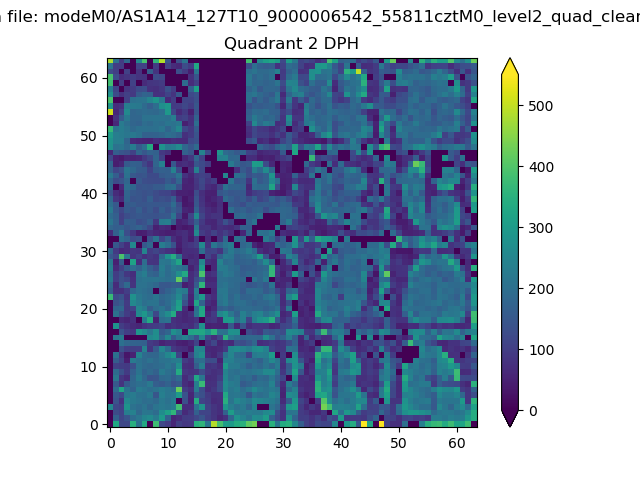
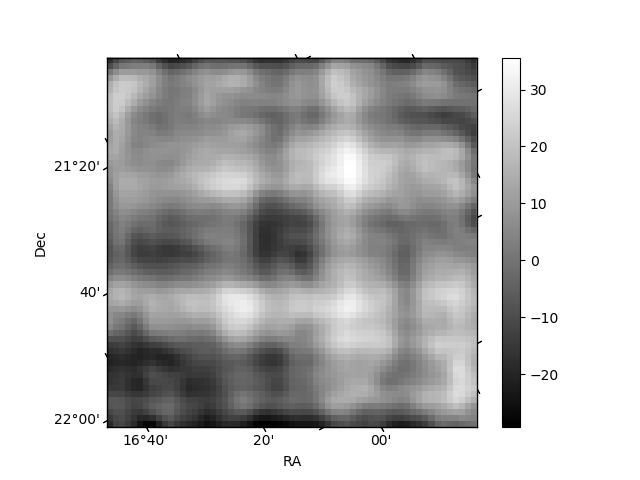
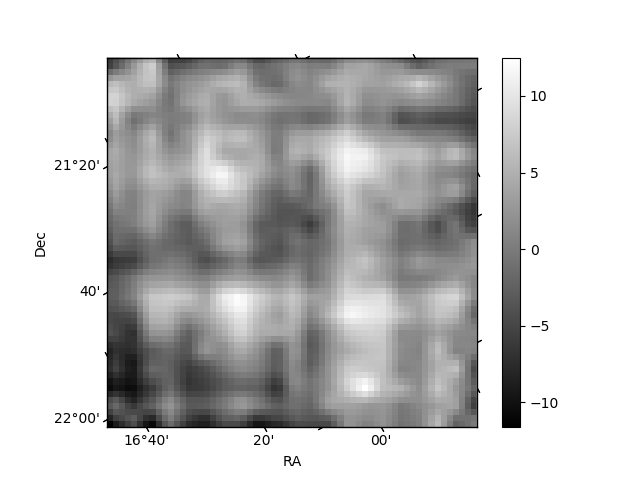
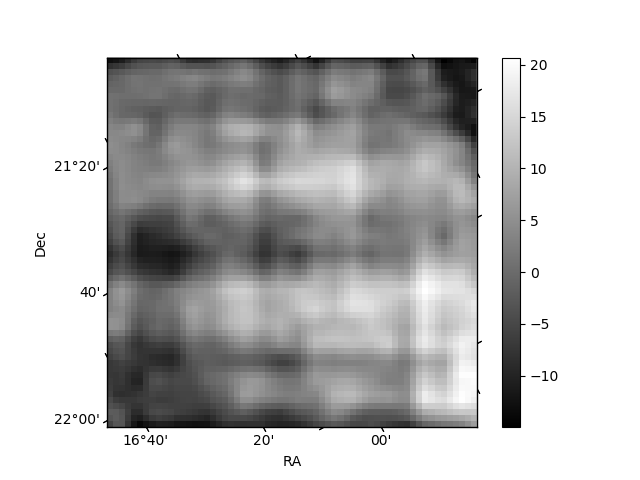
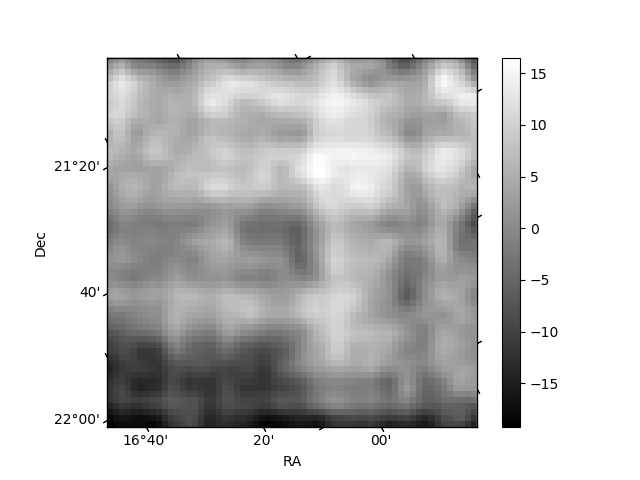
Histogram calculated using DETX and DETY for each event in the final _common_clean file
| Quadrant A | 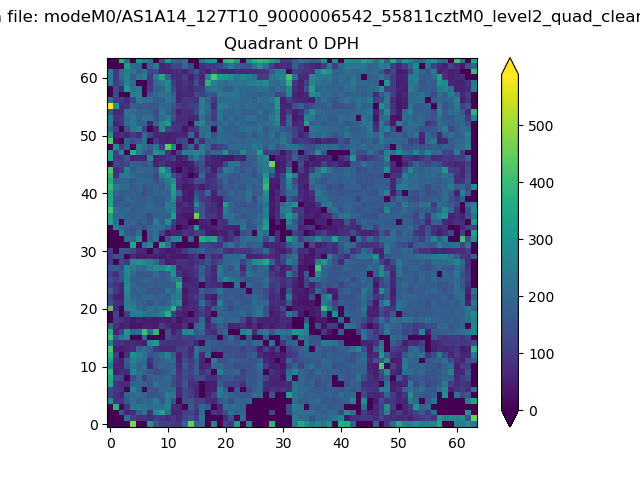 |
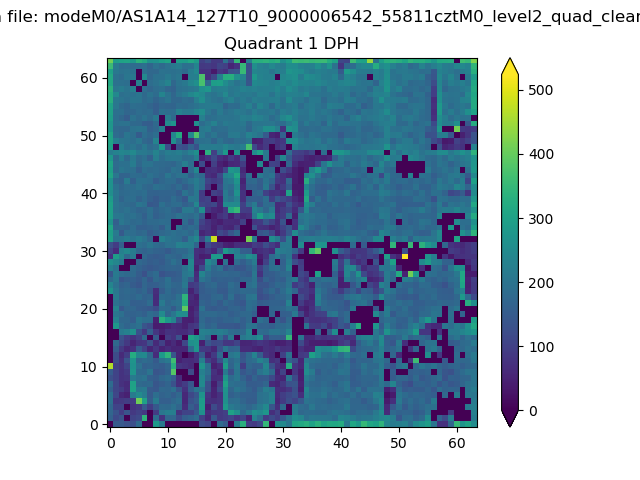 |
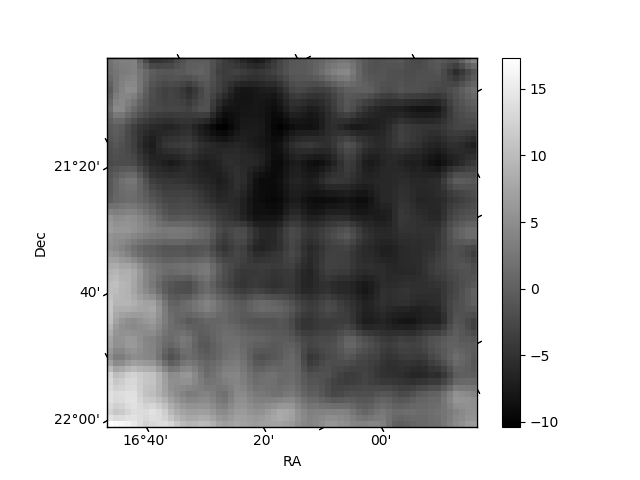
Quadrant B |
|---|---|---|---|
| Quadrant D | 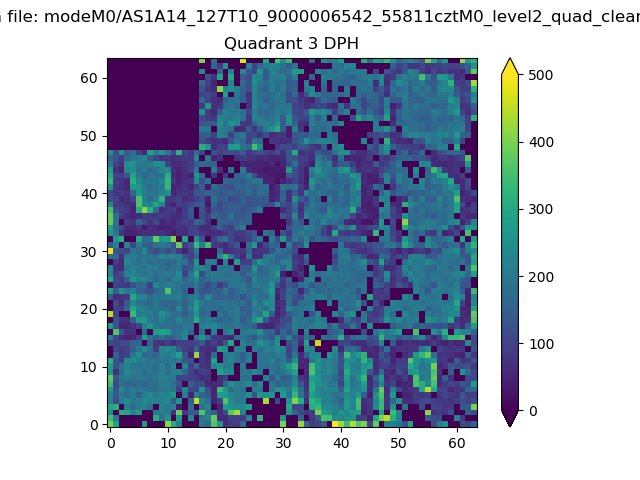 |
 |
Quadrant C |
| Plot type | Count rate plots | Images |
|---|---|---|
| Comparison with Poisson distribution Blue bars denote a histogram of data divided into 1 sec bins. Red curve is a Poisson curve with rate = median count rate of data. |
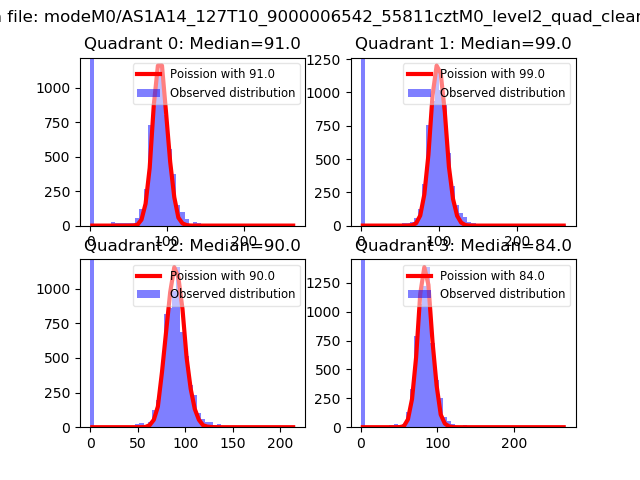 |
 |
| Quadrant-wise count rates Data is divided into 100 sec bins |
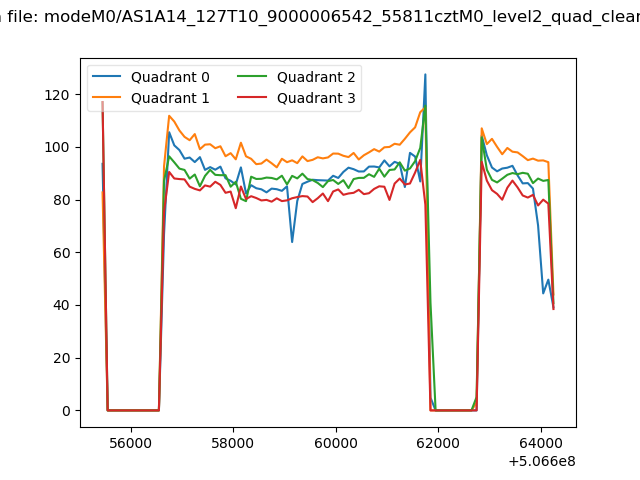 |
|
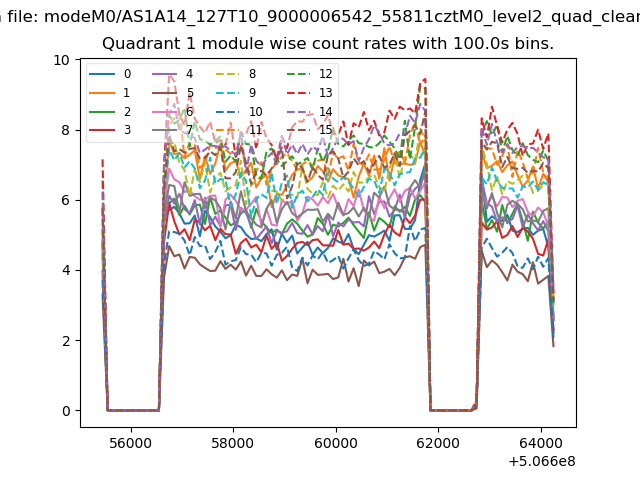
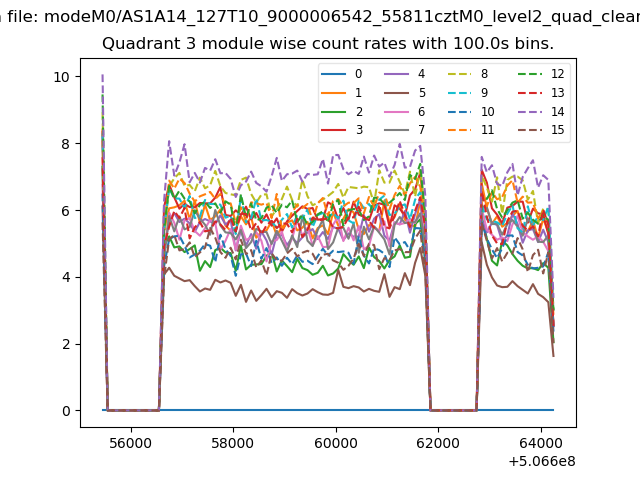
| Module-wise count rates for Quadrant A Data is divided into 100 sec bins |
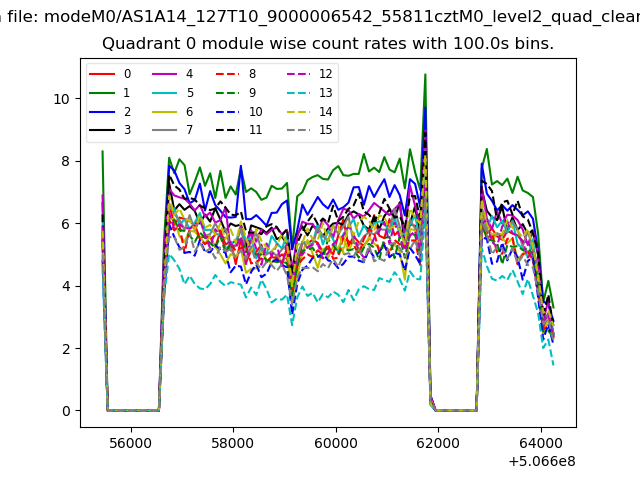 |
 |
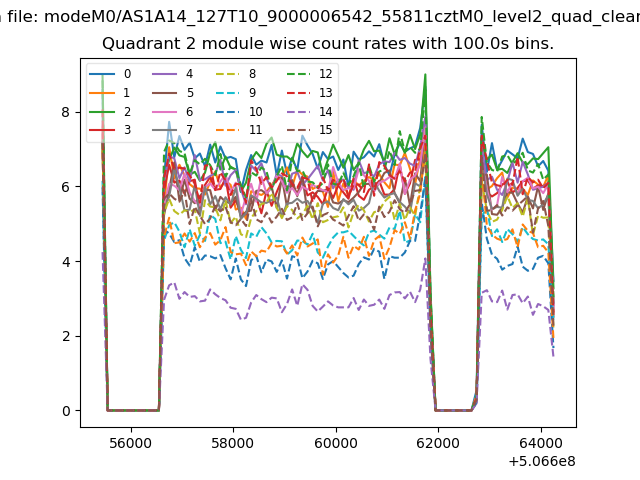
| Module-wise count rates for Quadrant B Data is divided into 100 sec bins |
 |
 |
| Module-wise count rates for Quadrant C Data is divided into 100 sec bins |
 |
 |
| Module-wise count rates for Quadrant D Data is divided into 100 sec bins |
 |
 |
| Parameter | Plot |
|---|---|
| CZT HV Monitor | 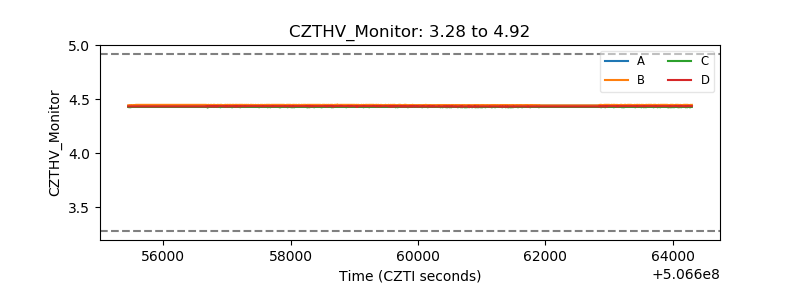 |
| D_VDD | 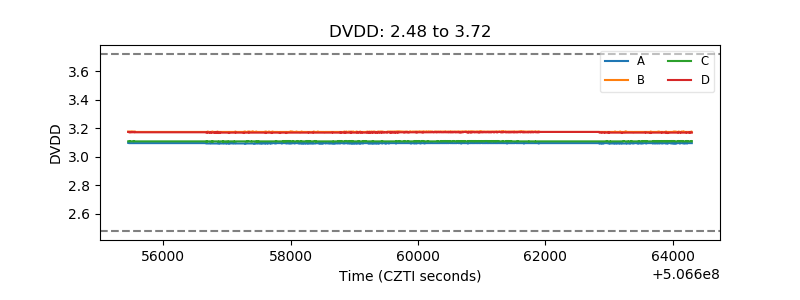 |
| Temperature 1 | 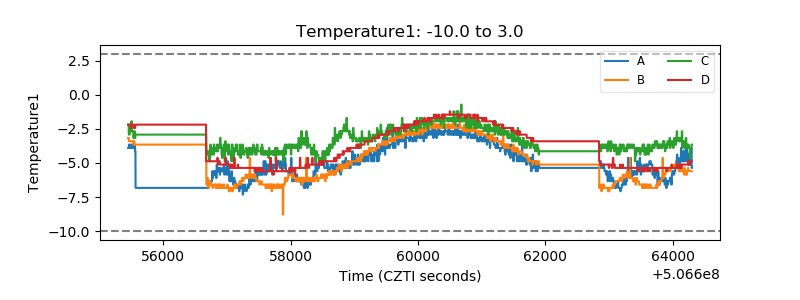 |
| Veto HV Monitor | 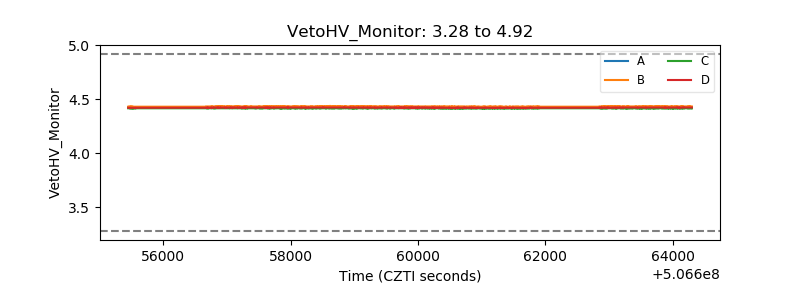 |
| Veto LLD | 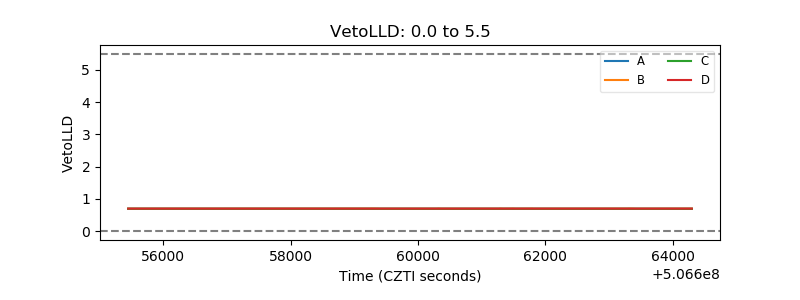 |
| Alpha Counter | 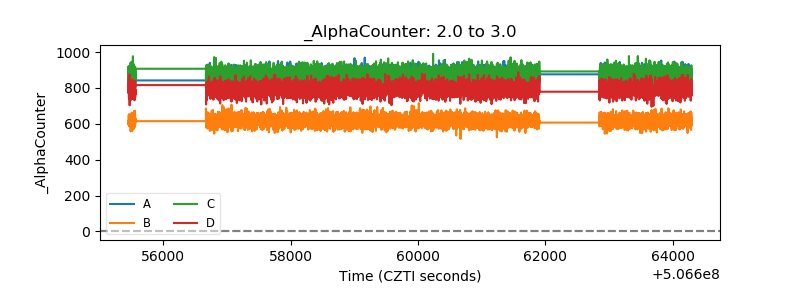 |
| _CPM_Rate | 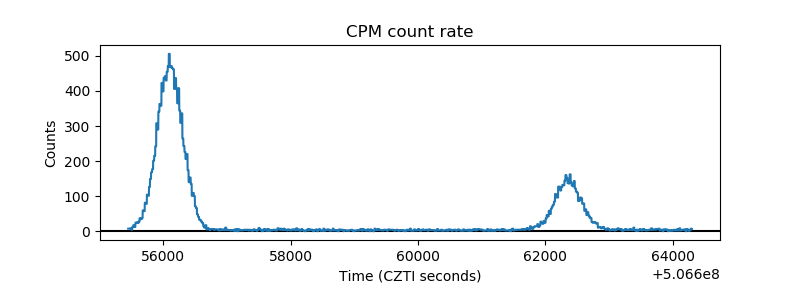 |
| CZT Counter | 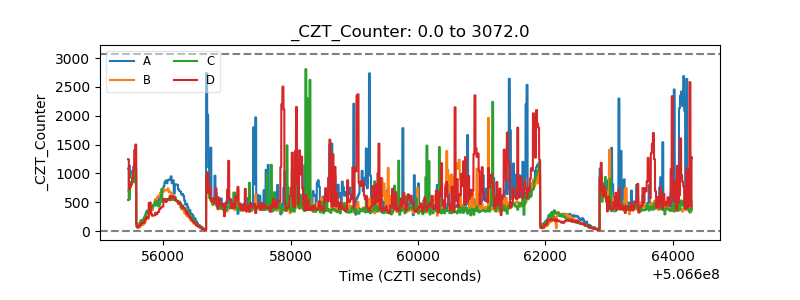 |
| +2.5 Volts monitor |  |
| +5 Volts monitor | 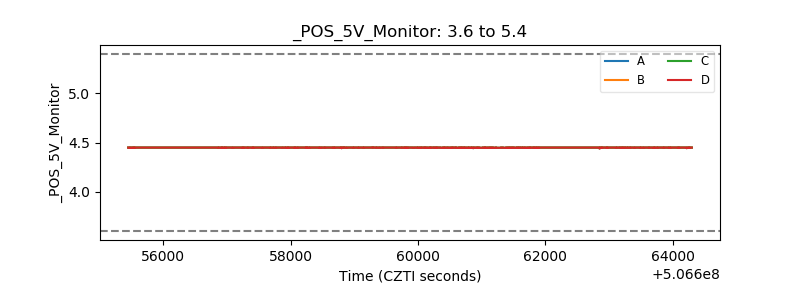 |
| _ROLL_ROT | 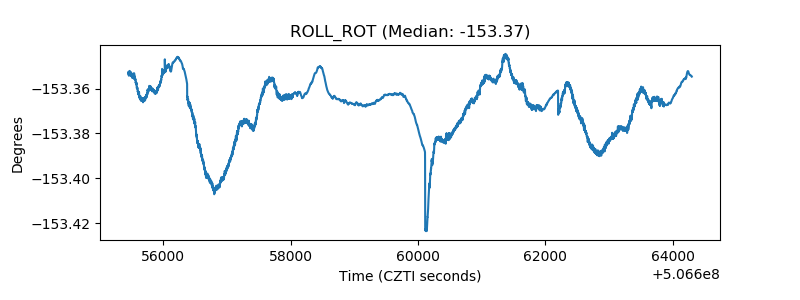 |
| _Roll_DEC | 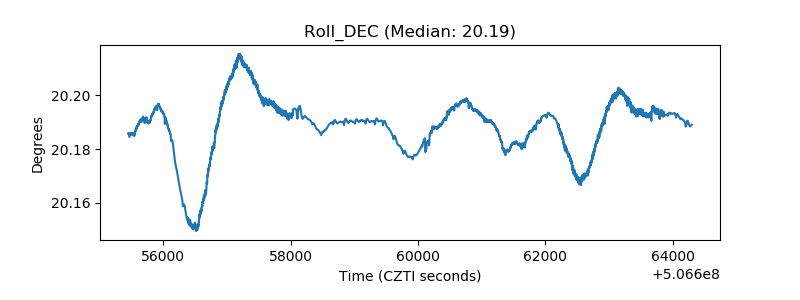 |
| _Roll_RA | 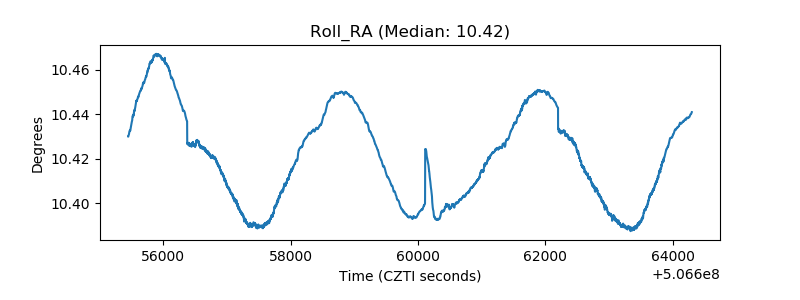 |
| Veto Counter | 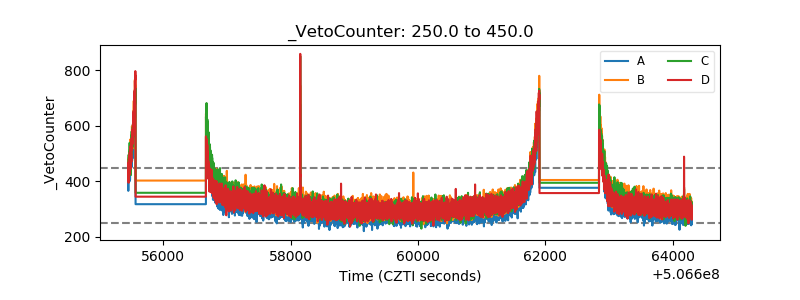 |