| Param | Original file | Final file |
|---|---|---|
| Filename | modeM0/AS1A14_127T10_9000006542_55812cztM0_level2.fits | modeM0/AS1A14_127T10_9000006542_55812cztM0_level2_quad_clean.evt |
| Size (bytes) | 564,096,960 | 109,270,080 |
| Size | 538.0 MB | 104.2 MB |
| Events in quadrant A | 5,373,130 | 713,424 |
| Events in quadrant B | 3,951,634 | 758,496 |
| Events in quadrant C | 4,893,290 | 663,998 |
| Events in quadrant D | 6,070,925 | 642,038 |
| Mode M0 | |||
|---|---|---|---|
| Quadrant | BADHDUFLAG | Total packets | Discarded packets |
| A | 0 | 21251 | 2 |
| B | 0 | 17668 | 2 |
| C | 0 | 20580 | 2 |
| D | 0 | 23441 | 2 |
| Mode M9 | |||
|---|---|---|---|
| Quadrant | BADHDUFLAG | Total packets | Discarded packets |
| A | 0 | 13 | 0 |
| B | 0 | 13 | 0 |
| C | 0 | 13 | 0 |
| D | 0 | 13 | 0 |
| Mode SS | |||
|---|---|---|---|
| Quadrant | BADHDUFLAG | Total packets | Discarded packets |
| A | 0 | 158 | 0 |
| B | 0 | 158 | 0 |
| C | 0 | 158 | 0 |
| D | 0 | 158 | 0 |
| Quadrant | Total seconds | Saturated seconds | Saturation percentage |
|---|---|---|---|
| A | 7623 | 569 | 7.464253% |
| B | 7624 | 439 | 5.758132% |
| C | 7624 | 603 | 7.909234% |
| D | 7624 | 595 | 7.804302% |
Noise dominated data is calculated using 1-second bins in cleaned event files. If a bin has >2000 counts, and if more than 50% of those come from <1% of pixels, then it is considered to be noise-dominated and hence unusable.
| Quadrant | # 1 sec bins | Bins with >0 counts | Bins with >2000 counts | High rate bins dominated by noise | Noise dominated (total time) | Noise dominated (detector-on time) | Marked lightcurve |
|---|---|---|---|---|---|---|---|
| A | 9008 | 7625 | 250 | 250 | 2.78% | 3.28% | 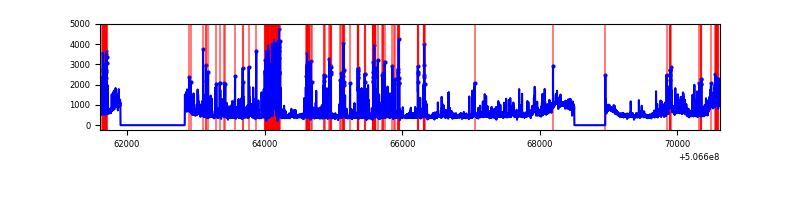 |
| B | 9009 | 7626 | 93 | 93 | 1.03% | 1.22% | 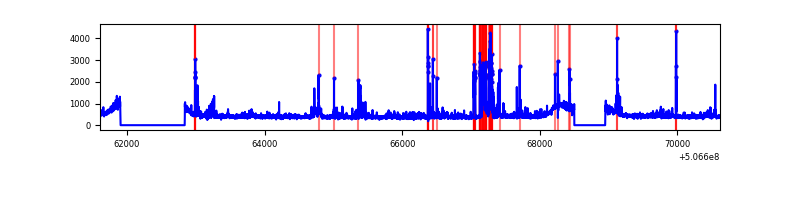 |
| C | 9009 | 7626 | 357 | 357 | 3.96% | 4.68% | 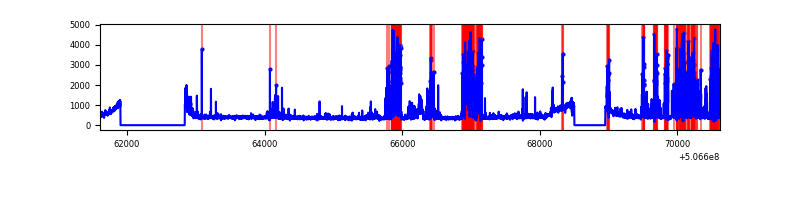 |
| D | 9009 | 7626 | 335 | 335 | 3.72% | 4.39% | 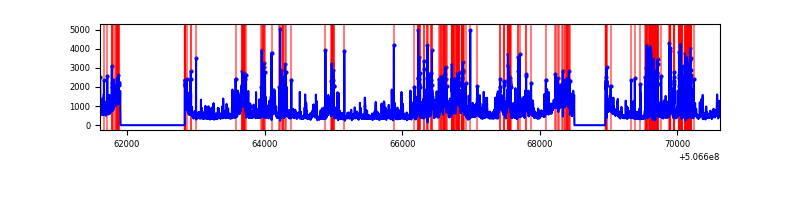 |
Top three noisy pixels from each quadrant. If the there are fewer than three noisy pixels in the level2.evt file, extra rows are filled as -1
| Pixel properties | Quadrant properties | ||||||
|---|---|---|---|---|---|---|---|
| Quadrant | DetID | PixID | Counts | Sigma | Mean | Median | Sigma |
| A | 0 | 8 | 624879 | 3000.02 | 830 | 809 | 208.0 |
| A | 15 | 32 | 481322 | 2309.91 | 830 | 809 | 208.0 |
| A | 12 | 115 | 392698 | 1883.88 | 830 | 809 | 208.0 |
| B | 5 | 185 | 355420 | 1967.84 | 817 | 786 | 180.2 |
| B | 0 | 213 | 170515 | 941.82 | 817 | 786 | 180.2 |
| B | 10 | 247 | 122537 | 675.59 | 817 | 786 | 180.2 |
| C | 13 | 3 | 1138490 | 5197.65 | 795 | 789 | 218.9 |
| C | 12 | 252 | 351711 | 1603.21 | 795 | 789 | 218.9 |
| C | 15 | 200 | 133540 | 606.48 | 795 | 789 | 218.9 |
| D | 11 | 129 | 1509091 | 6688.03 | 790 | 754 | 225.5 |
| D | 8 | 160 | 514128 | 2276.32 | 790 | 754 | 225.5 |
| D | 8 | 245 | 457474 | 2025.12 | 790 | 754 | 225.5 |
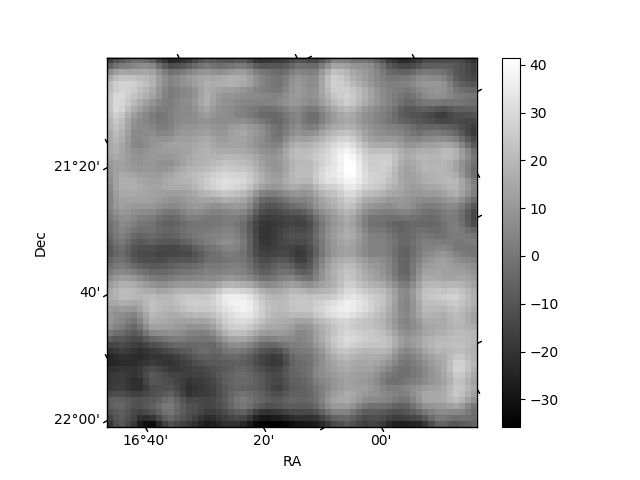
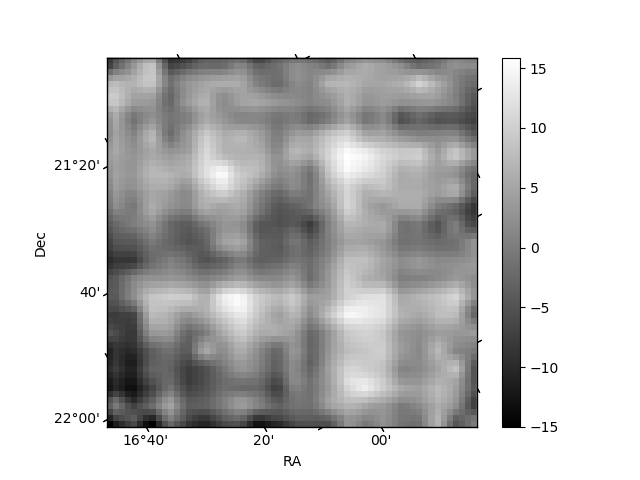
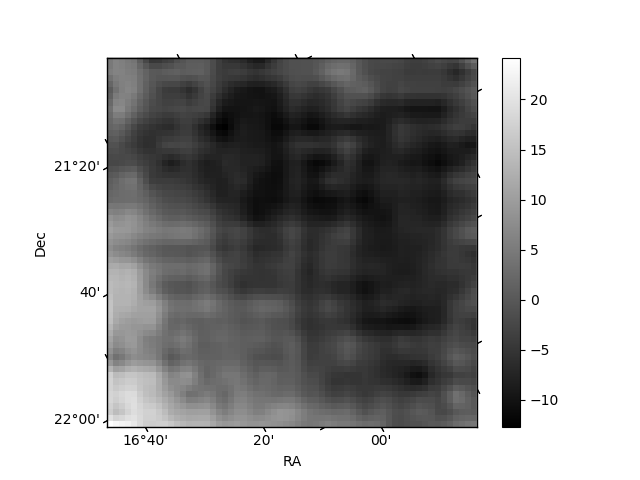
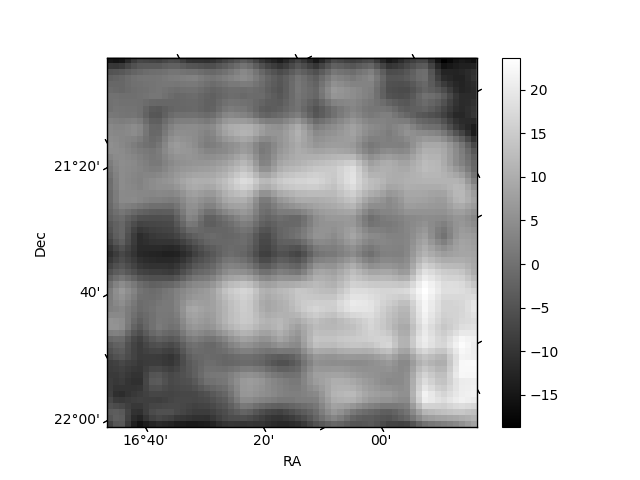
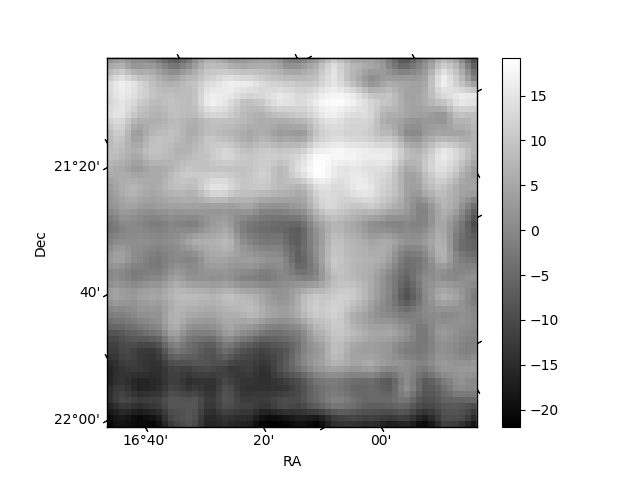
Histogram calculated using DETX and DETY for each event in the final _common_clean file
| Quadrant A | 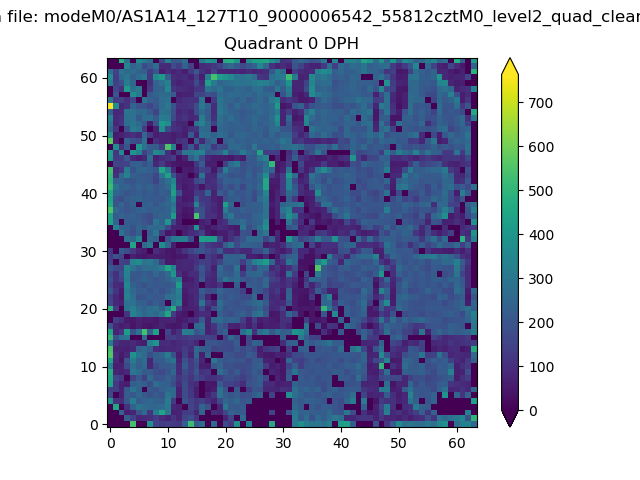 |
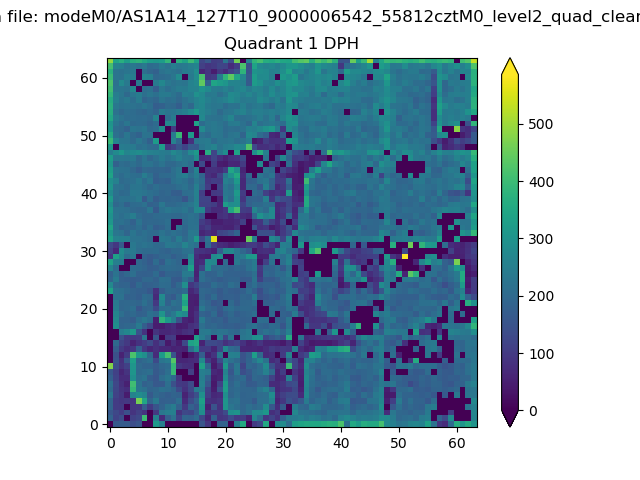 |
Quadrant B |
|---|---|---|---|
| Quadrant D | 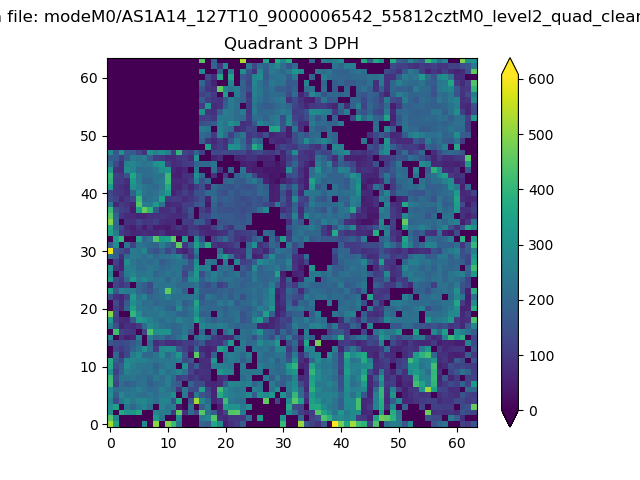 |
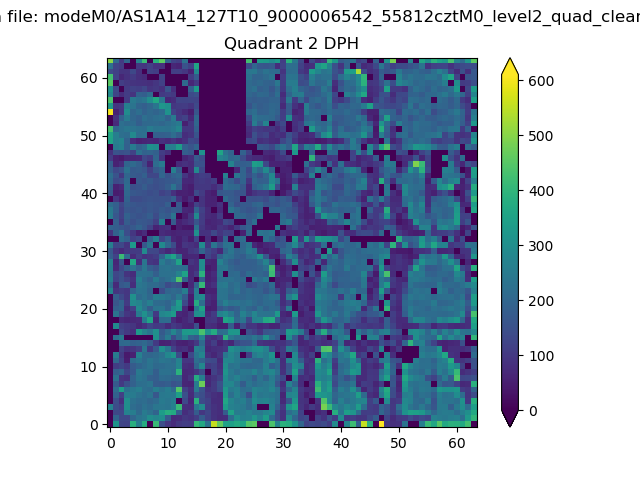 |
Quadrant C |
| Plot type | Count rate plots | Images |
|---|---|---|
| Comparison with Poisson distribution Blue bars denote a histogram of data divided into 1 sec bins. Red curve is a Poisson curve with rate = median count rate of data. |
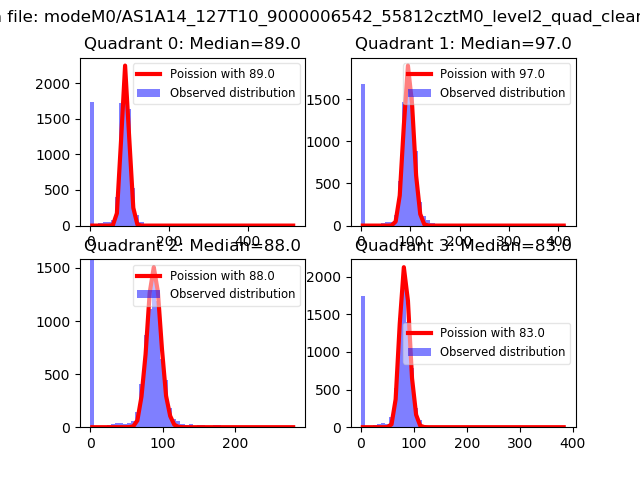 |
 |
| Quadrant-wise count rates Data is divided into 100 sec bins |
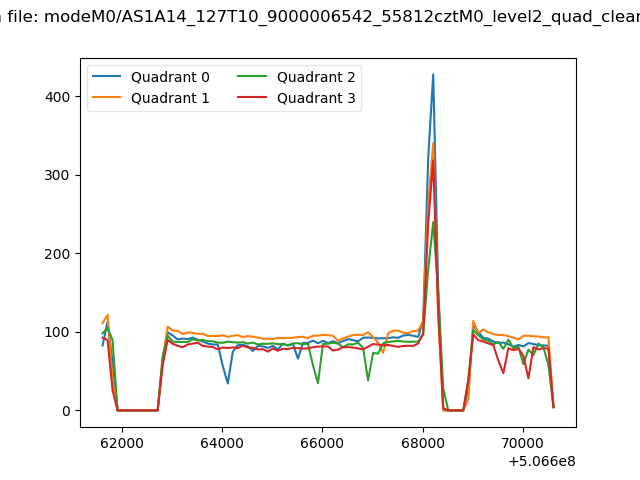 |
|
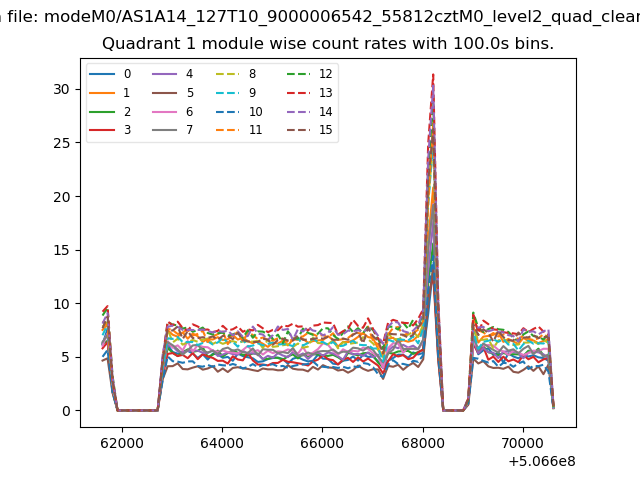
| Module-wise count rates for Quadrant A Data is divided into 100 sec bins |
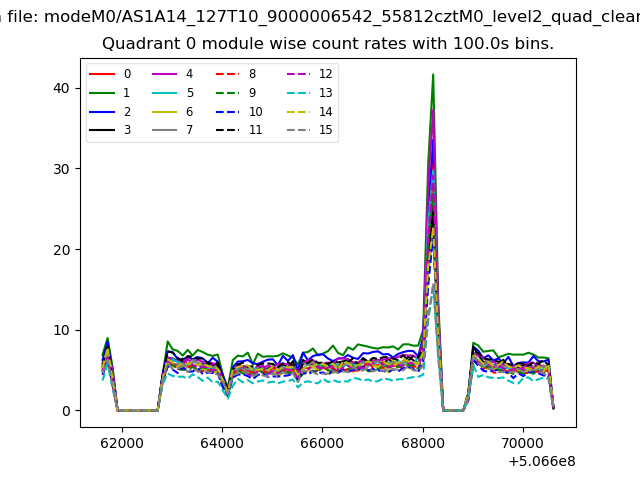 |
 |
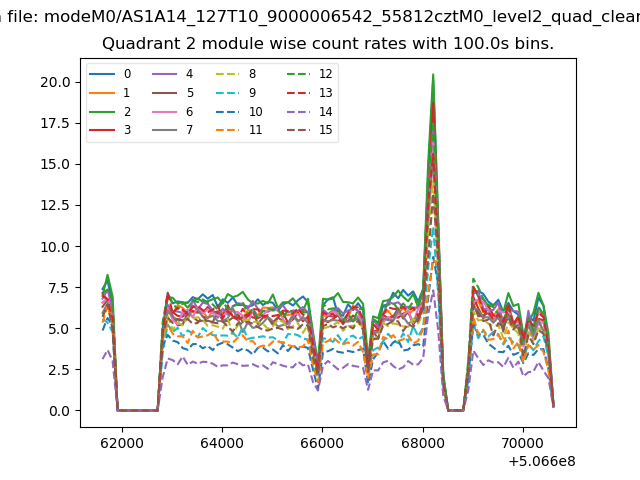
| Module-wise count rates for Quadrant B Data is divided into 100 sec bins |
 |
 |
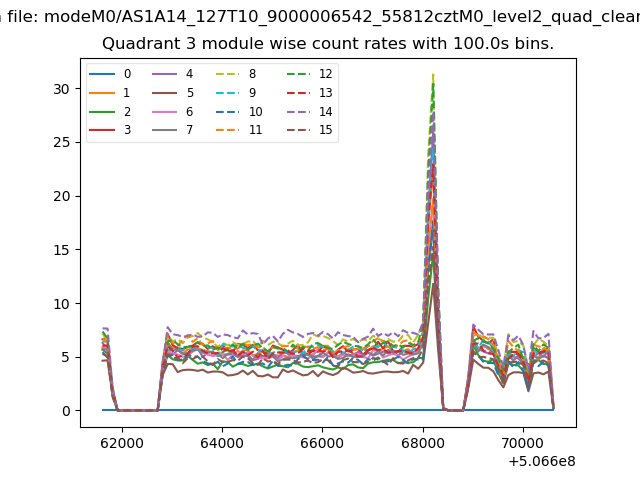
| Module-wise count rates for Quadrant C Data is divided into 100 sec bins |
 |
 |
| Module-wise count rates for Quadrant D Data is divided into 100 sec bins |
 |
 |
| Parameter | Plot |
|---|---|
| CZT HV Monitor | 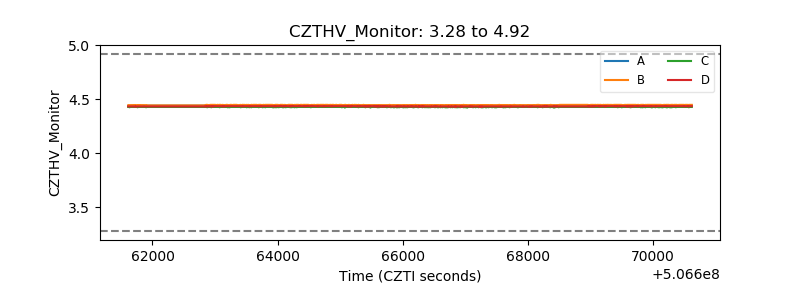 |
| D_VDD | 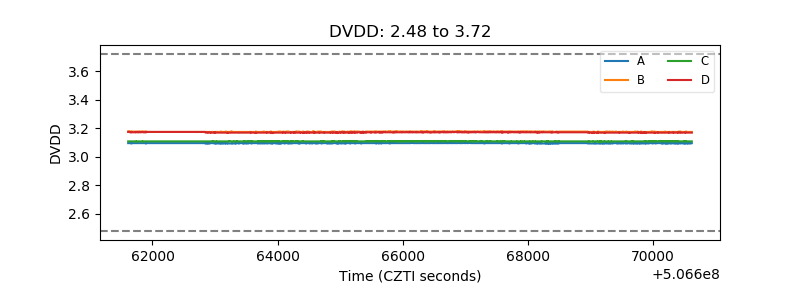 |
| Temperature 1 | 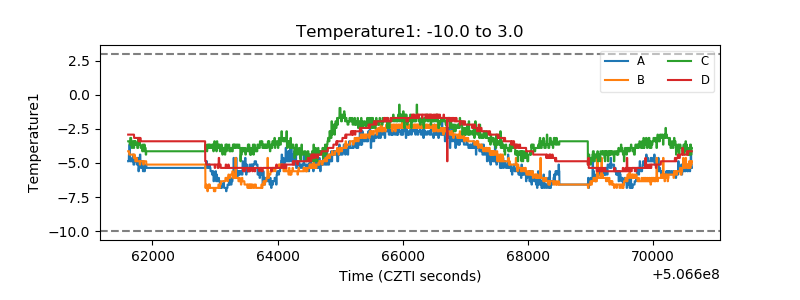 |
| Veto HV Monitor | 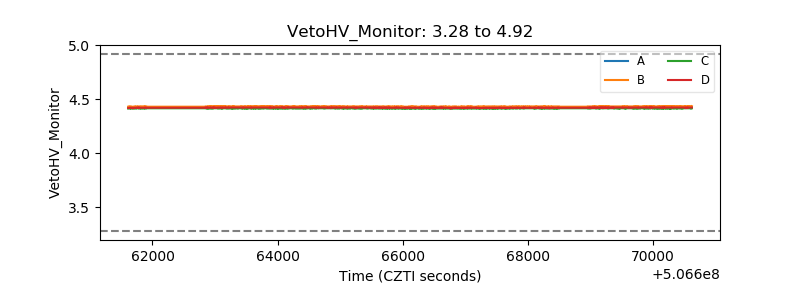 |
| Veto LLD | 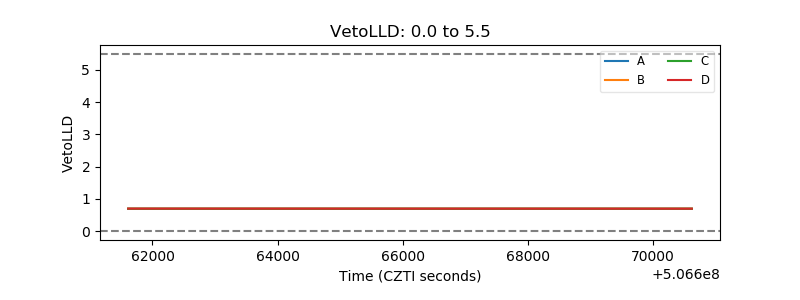 |
| Alpha Counter | 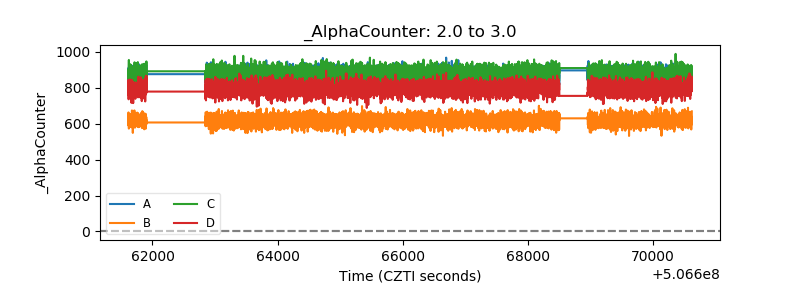 |
| _CPM_Rate | 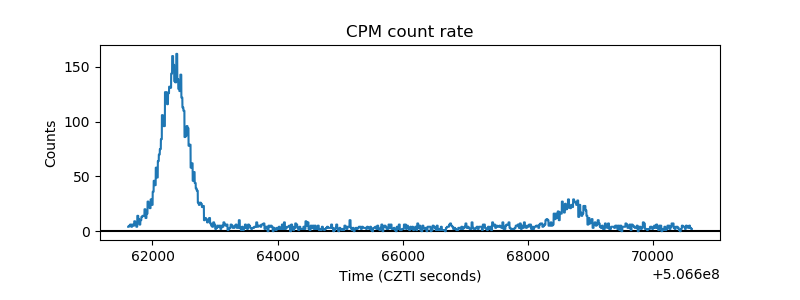 |
| CZT Counter | 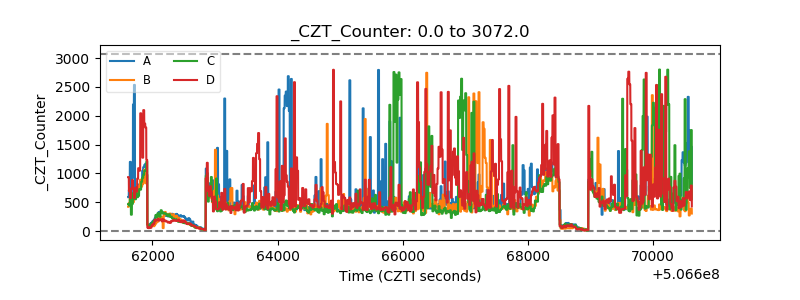 |
| +2.5 Volts monitor |  |
| +5 Volts monitor | 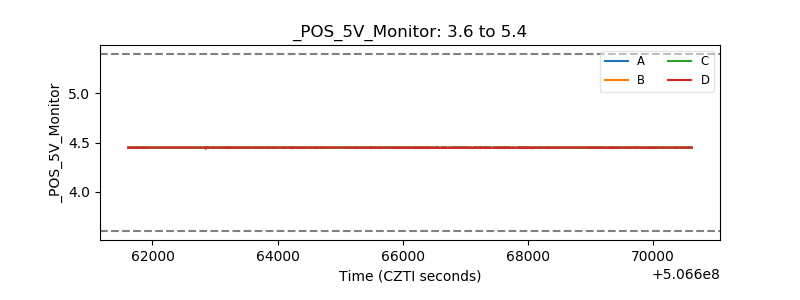 |
| _ROLL_ROT | 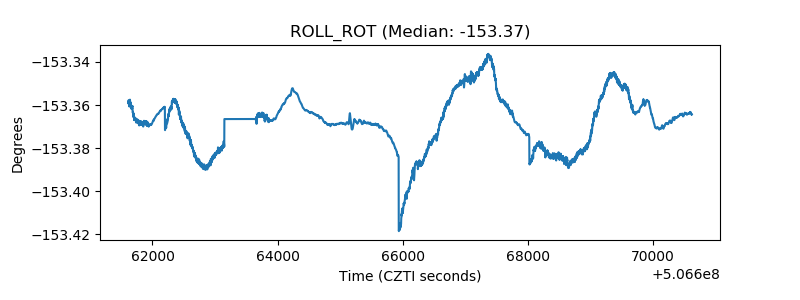 |
| _Roll_DEC | 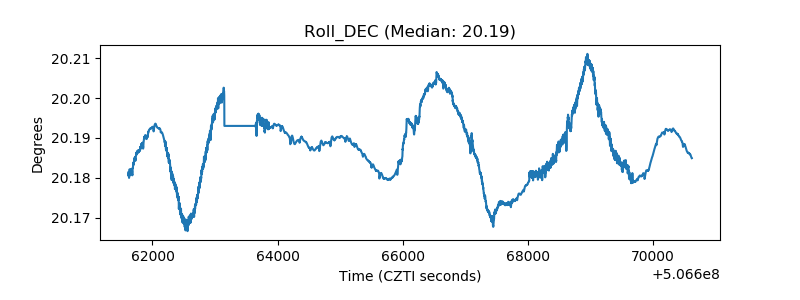 |
| _Roll_RA | 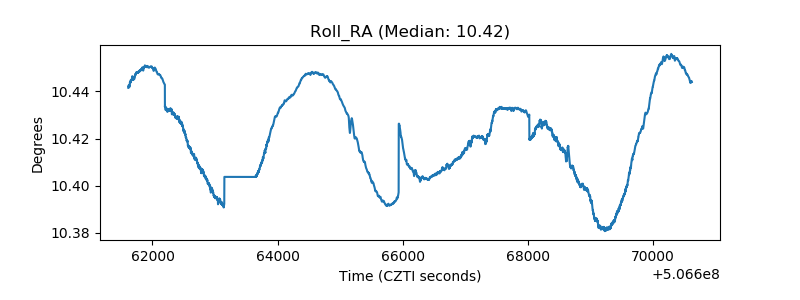 |
| Veto Counter | 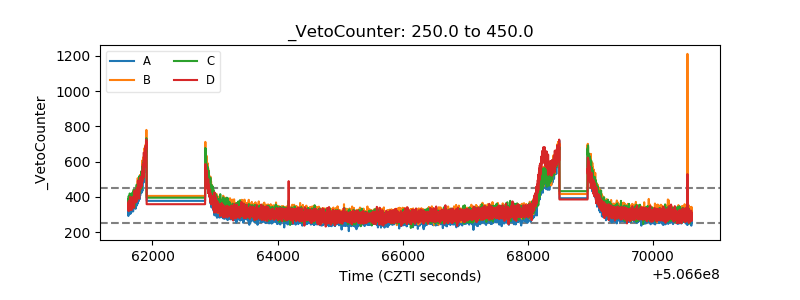 |