| Param | Original file | Final file |
|---|---|---|
| Filename | modeM0/AS1A14_127T10_9000006542_55813cztM0_level2.fits | modeM0/AS1A14_127T10_9000006542_55813cztM0_level2_quad_clean.evt |
| Size (bytes) | 585,763,200 | 101,445,120 |
| Size | 558.6 MB | 96.7 MB |
| Events in quadrant A | 5,433,506 | 656,785 |
| Events in quadrant B | 3,171,413 | 720,987 |
| Events in quadrant C | 6,326,837 | 593,428 |
| Events in quadrant D | 6,180,301 | 587,523 |
| Mode M0 | |||
|---|---|---|---|
| Quadrant | BADHDUFLAG | Total packets | Discarded packets |
| A | 0 | 21183 | 0 |
| B | 0 | 15327 | 0 |
| C | 0 | 24275 | 0 |
| D | 0 | 23530 | 0 |
| Mode SS | |||
|---|---|---|---|
| Quadrant | BADHDUFLAG | Total packets | Discarded packets |
| A | 0 | 148 | 0 |
| B | 0 | 148 | 0 |
| C | 0 | 148 | 0 |
| D | 0 | 148 | 0 |
| Quadrant | Total seconds | Saturated seconds | Saturation percentage |
|---|---|---|---|
| A | 7364 | 212 | 2.878870% |
| B | 7365 | 46 | 0.624576% |
| C | 7365 | 806 | 10.943652% |
| D | 7365 | 443 | 6.014936% |
Noise dominated data is calculated using 1-second bins in cleaned event files. If a bin has >2000 counts, and if more than 50% of those come from <1% of pixels, then it is considered to be noise-dominated and hence unusable.
| Quadrant | # 1 sec bins | Bins with >0 counts | Bins with >2000 counts | High rate bins dominated by noise | Noise dominated (total time) | Noise dominated (detector-on time) | Marked lightcurve |
|---|---|---|---|---|---|---|---|
| A | 7364 | 7364 | 257 | 257 | 3.49% | 3.49% | 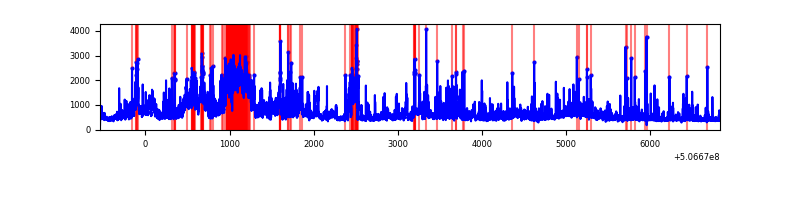 |
| B | 7365 | 7365 | 13 | 13 | 0.18% | 0.18% | 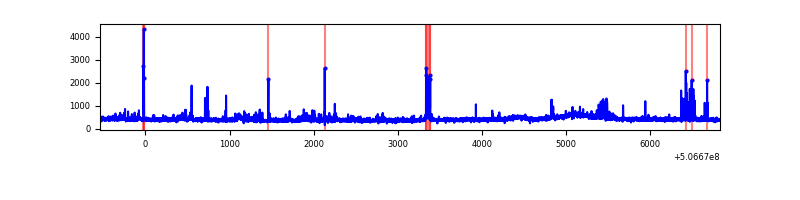 |
| C | 7365 | 7365 | 747 | 747 | 10.14% | 10.14% | 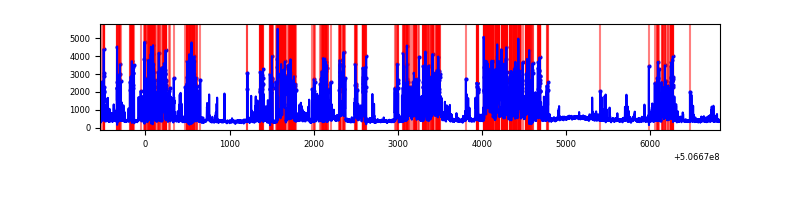 |
| D | 7365 | 7365 | 392 | 392 | 5.32% | 5.32% | 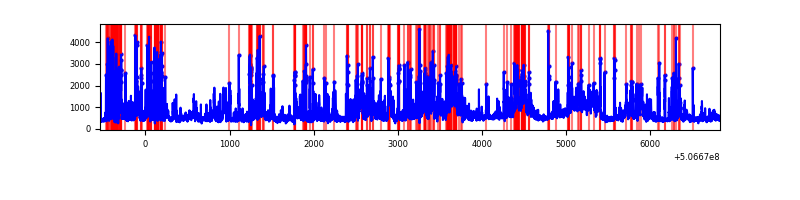 |
Top three noisy pixels from each quadrant. If the there are fewer than three noisy pixels in the level2.evt file, extra rows are filled as -1
| Pixel properties | Quadrant properties | ||||||
|---|---|---|---|---|---|---|---|
| Quadrant | DetID | PixID | Counts | Sigma | Mean | Median | Sigma |
| A | 12 | 115 | 1228723 | 6768.46 | 731 | 712 | 181.4 |
| A | 15 | 32 | 600881 | 3307.97 | 731 | 712 | 181.4 |
| A | 7 | 64 | 413038 | 2272.63 | 731 | 712 | 181.4 |
| B | 5 | 185 | 120755 | 752.12 | 730 | 704 | 159.6 |
| B | 0 | 213 | 53048 | 327.93 | 730 | 704 | 159.6 |
| B | 10 | 247 | 45747 | 282.19 | 730 | 704 | 159.6 |
| C | 13 | 3 | 3468250 | 18076.97 | 687 | 679 | 191.8 |
| C | 15 | 200 | 52402 | 269.64 | 687 | 679 | 191.8 |
| C | 7 | 220 | 34422 | 175.9 | 687 | 679 | 191.8 |
| D | 11 | 129 | 1698400 | 8526.08 | 699 | 670 | 199.1 |
| D | 8 | 160 | 617113 | 3095.81 | 699 | 670 | 199.1 |
| D | 8 | 245 | 570869 | 2863.57 | 699 | 670 | 199.1 |
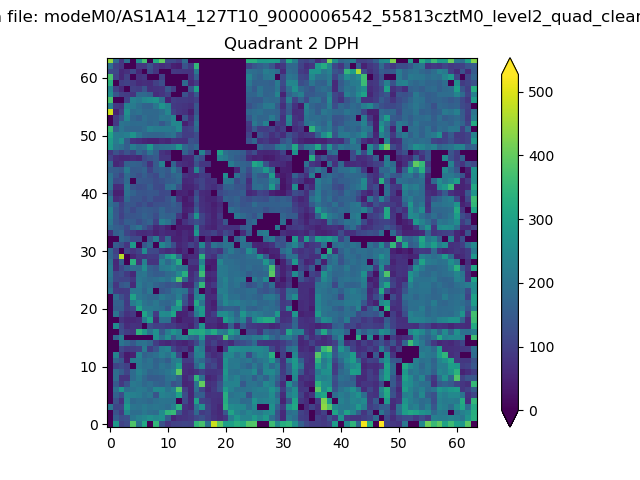
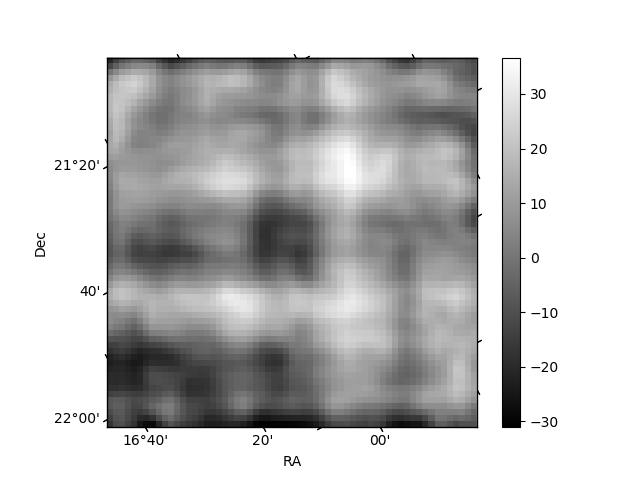
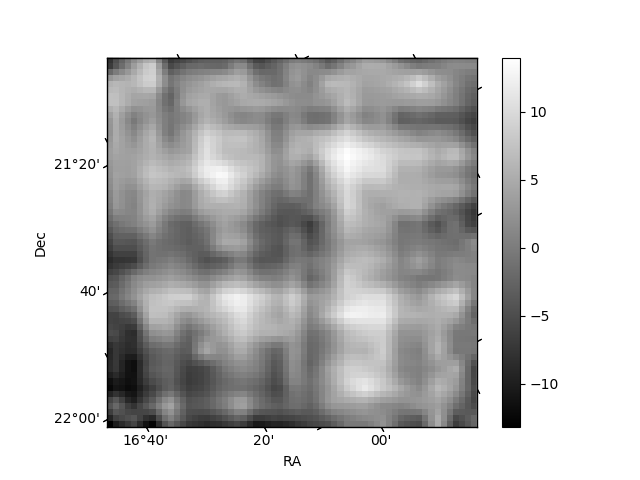
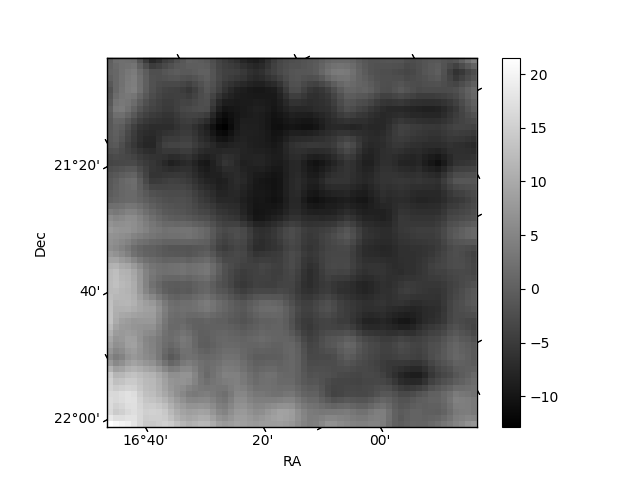
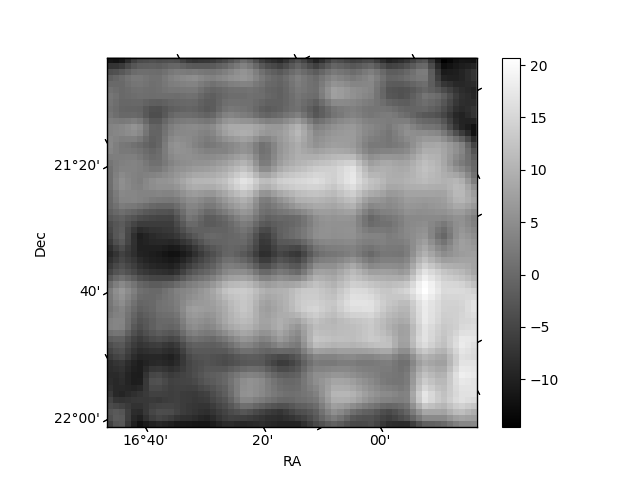
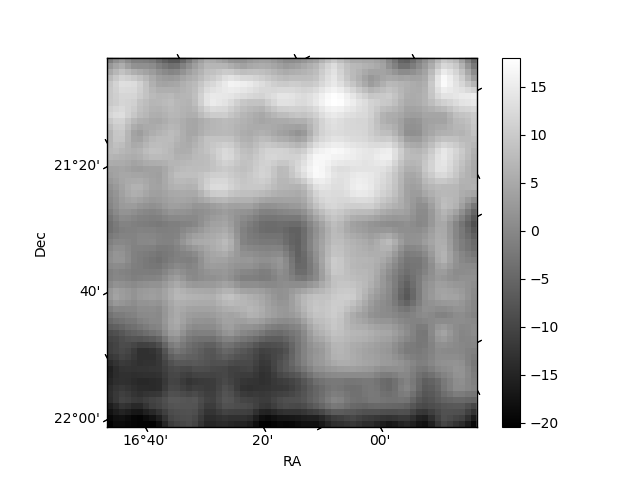
Histogram calculated using DETX and DETY for each event in the final _common_clean file
| Quadrant A | 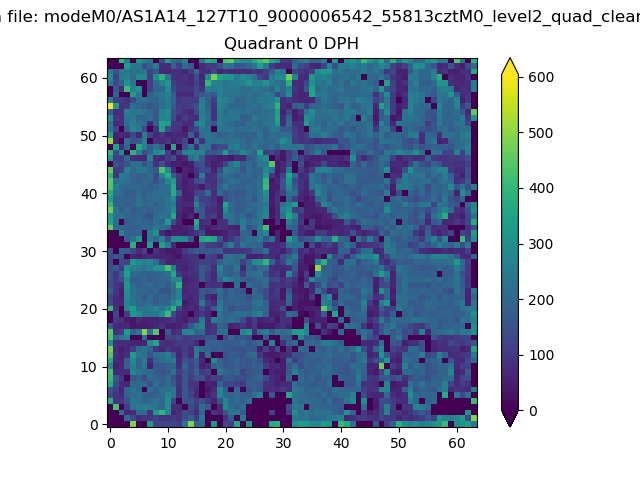 |
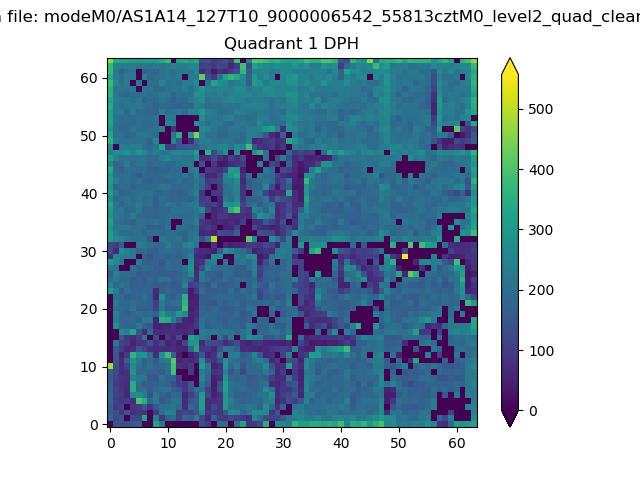 |
Quadrant B |
|---|---|---|---|
| Quadrant D | 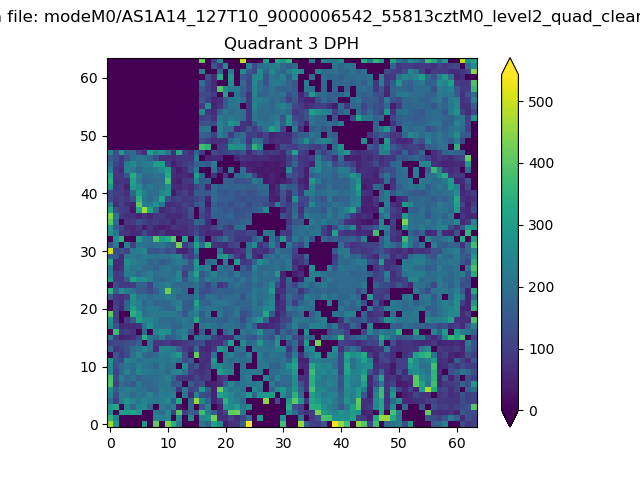 |
 |
Quadrant C |
| Plot type | Count rate plots | Images |
|---|---|---|
| Comparison with Poisson distribution Blue bars denote a histogram of data divided into 1 sec bins. Red curve is a Poisson curve with rate = median count rate of data. |
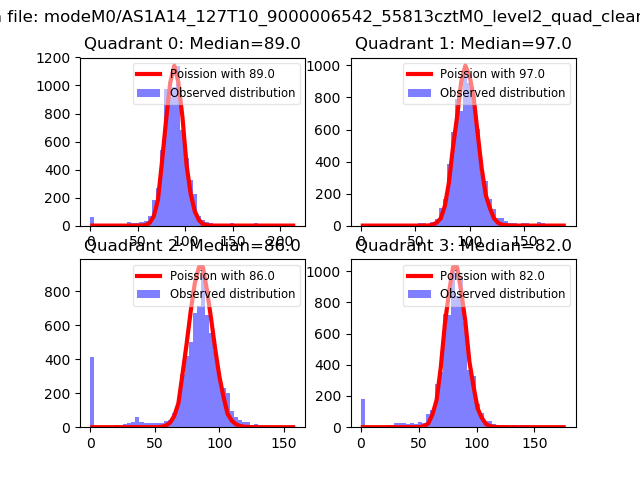 |
 |
| Quadrant-wise count rates Data is divided into 100 sec bins |
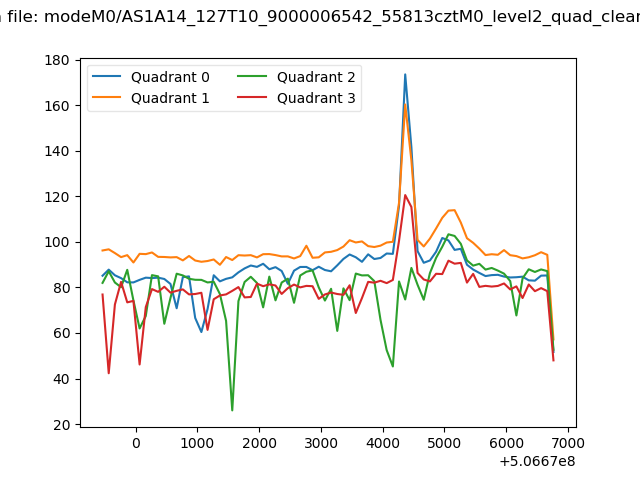 |
|
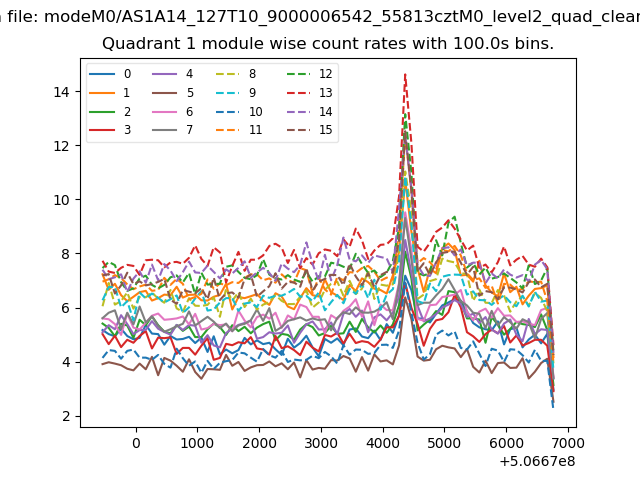
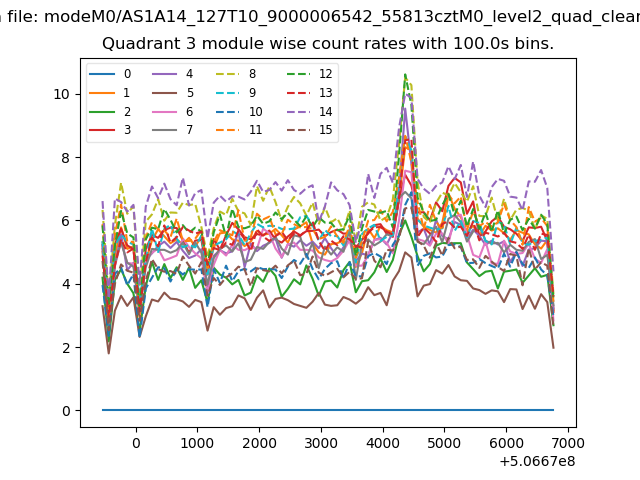
| Module-wise count rates for Quadrant A Data is divided into 100 sec bins |
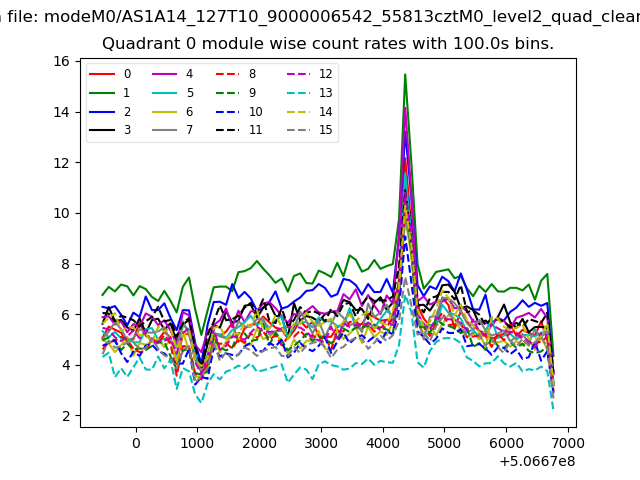 |
 |
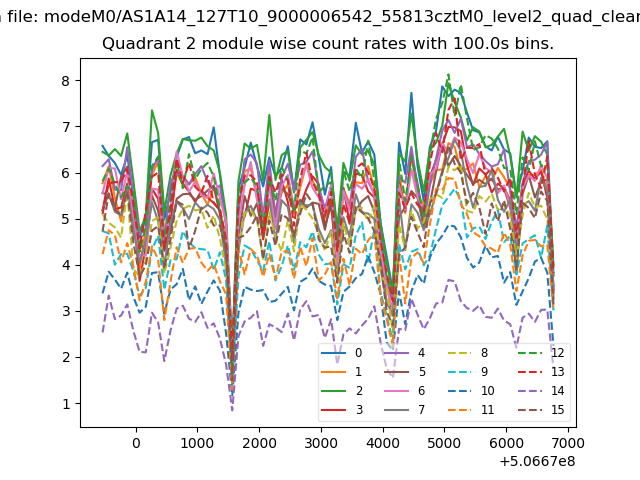
| Module-wise count rates for Quadrant B Data is divided into 100 sec bins |
 |
 |
| Module-wise count rates for Quadrant C Data is divided into 100 sec bins |
 |
 |
| Module-wise count rates for Quadrant D Data is divided into 100 sec bins |
 |
 |
| Parameter | Plot |
|---|---|
| CZT HV Monitor | 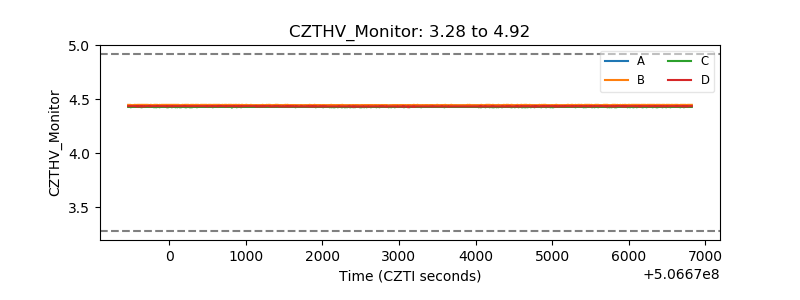 |
| D_VDD | 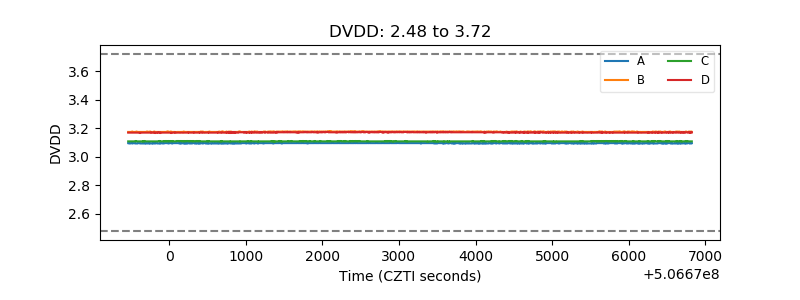 |
| Temperature 1 | 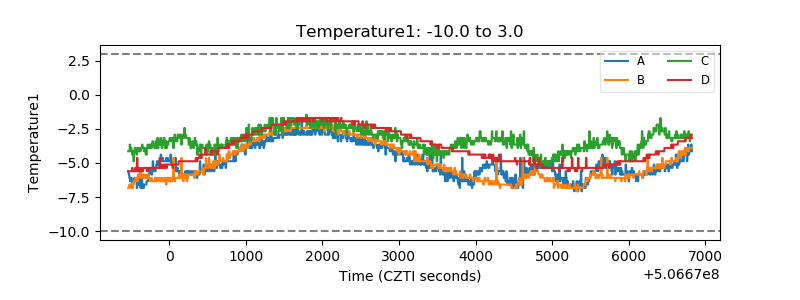 |
| Veto HV Monitor | 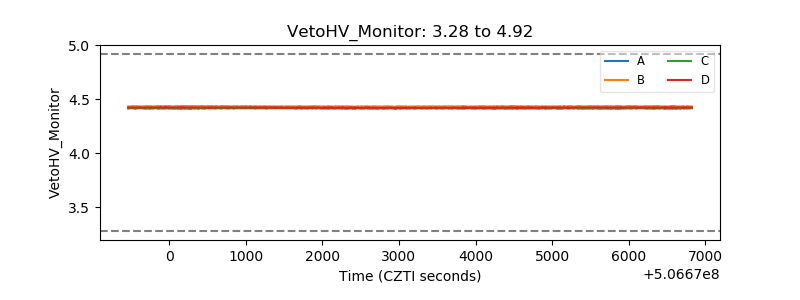 |
| Veto LLD | 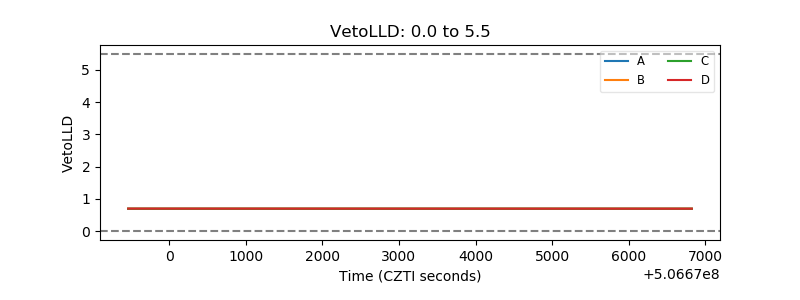 |
| Alpha Counter | 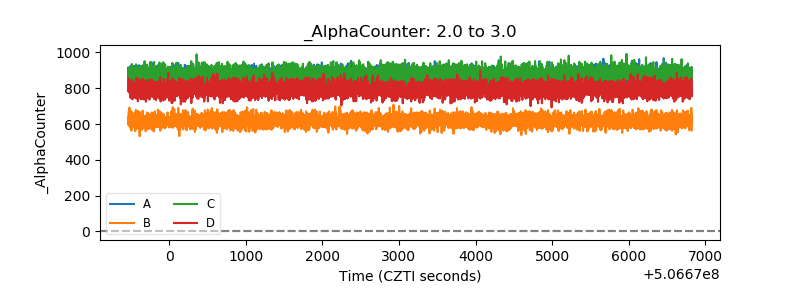 |
| _CPM_Rate | 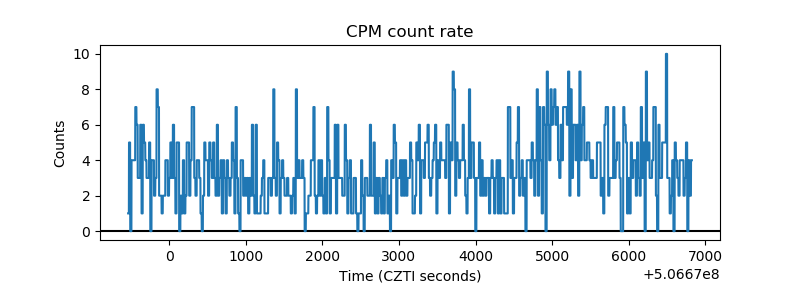 |
| CZT Counter | 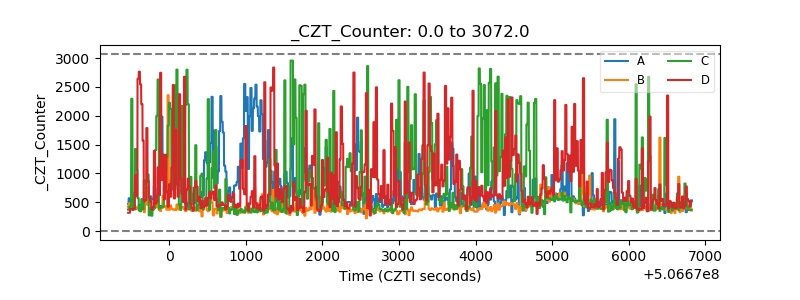 |
| +2.5 Volts monitor |  |
| +5 Volts monitor |  |
| _ROLL_ROT | 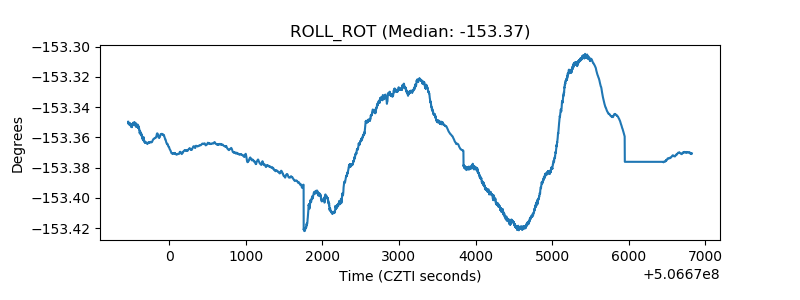 |
| _Roll_DEC | 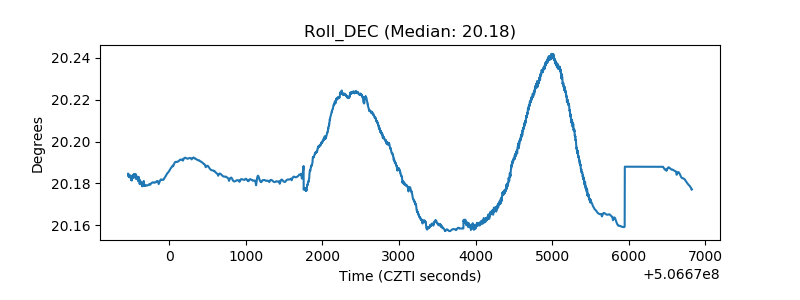 |
| _Roll_RA | 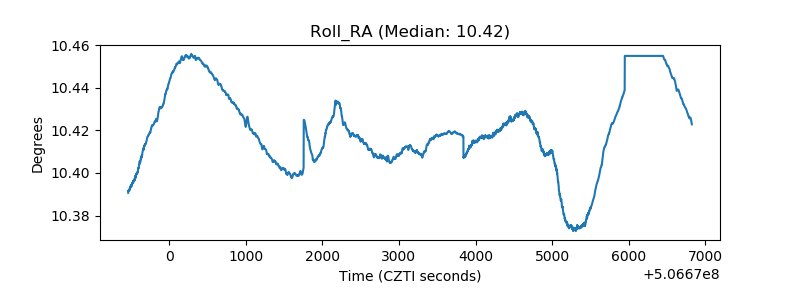 |
| Veto Counter | 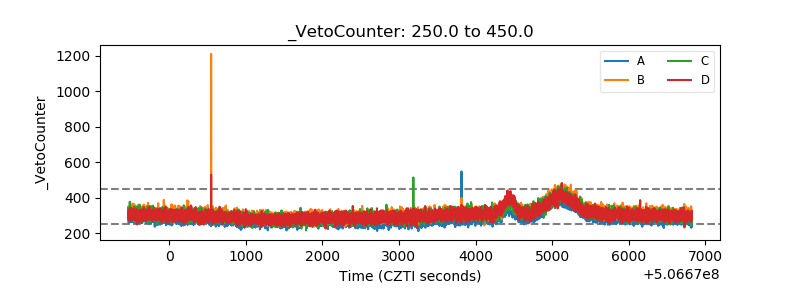 |