| Param | Original file | Final file |
|---|---|---|
| Filename | modeM0/AS1A14_127T10_9000006542_55814cztM0_level2.fits | modeM0/AS1A14_127T10_9000006542_55814cztM0_level2_quad_clean.evt |
| Size (bytes) | 459,705,600 | 101,704,320 |
| Size | 438.4 MB | 97.0 MB |
| Events in quadrant A | 3,917,445 | 657,007 |
| Events in quadrant B | 3,151,821 | 711,636 |
| Events in quadrant C | 4,101,131 | 628,036 |
| Events in quadrant D | 5,270,414 | 567,499 |
| Mode M0 | |||
|---|---|---|---|
| Quadrant | BADHDUFLAG | Total packets | Discarded packets |
| A | 0 | 16853 | 0 |
| B | 0 | 15320 | 0 |
| C | 0 | 18086 | 0 |
| D | 0 | 21004 | 0 |
| Mode SS | |||
|---|---|---|---|
| Quadrant | BADHDUFLAG | Total packets | Discarded packets |
| A | 0 | 148 | 0 |
| B | 0 | 148 | 0 |
| C | 0 | 148 | 0 |
| D | 0 | 148 | 0 |
| Quadrant | Total seconds | Saturated seconds | Saturation percentage |
|---|---|---|---|
| A | 7404 | 48 | 0.648298% |
| B | 7404 | 21 | 0.283630% |
| C | 7405 | 224 | 3.024983% |
| D | 7405 | 503 | 6.792708% |
Noise dominated data is calculated using 1-second bins in cleaned event files. If a bin has >2000 counts, and if more than 50% of those come from <1% of pixels, then it is considered to be noise-dominated and hence unusable.
| Quadrant | # 1 sec bins | Bins with >0 counts | Bins with >2000 counts | High rate bins dominated by noise | Noise dominated (total time) | Noise dominated (detector-on time) | Marked lightcurve |
|---|---|---|---|---|---|---|---|
| A | 7404 | 7404 | 61 | 61 | 0.82% | 0.82% |  |
| B | 7404 | 7404 | 11 | 11 | 0.15% | 0.15% |  |
| C | 7405 | 7405 | 209 | 209 | 2.82% | 2.82% |  |
| D | 7405 | 7405 | 454 | 454 | 6.13% | 6.13% |  |
Top three noisy pixels from each quadrant. If the there are fewer than three noisy pixels in the level2.evt file, extra rows are filled as -1
| Pixel properties | Quadrant properties | ||||||
|---|---|---|---|---|---|---|---|
| Quadrant | DetID | PixID | Counts | Sigma | Mean | Median | Sigma |
| A | 7 | 64 | 492034 | 2722.55 | 722 | 704 | 180.5 |
| A | 8 | 192 | 229262 | 1266.48 | 722 | 704 | 180.5 |
| A | 15 | 32 | 205275 | 1133.57 | 722 | 704 | 180.5 |
| B | 5 | 185 | 107420 | 683.58 | 718 | 692 | 156.1 |
| B | 0 | 213 | 88724 | 563.84 | 718 | 692 | 156.1 |
| B | 7 | 0 | 43479 | 274.05 | 718 | 692 | 156.1 |
| C | 13 | 3 | 1169074 | 6052.76 | 698 | 692 | 193.0 |
| C | 10 | 22 | 76819 | 394.37 | 698 | 692 | 193.0 |
| C | 7 | 220 | 33566 | 170.3 | 698 | 692 | 193.0 |
| D | 2 | 62 | 1841164 | 9497.58 | 685 | 656 | 193.8 |
| D | 11 | 129 | 430949 | 2220.44 | 685 | 656 | 193.8 |
| D | 2 | 249 | 118541 | 608.32 | 685 | 656 | 193.8 |
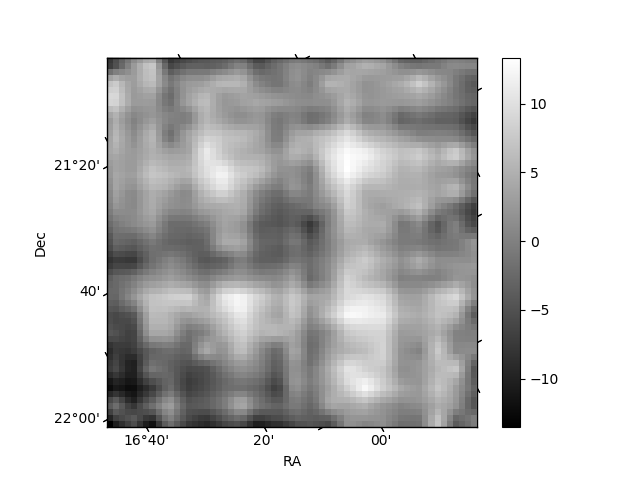
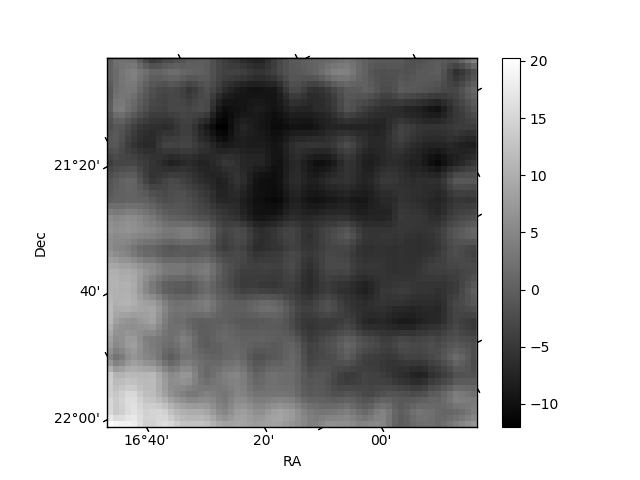
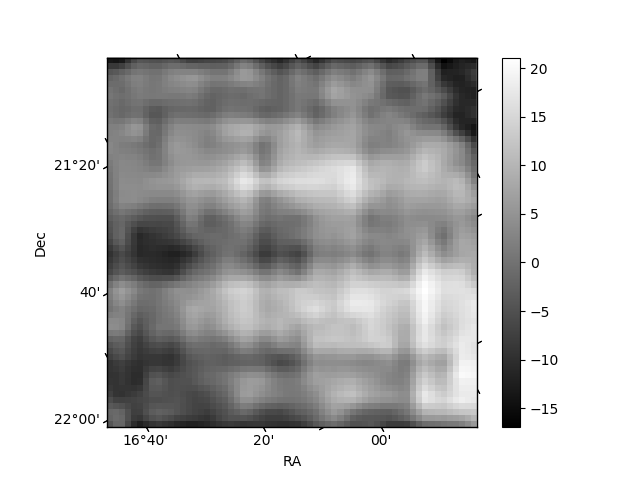
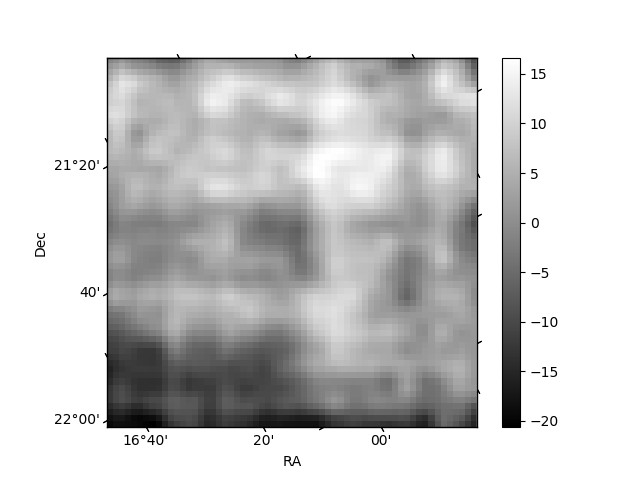
Histogram calculated using DETX and DETY for each event in the final _common_clean file
| Quadrant A | 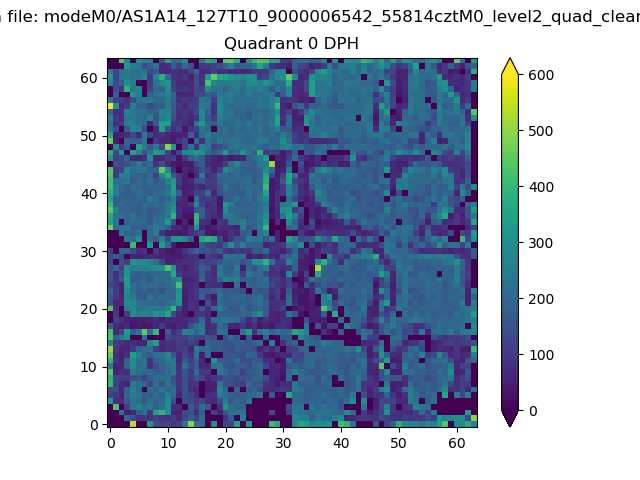 |
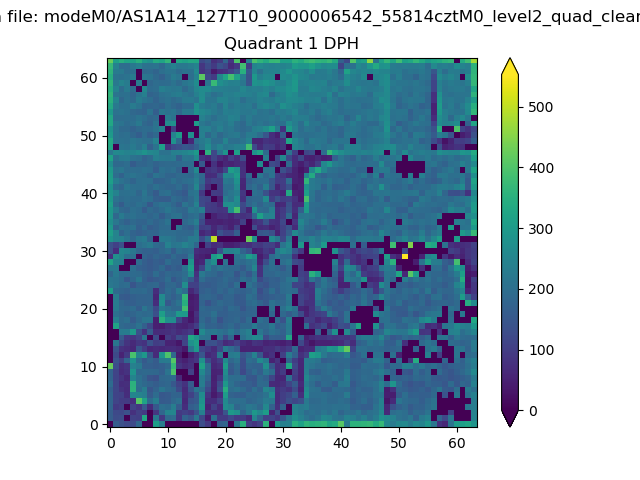 |
Quadrant B |
|---|---|---|---|
| Quadrant D | 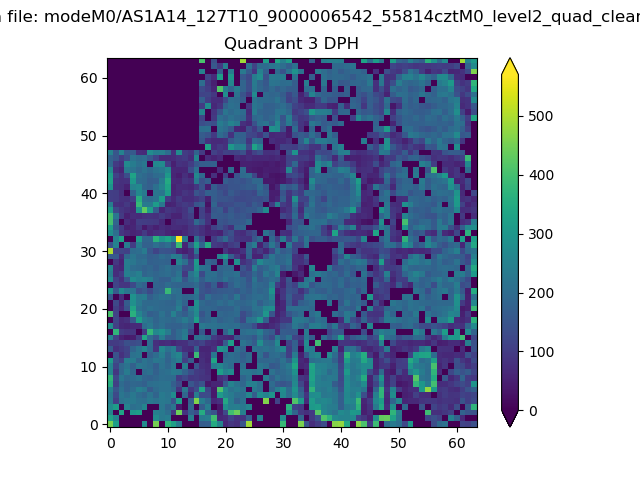 |
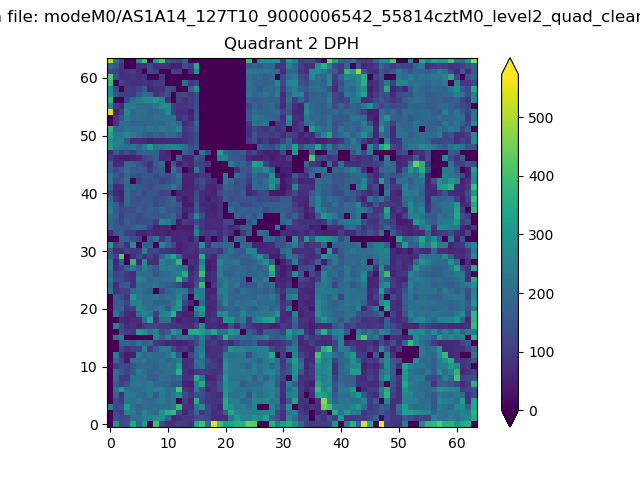 |
Quadrant C |
| Plot type | Count rate plots | Images |
|---|---|---|
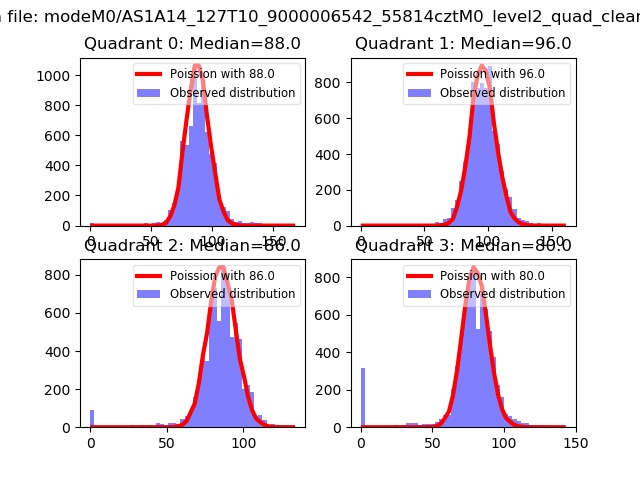
| Comparison with Poisson distribution Blue bars denote a histogram of data divided into 1 sec bins. Red curve is a Poisson curve with rate = median count rate of data. |
 |
 |
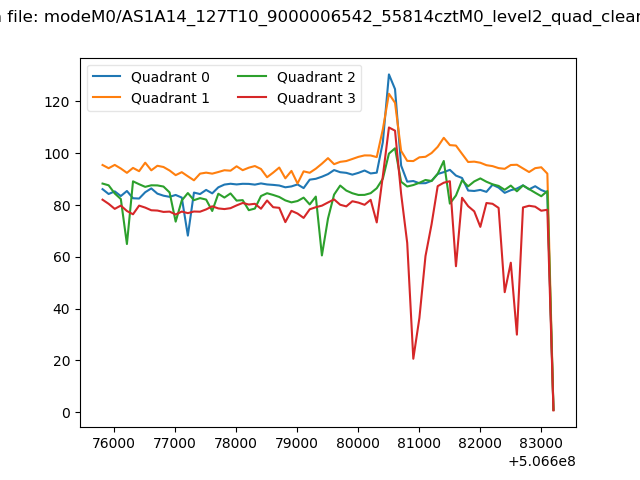
| Quadrant-wise count rates Data is divided into 100 sec bins |
 |
|
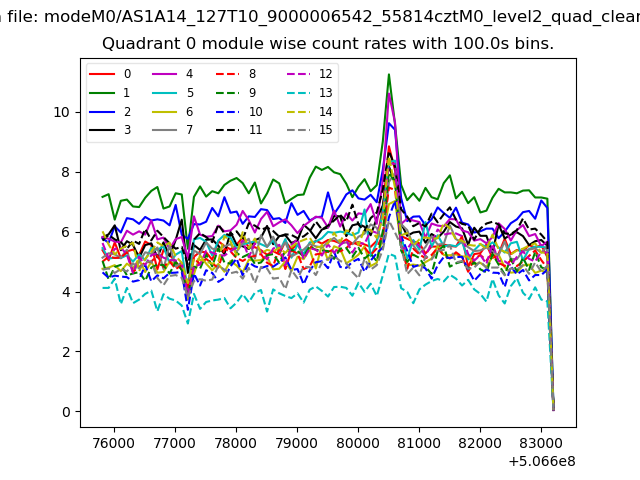
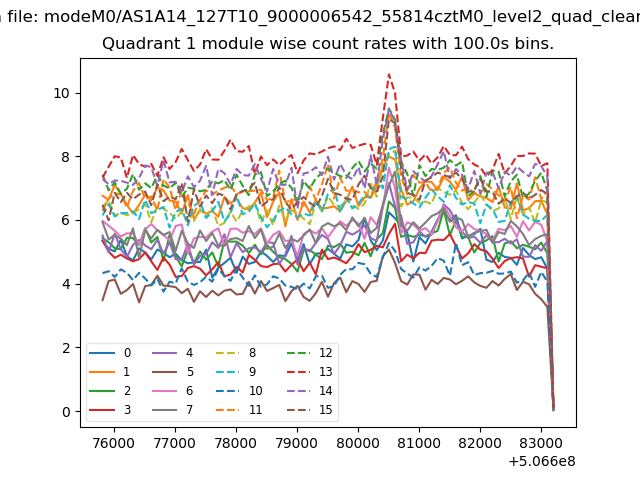
| Module-wise count rates for Quadrant A Data is divided into 100 sec bins |
 |
 |
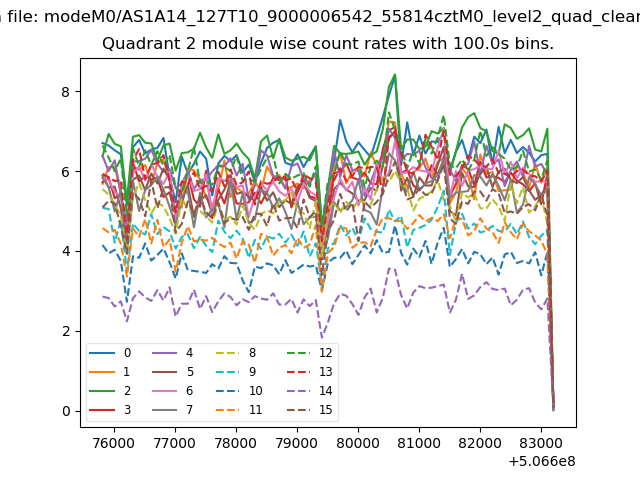
| Module-wise count rates for Quadrant B Data is divided into 100 sec bins |
 |
 |
| Module-wise count rates for Quadrant C Data is divided into 100 sec bins |
 |
 |
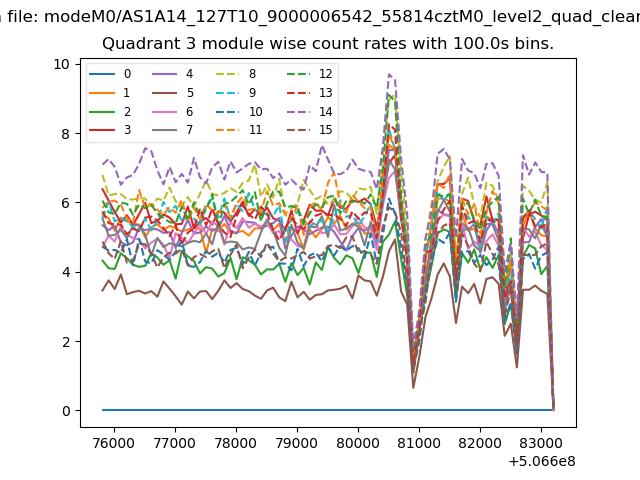
| Module-wise count rates for Quadrant D Data is divided into 100 sec bins |
 |
 |
| Parameter | Plot |
|---|---|
| CZT HV Monitor | 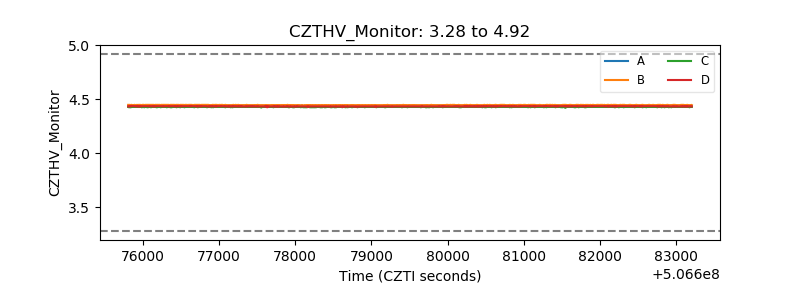 |
| D_VDD | 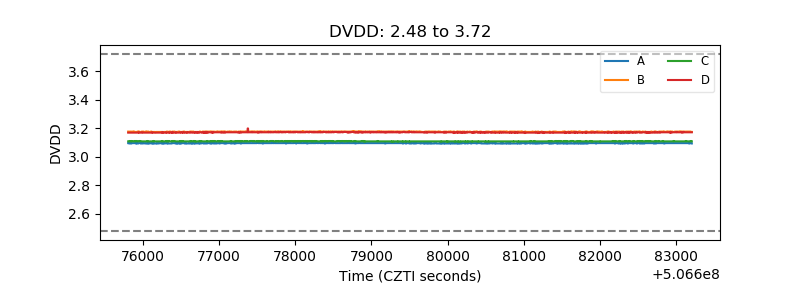 |
| Temperature 1 | 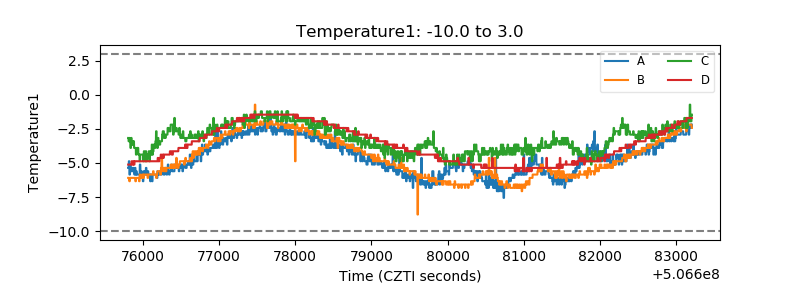 |
| Veto HV Monitor | 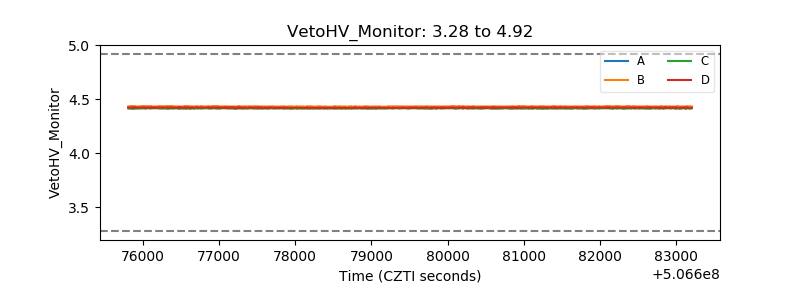 |
| Veto LLD | 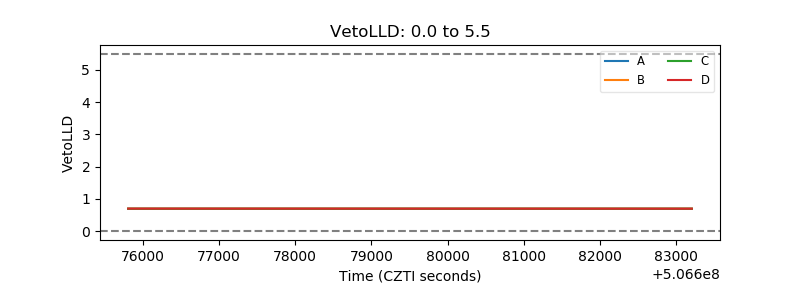 |
| Alpha Counter | 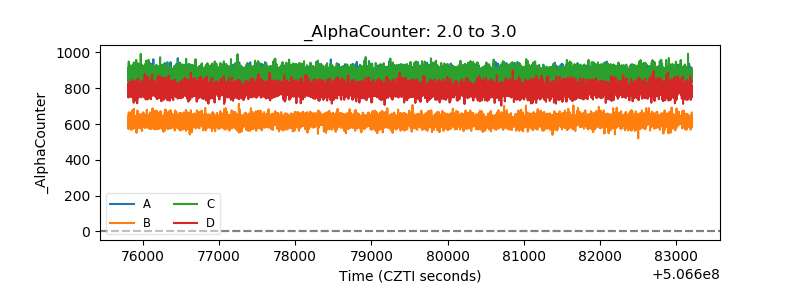 |
| _CPM_Rate | 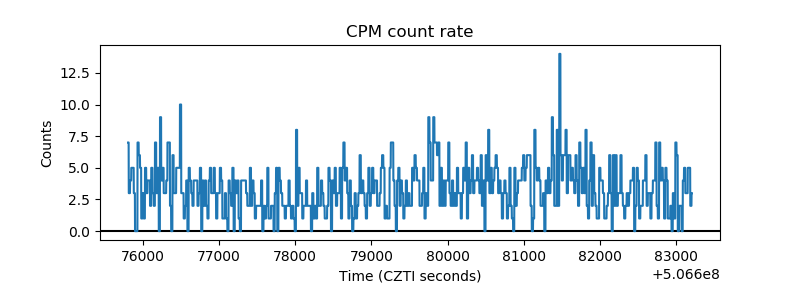 |
| CZT Counter | 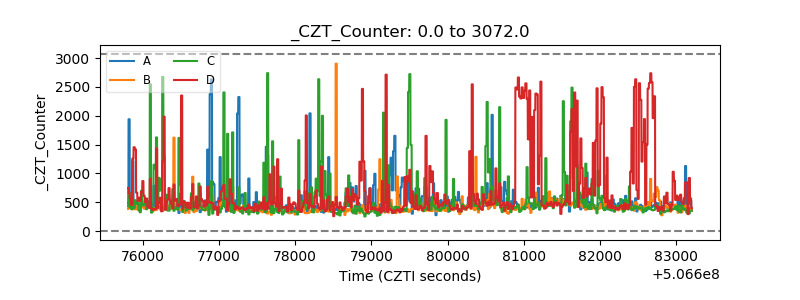 |
| +2.5 Volts monitor |  |
| +5 Volts monitor |  |
| _ROLL_ROT | 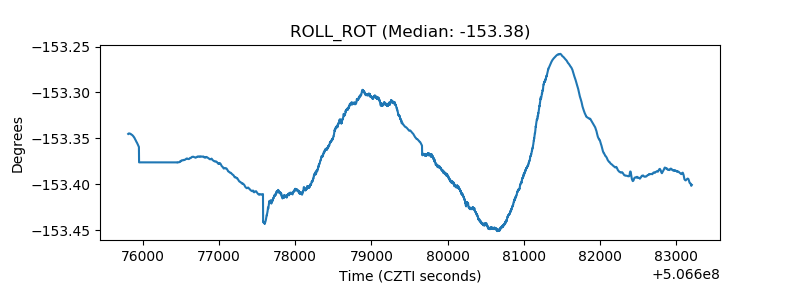 |
| _Roll_DEC | 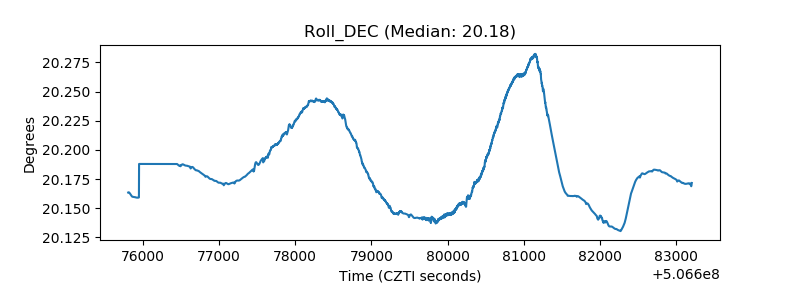 |
| _Roll_RA | 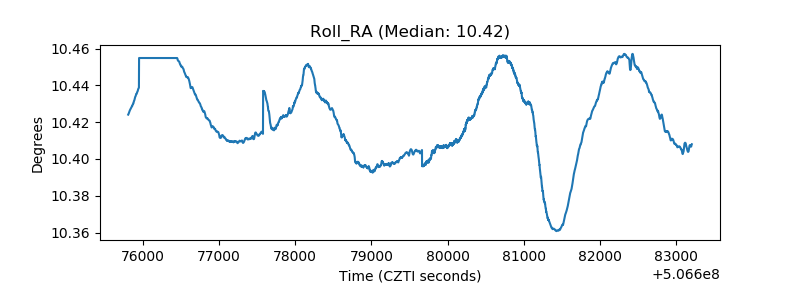 |
| Veto Counter | 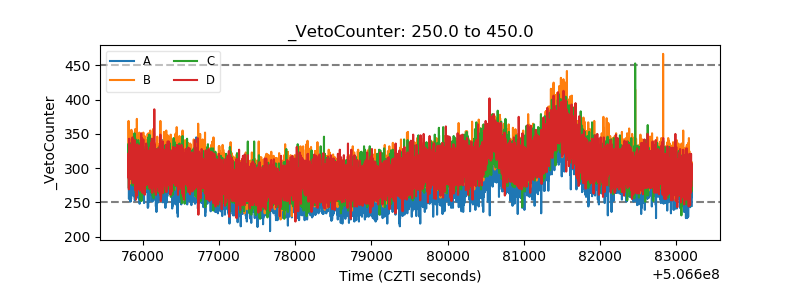 |