| Param | Original file | Final file |
|---|---|---|
| Filename | modeM0/AS1A14_127T10_9000006542_55818cztM0_level2.fits | modeM0/AS1A14_127T10_9000006542_55818cztM0_level2_quad_clean.evt |
| Size (bytes) | 1,664,772,480 | 244,362,240 |
| Size | 1.6 GB | 233.0 MB |
| Events in quadrant A | 11,373,409 | 1,723,390 |
| Events in quadrant B | 8,348,241 | 1,846,162 |
| Events in quadrant C | 8,706,828 | 1,660,698 |
| Events in quadrant D | 31,765,408 | 893,642 |
| Mode M0 | |||
|---|---|---|---|
| Quadrant | BADHDUFLAG | Total packets | Discarded packets |
| A | 0 | 46510 | 2 |
| B | 0 | 39991 | 2 |
| C | 0 | 41047 | 3 |
| D | 0 | 107352 | 2 |
| Mode M9 | |||
|---|---|---|---|
| Quadrant | BADHDUFLAG | Total packets | Discarded packets |
| A | 0 | 10 | 0 |
| B | 0 | 10 | 0 |
| C | 0 | 10 | 0 |
| D | 0 | 10 | 0 |
| Mode SS | |||
|---|---|---|---|
| Quadrant | BADHDUFLAG | Total packets | Discarded packets |
| A | 0 | 374 | 0 |
| B | 0 | 374 | 0 |
| C | 0 | 374 | 0 |
| D | 0 | 374 | 0 |
| Quadrant | Total seconds | Saturated seconds | Saturation percentage |
|---|---|---|---|
| A | 18493 | 570 | 3.082247% |
| B | 18493 | 316 | 1.708755% |
| C | 18492 | 228 | 1.232966% |
| D | 18493 | 8416 | 45.509112% |
Noise dominated data is calculated using 1-second bins in cleaned event files. If a bin has >2000 counts, and if more than 50% of those come from <1% of pixels, then it is considered to be noise-dominated and hence unusable.
| Quadrant | # 1 sec bins | Bins with >0 counts | Bins with >2000 counts | High rate bins dominated by noise | Noise dominated (total time) | Noise dominated (detector-on time) | Marked lightcurve |
|---|---|---|---|---|---|---|---|
| A | 19503 | 18495 | 396 | 396 | 2.03% | 2.14% | 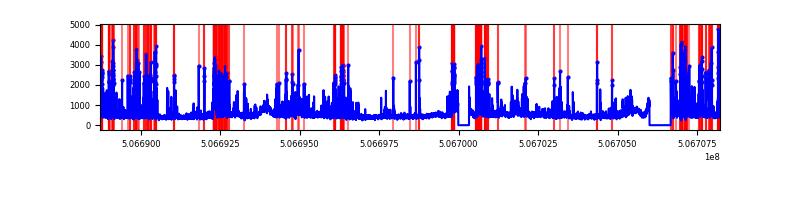 |
| B | 19503 | 18495 | 119 | 119 | 0.61% | 0.64% | 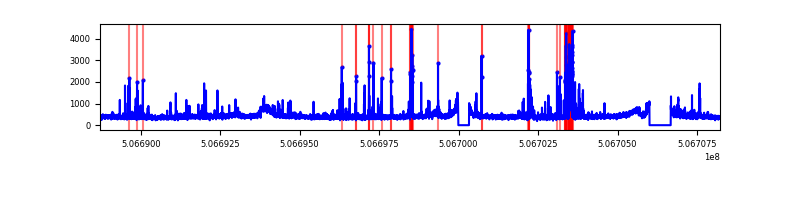 |
| C | 19502 | 18494 | 162 | 162 | 0.83% | 0.88% | 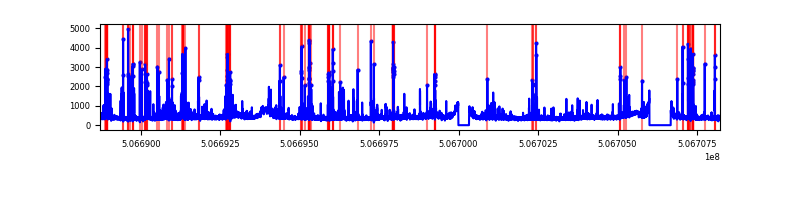 |
| D | 19503 | 18495 | 8279 | 8279 | 42.45% | 44.76% | 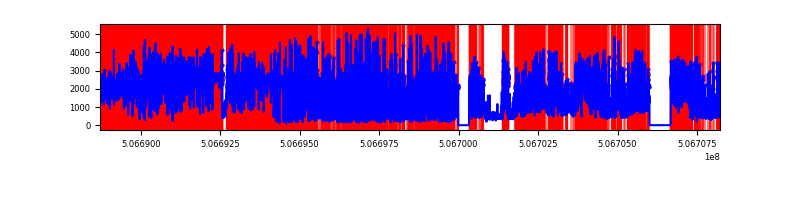 |
Top three noisy pixels from each quadrant. If the there are fewer than three noisy pixels in the level2.evt file, extra rows are filled as -1
| Pixel properties | Quadrant properties | ||||||
|---|---|---|---|---|---|---|---|
| Quadrant | DetID | PixID | Counts | Sigma | Mean | Median | Sigma |
| A | 7 | 64 | 1048364 | 2227.02 | 1877 | 1833 | 469.9 |
| A | 0 | 8 | 1041253 | 2211.89 | 1877 | 1833 | 469.9 |
| A | 8 | 192 | 577001 | 1223.96 | 1877 | 1833 | 469.9 |
| B | 5 | 185 | 663226 | 1640.61 | 1859 | 1786 | 403.2 |
| B | 0 | 213 | 131883 | 322.69 | 1859 | 1786 | 403.2 |
| B | 10 | 247 | 69173 | 167.14 | 1859 | 1786 | 403.2 |
| C | 13 | 3 | 1068222 | 2092.25 | 1834 | 1815 | 509.7 |
| C | 15 | 200 | 111326 | 214.86 | 1834 | 1815 | 509.7 |
| C | 1 | 16 | 92999 | 178.9 | 1834 | 1815 | 509.7 |
| D | 2 | 62 | 22144944 | 55714.41 | 1387 | 1325 | 397.4 |
| D | 11 | 129 | 2881360 | 7246.31 | 1387 | 1325 | 397.4 |
| D | 8 | 160 | 771365 | 1937.46 | 1387 | 1325 | 397.4 |
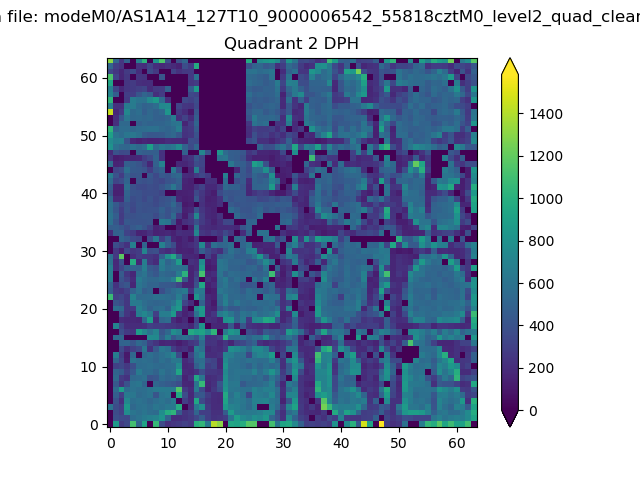
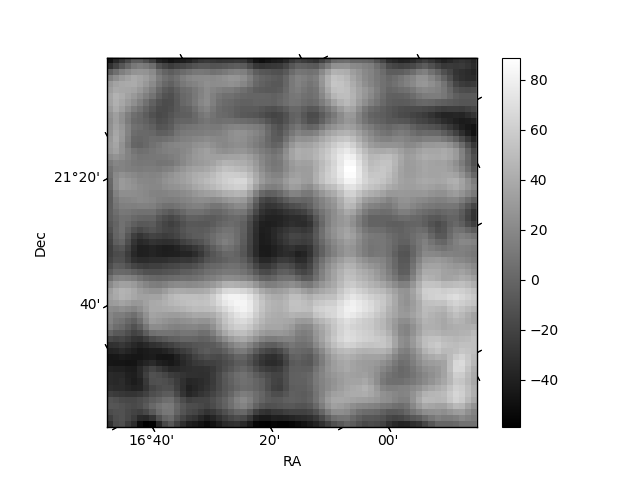
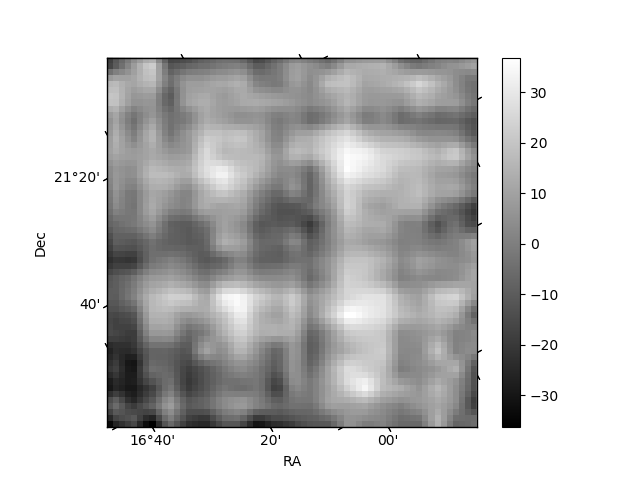
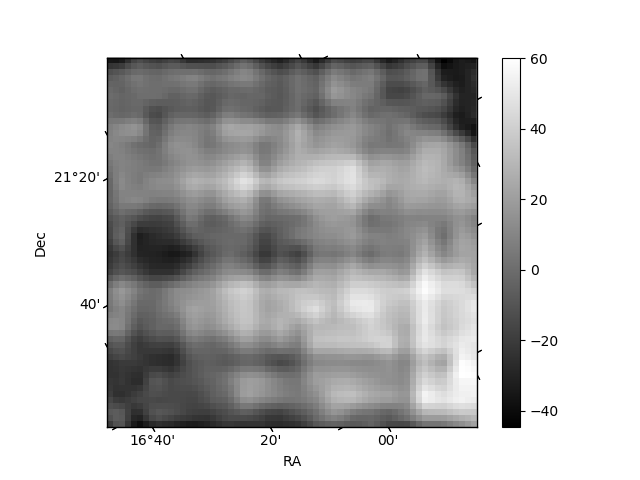
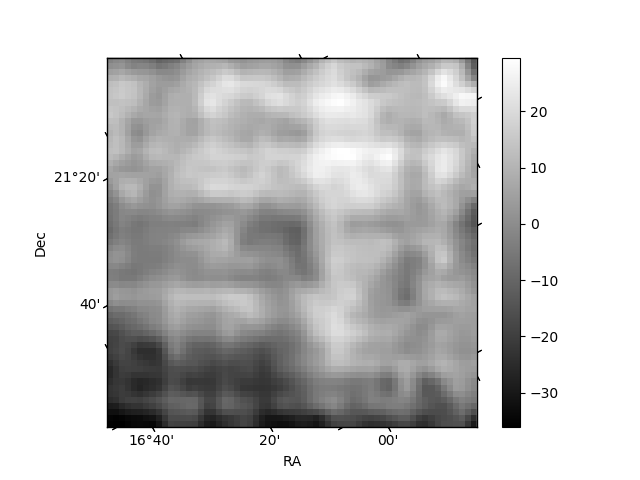
Histogram calculated using DETX and DETY for each event in the final _common_clean file
| Quadrant A | 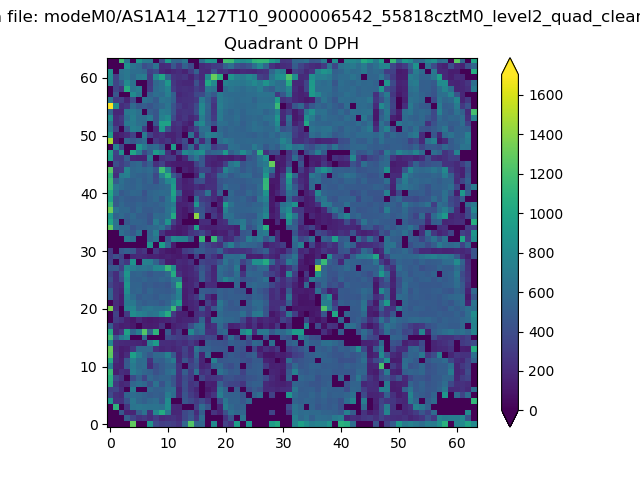 |
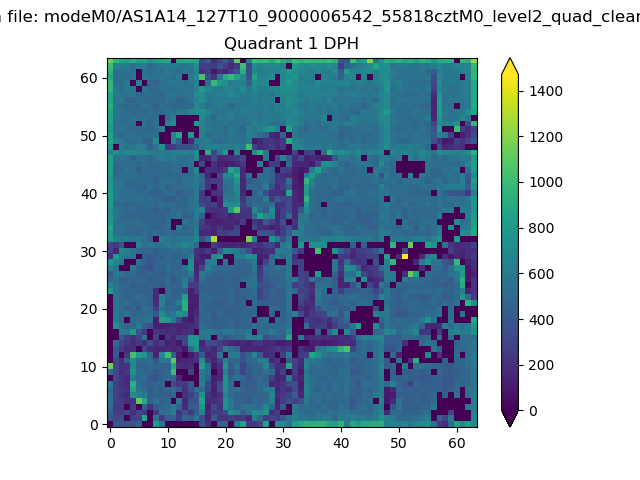 |
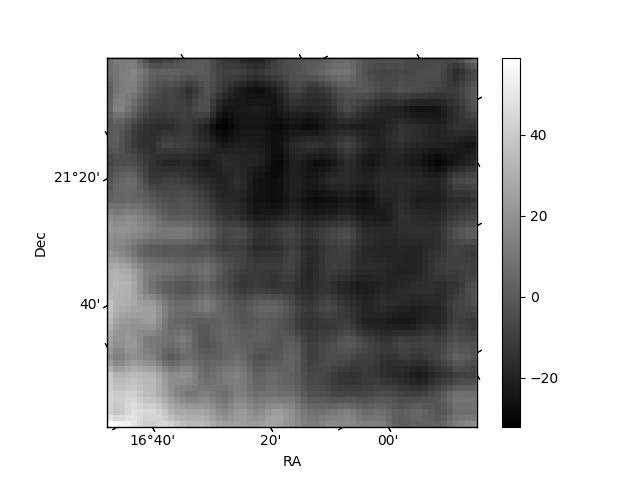
Quadrant B |
|---|---|---|---|
| Quadrant D | 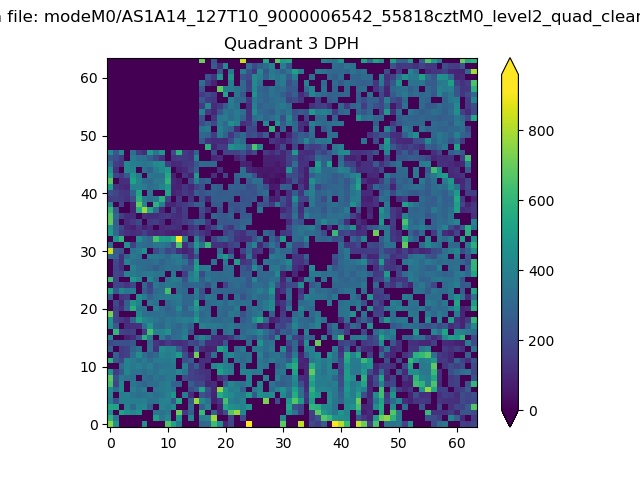 |
 |
Quadrant C |
| Plot type | Count rate plots | Images |
|---|---|---|
| Comparison with Poisson distribution Blue bars denote a histogram of data divided into 1 sec bins. Red curve is a Poisson curve with rate = median count rate of data. |
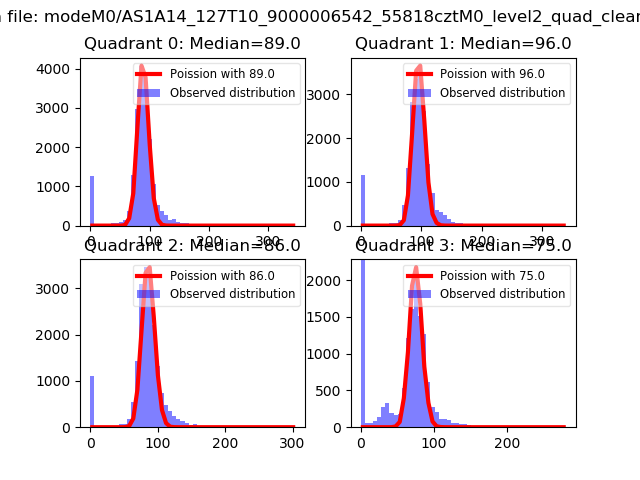 |
 |
| Quadrant-wise count rates Data is divided into 100 sec bins |
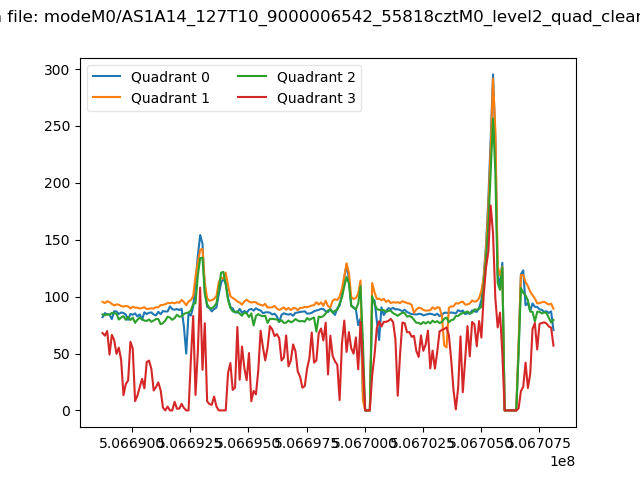 |
|
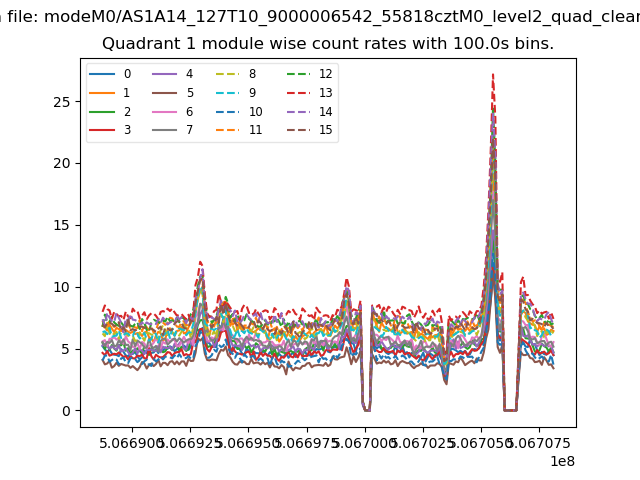
| Module-wise count rates for Quadrant A Data is divided into 100 sec bins |
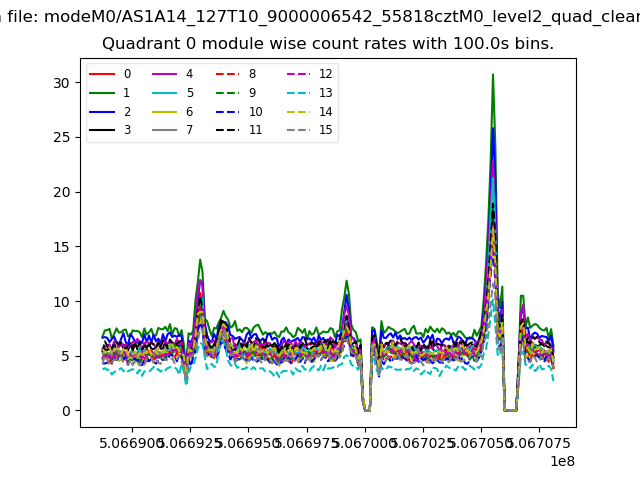 |
 |
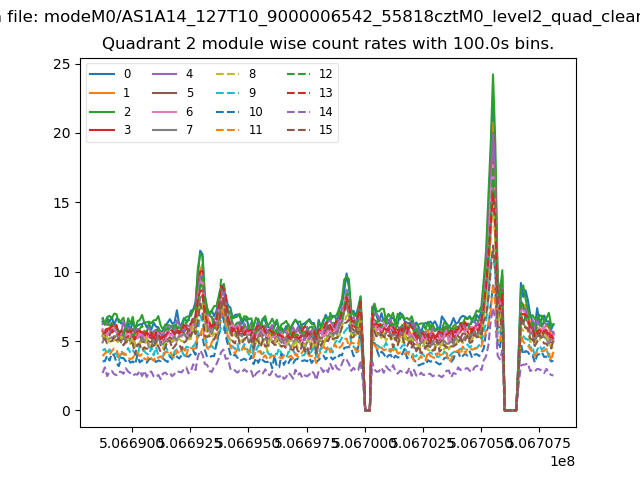
| Module-wise count rates for Quadrant B Data is divided into 100 sec bins |
 |
 |
| Module-wise count rates for Quadrant C Data is divided into 100 sec bins |
 |
 |
| Module-wise count rates for Quadrant D Data is divided into 100 sec bins |
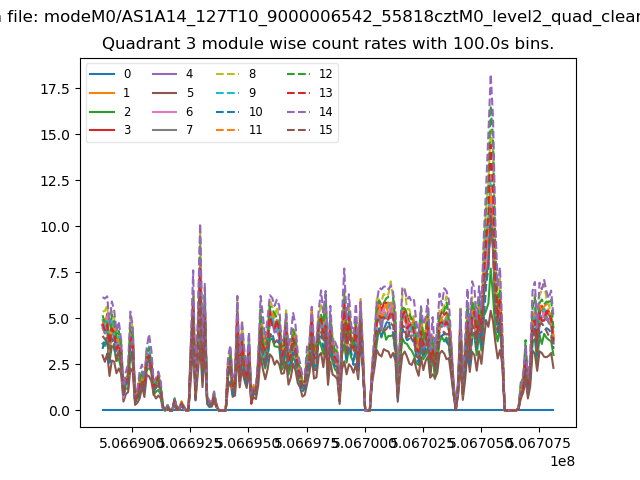 |
 |
| Parameter | Plot |
|---|---|
| CZT HV Monitor | 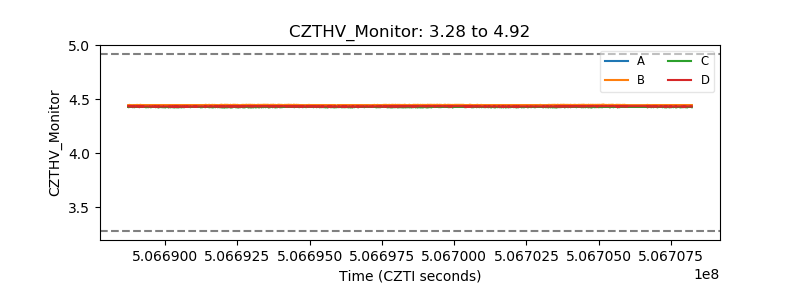 |
| D_VDD | 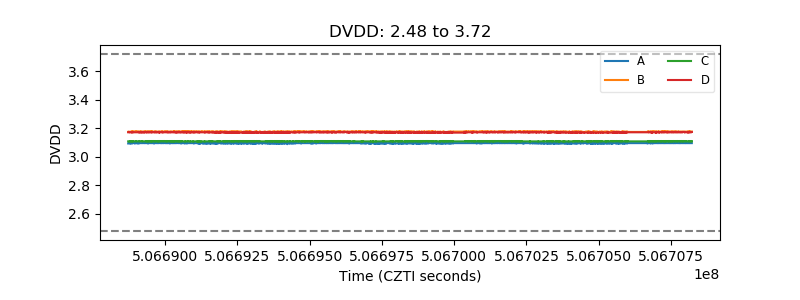 |
| Temperature 1 | 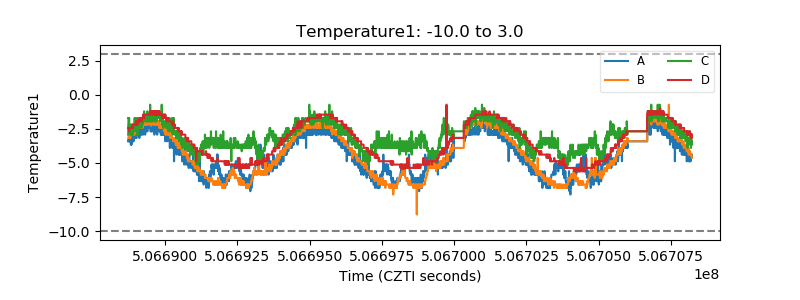 |
| Veto HV Monitor | 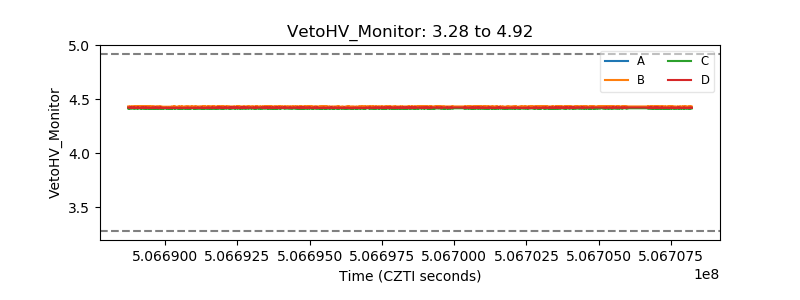 |
| Veto LLD | 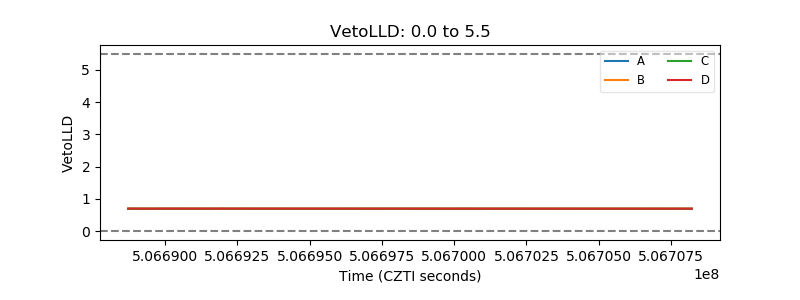 |
| Alpha Counter | 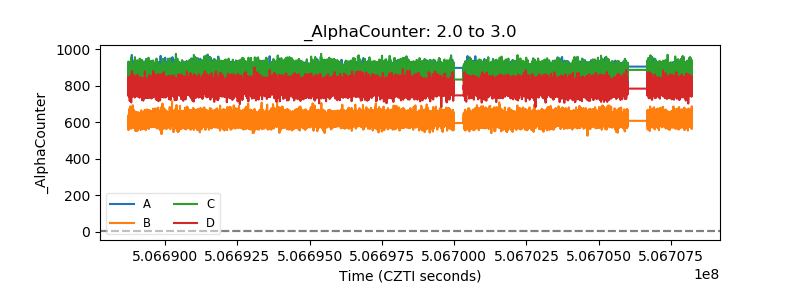 |
| _CPM_Rate | 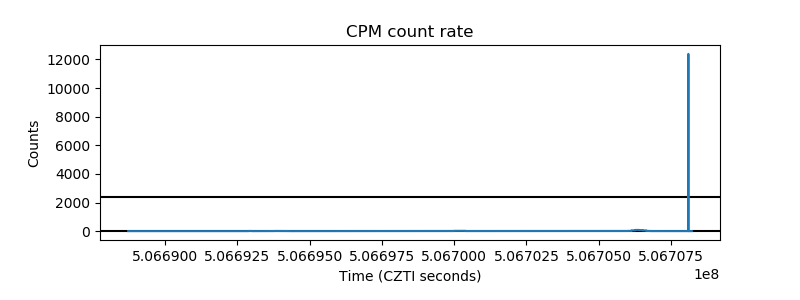 |
| CZT Counter | 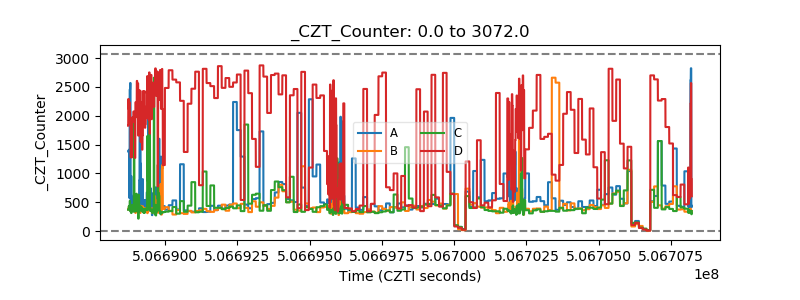 |
| +2.5 Volts monitor |  |
| +5 Volts monitor | 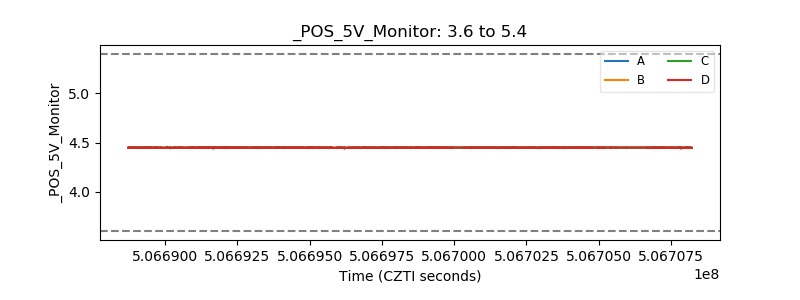 |
| _ROLL_ROT | 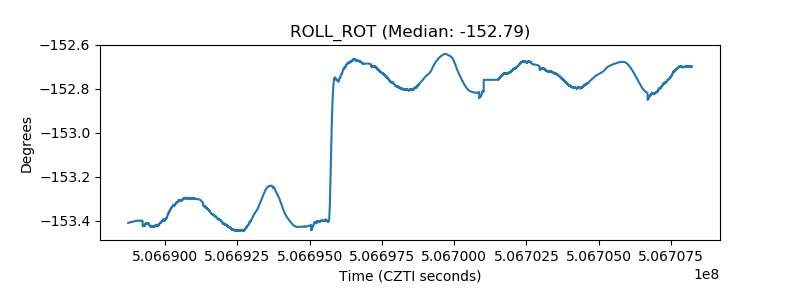 |
| _Roll_DEC | 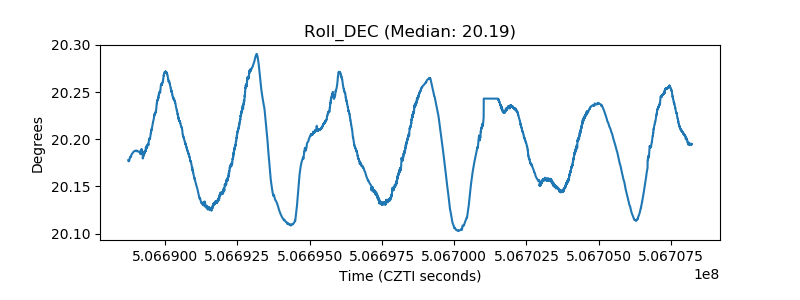 |
| _Roll_RA | 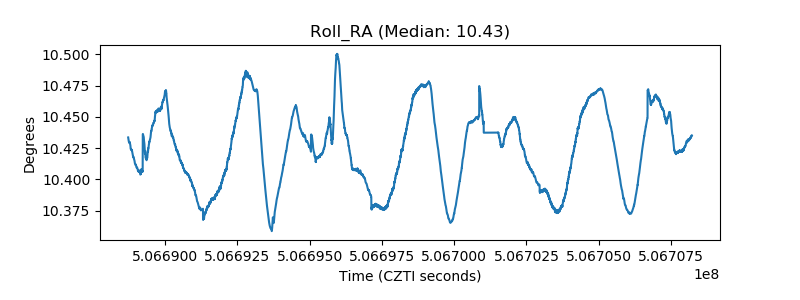 |
| Veto Counter | 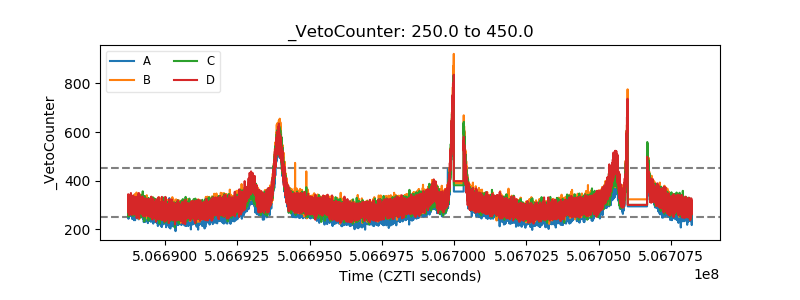 |