| Param | Original file | Final file |
|---|---|---|
| Filename | modeM0/AS1A14_127T10_9000006542_55819cztM0_level2.fits | modeM0/AS1A14_127T10_9000006542_55819cztM0_level2_quad_clean.evt |
| Size (bytes) | 507,816,000 | 87,822,720 |
| Size | 484.3 MB | 83.8 MB |
| Events in quadrant A | 3,904,499 | 612,666 |
| Events in quadrant B | 2,739,996 | 661,462 |
| Events in quadrant C | 3,069,633 | 587,247 |
| Events in quadrant D | 8,586,657 | 352,407 |
| Mode M0 | |||
|---|---|---|---|
| Quadrant | BADHDUFLAG | Total packets | Discarded packets |
| A | 0 | 16218 | 1 |
| B | 0 | 13495 | 1 |
| C | 0 | 14443 | 1 |
| D | 0 | 30207 | 1 |
| Mode M9 | |||
|---|---|---|---|
| Quadrant | BADHDUFLAG | Total packets | Discarded packets |
| A | 0 | 8 | 0 |
| B | 0 | 8 | 0 |
| C | 0 | 8 | 0 |
| D | 0 | 8 | 0 |
| Mode SS | |||
|---|---|---|---|
| Quadrant | BADHDUFLAG | Total packets | Discarded packets |
| A | 0 | 130 | 0 |
| B | 0 | 130 | 0 |
| C | 0 | 130 | 0 |
| D | 0 | 130 | 0 |
| Quadrant | Total seconds | Saturated seconds | Saturation percentage |
|---|---|---|---|
| A | 6384 | 247 | 3.869048% |
| B | 6384 | 61 | 0.955514% |
| C | 6385 | 106 | 1.660141% |
| D | 6385 | 2363 | 37.008614% |
Noise dominated data is calculated using 1-second bins in cleaned event files. If a bin has >2000 counts, and if more than 50% of those come from <1% of pixels, then it is considered to be noise-dominated and hence unusable.
| Quadrant | # 1 sec bins | Bins with >0 counts | Bins with >2000 counts | High rate bins dominated by noise | Noise dominated (total time) | Noise dominated (detector-on time) | Marked lightcurve |
|---|---|---|---|---|---|---|---|
| A | 7214 | 6385 | 189 | 189 | 2.62% | 2.96% | 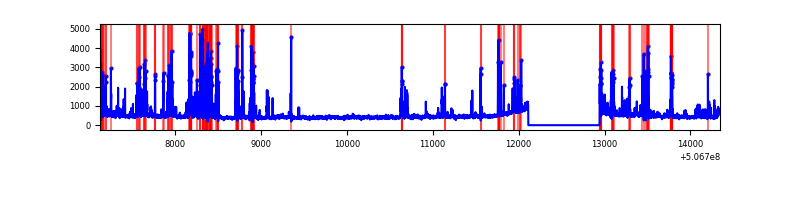 |
| B | 7214 | 6385 | 16 | 16 | 0.22% | 0.25% | 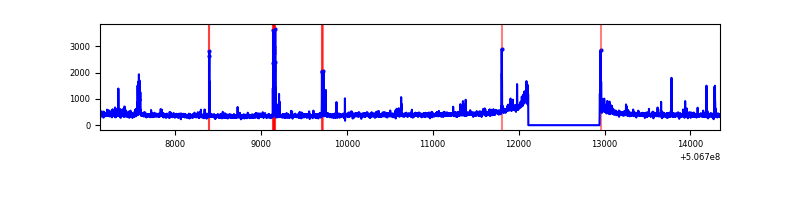 |
| C | 7215 | 6386 | 85 | 85 | 1.18% | 1.33% | 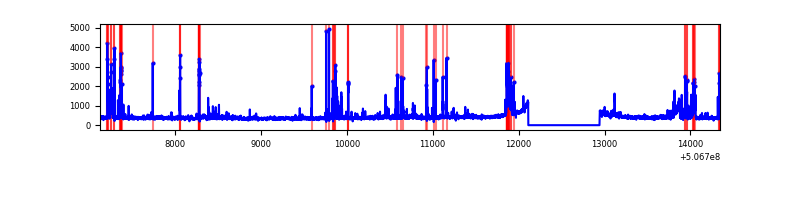 |
| D | 7214 | 6385 | 2290 | 2290 | 31.74% | 35.87% | 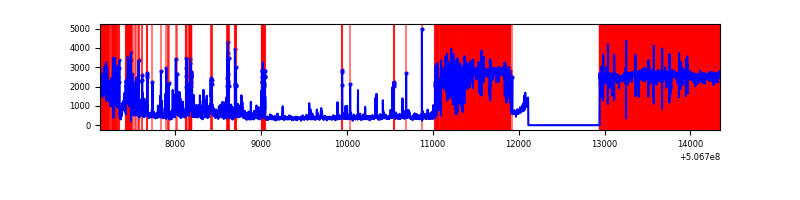 |
Top three noisy pixels from each quadrant. If the there are fewer than three noisy pixels in the level2.evt file, extra rows are filled as -1
| Pixel properties | Quadrant properties | ||||||
|---|---|---|---|---|---|---|---|
| Quadrant | DetID | PixID | Counts | Sigma | Mean | Median | Sigma |
| A | 8 | 249 | 647075 | 4009.19 | 635 | 621 | 161.2 |
| A | 0 | 8 | 181169 | 1119.73 | 635 | 621 | 161.2 |
| A | 8 | 192 | 174615 | 1079.08 | 635 | 621 | 161.2 |
| B | 5 | 185 | 84122 | 604.83 | 636 | 614 | 138.1 |
| B | 0 | 213 | 53617 | 383.89 | 636 | 614 | 138.1 |
| B | 5 | 172 | 45640 | 326.11 | 636 | 614 | 138.1 |
| C | 13 | 3 | 263413 | 1514.07 | 626 | 620 | 173.6 |
| C | 12 | 4 | 225867 | 1297.75 | 626 | 620 | 173.6 |
| C | 15 | 200 | 37085 | 210.09 | 626 | 620 | 173.6 |
| D | 2 | 62 | 3971610 | 29210.97 | 470 | 447 | 135.9 |
| D | 3 | 12 | 1926663 | 14168.81 | 470 | 447 | 135.9 |
| D | 11 | 129 | 670804 | 4930.99 | 470 | 447 | 135.9 |
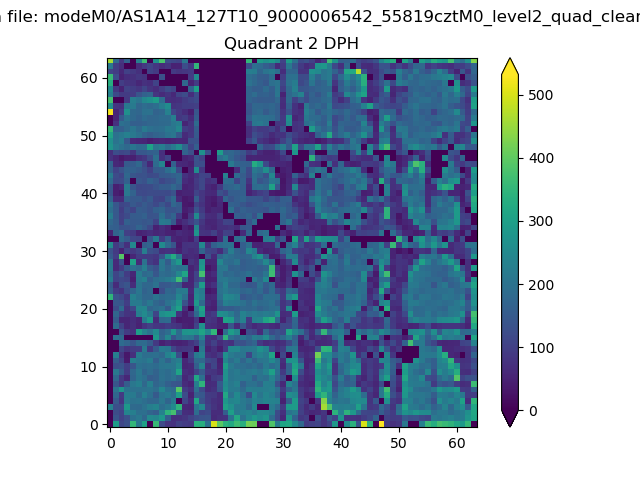
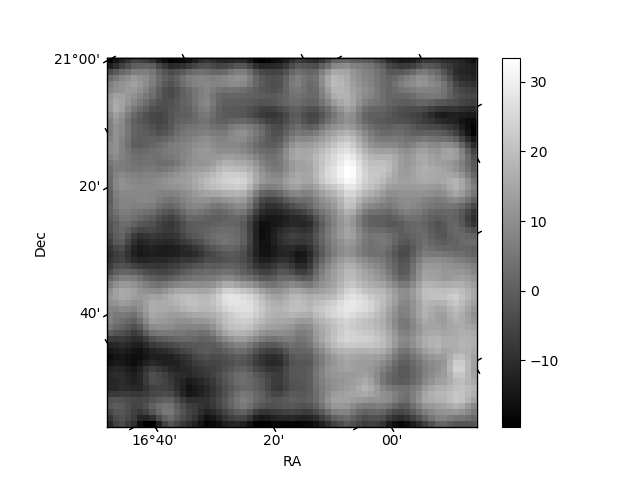
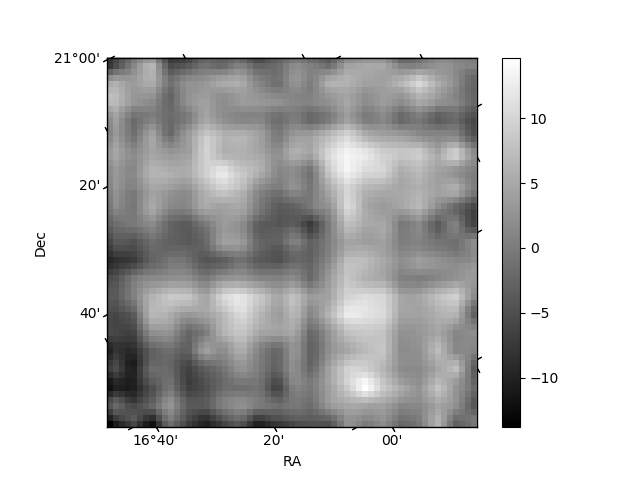
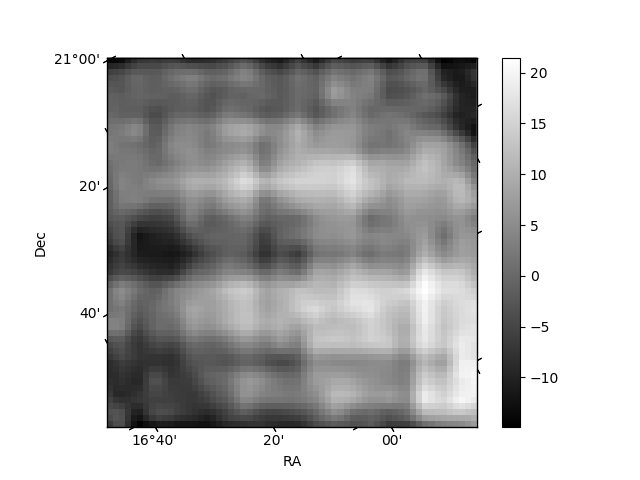
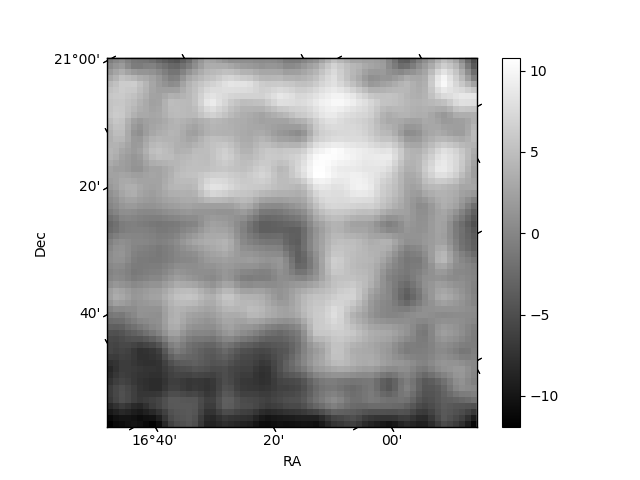
Histogram calculated using DETX and DETY for each event in the final _common_clean file
| Quadrant A | 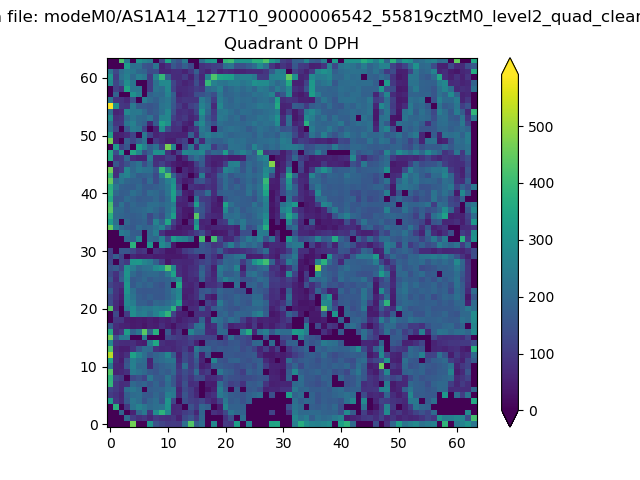 |
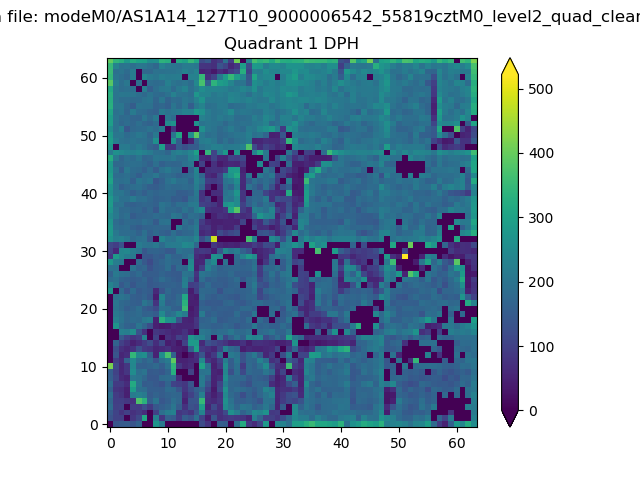 |
Quadrant B |
|---|---|---|---|
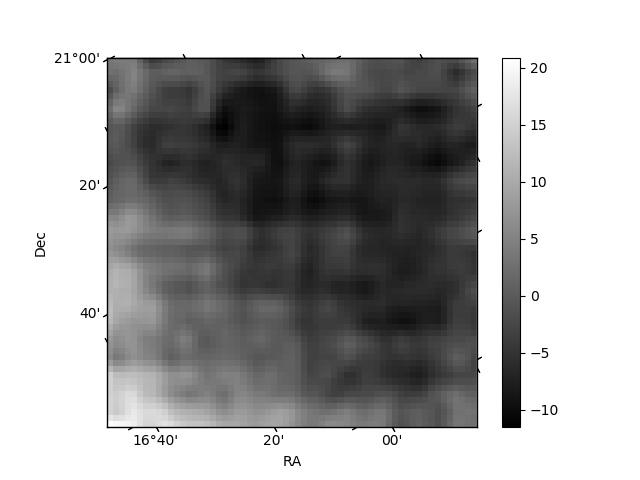
| Quadrant D | 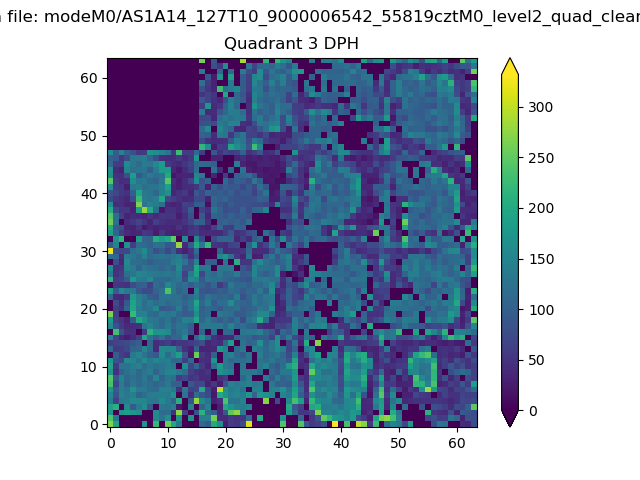 |
 |
Quadrant C |
| Plot type | Count rate plots | Images |
|---|---|---|
| Comparison with Poisson distribution Blue bars denote a histogram of data divided into 1 sec bins. Red curve is a Poisson curve with rate = median count rate of data. |
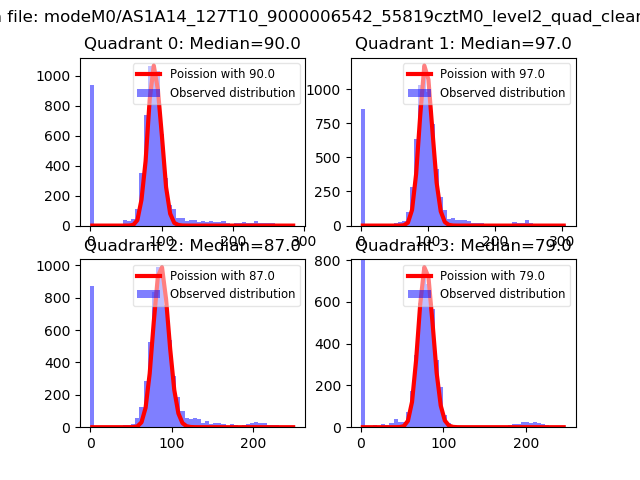 |
 |
| Quadrant-wise count rates Data is divided into 100 sec bins |
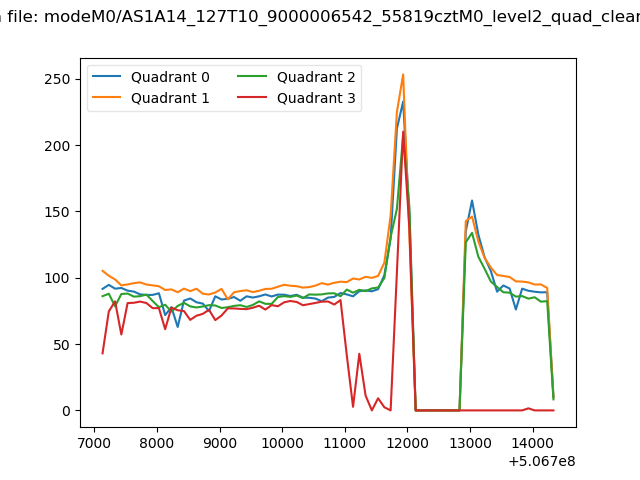 |
|
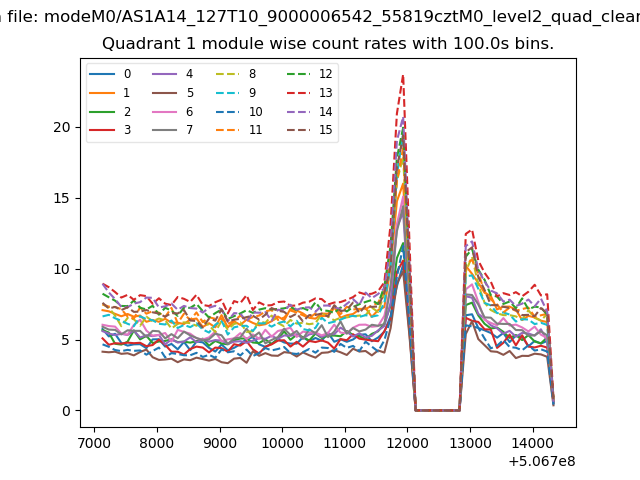
| Module-wise count rates for Quadrant A Data is divided into 100 sec bins |
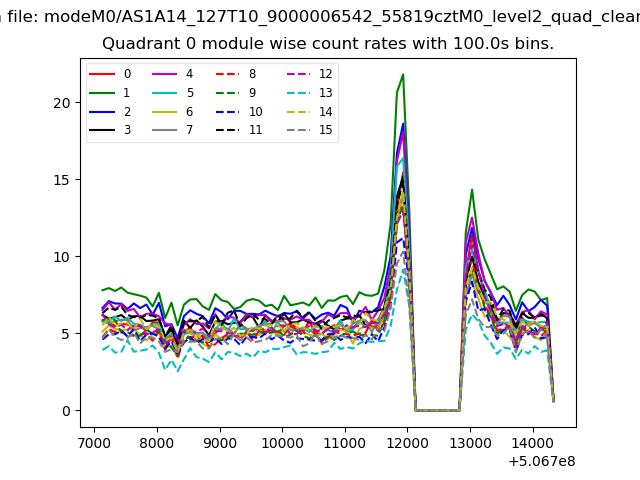 |
 |
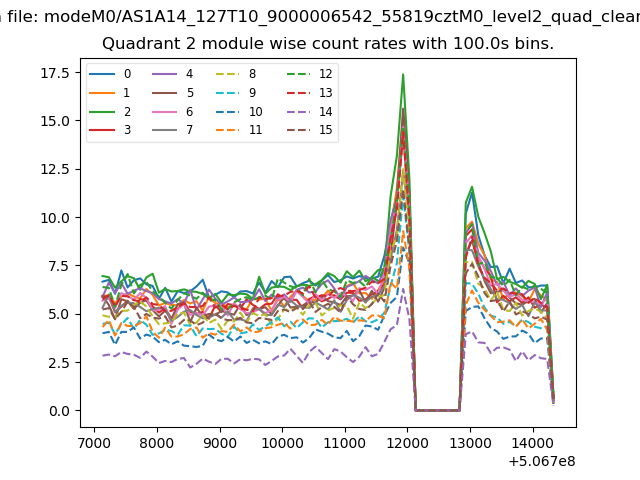
| Module-wise count rates for Quadrant B Data is divided into 100 sec bins |
 |
 |
| Module-wise count rates for Quadrant C Data is divided into 100 sec bins |
 |
 |
| Module-wise count rates for Quadrant D Data is divided into 100 sec bins |
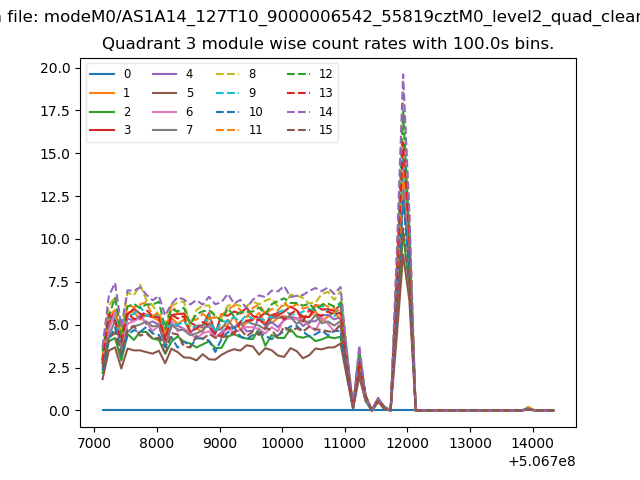 |
 |
| Parameter | Plot |
|---|---|
| CZT HV Monitor | 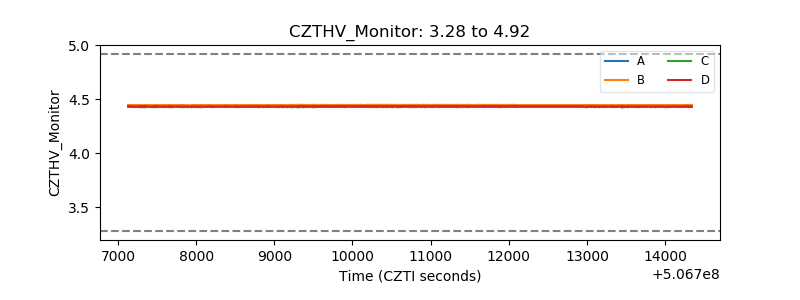 |
| D_VDD | 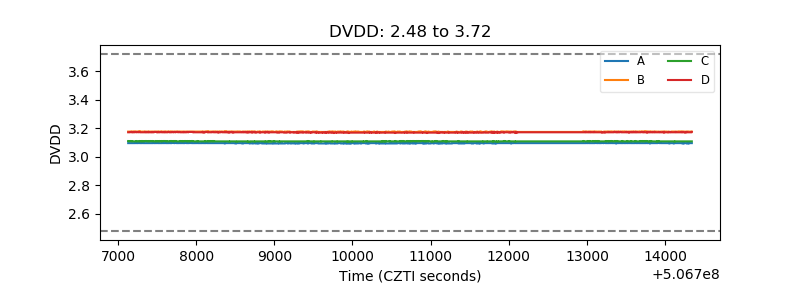 |
| Temperature 1 | 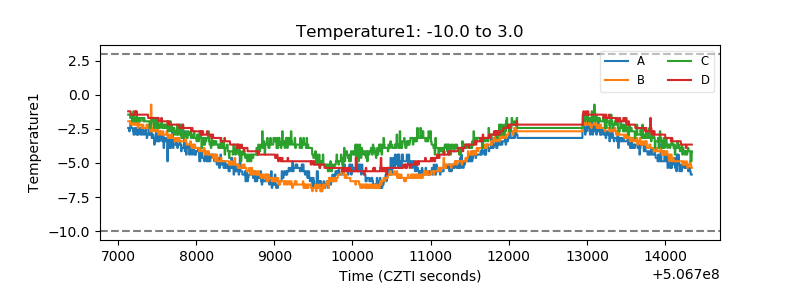 |
| Veto HV Monitor | 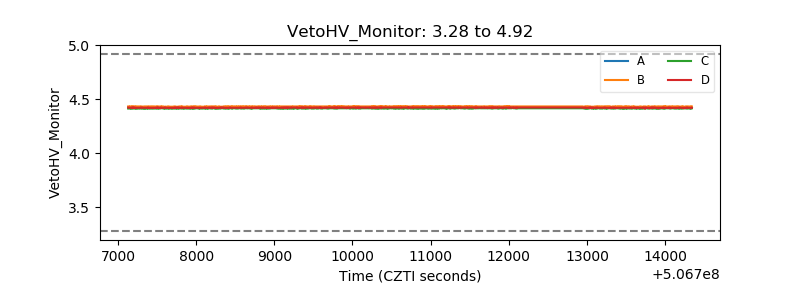 |
| Veto LLD | 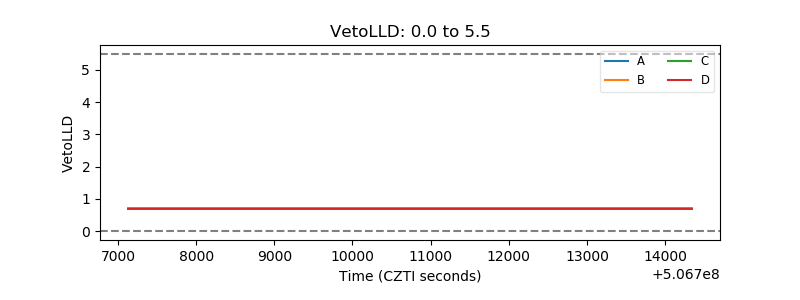 |
| Alpha Counter | 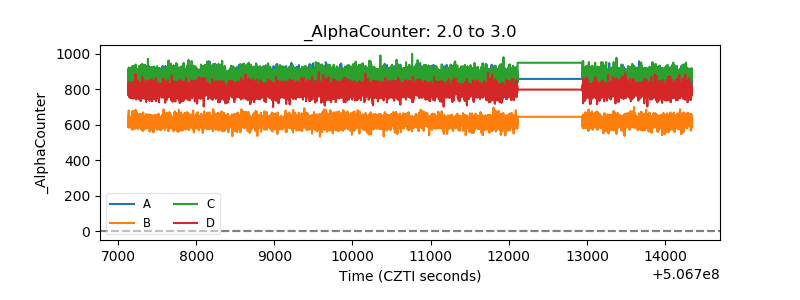 |
| _CPM_Rate | 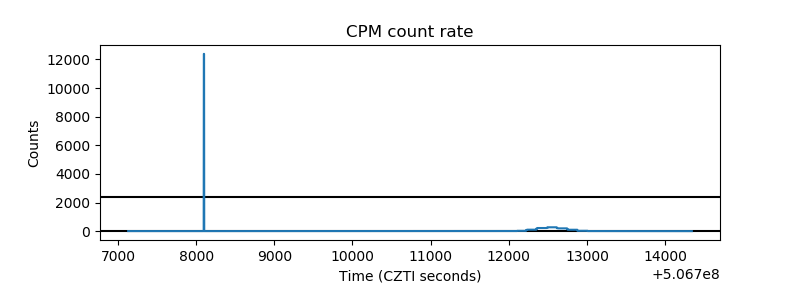 |
| CZT Counter | 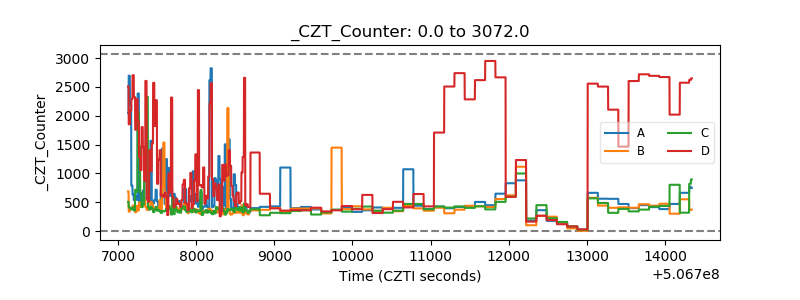 |
| +2.5 Volts monitor |  |
| +5 Volts monitor | 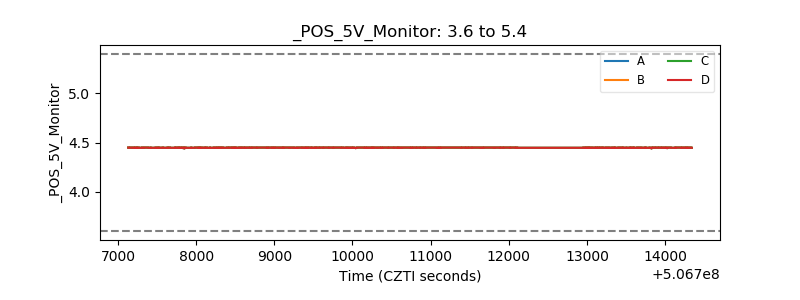 |
| _ROLL_ROT | 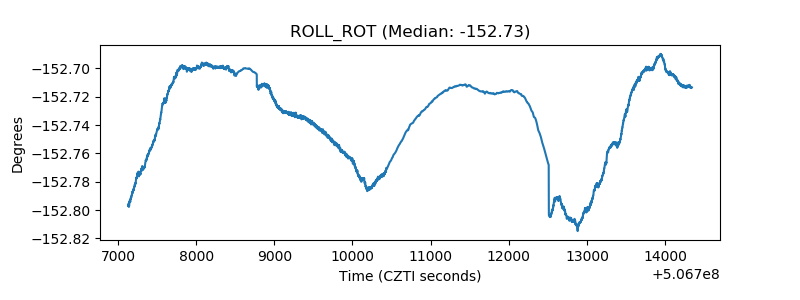 |
| _Roll_DEC | 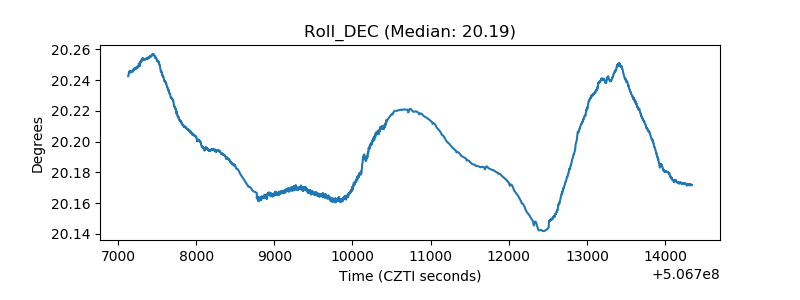 |
| _Roll_RA | 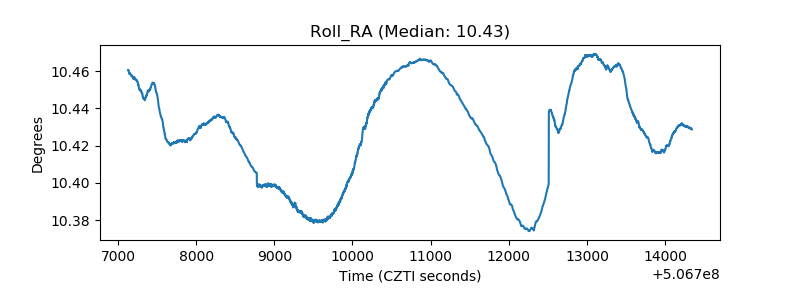 |
| Veto Counter | 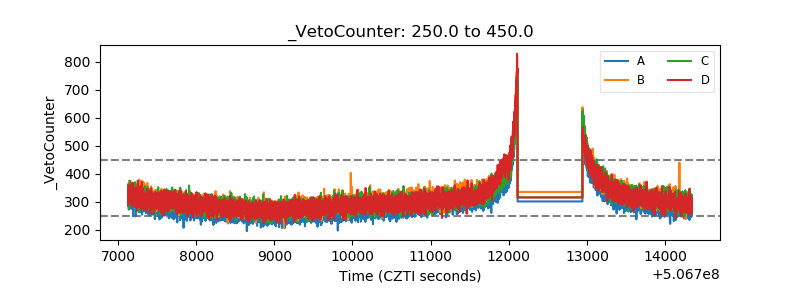 |