| Param | Original file | Final file |
|---|---|---|
| Filename | modeM0/AS1A14_127T10_9000006542_55821cztM0_level2.fits | modeM0/AS1A14_127T10_9000006542_55821cztM0_level2_quad_clean.evt |
| Size (bytes) | 669,240,000 | 88,151,040 |
| Size | 638.2 MB | 84.1 MB |
| Events in quadrant A | 5,423,425 | 600,261 |
| Events in quadrant B | 3,066,132 | 700,638 |
| Events in quadrant C | 3,040,673 | 633,245 |
| Events in quadrant D | 12,720,996 | 267,376 |
| Mode M0 | |||
|---|---|---|---|
| Quadrant | BADHDUFLAG | Total packets | Discarded packets |
| A | 0 | 20907 | 2 |
| B | 0 | 14520 | 2 |
| C | 0 | 14623 | 2 |
| D | 0 | 42439 | 3 |
| Mode M9 | |||
|---|---|---|---|
| Quadrant | BADHDUFLAG | Total packets | Discarded packets |
| A | 0 | 11 | 0 |
| B | 0 | 12 | 0 |
| C | 0 | 12 | 0 |
| D | 0 | 12 | 0 |
| Mode SS | |||
|---|---|---|---|
| Quadrant | BADHDUFLAG | Total packets | Discarded packets |
| A | 0 | 136 | 0 |
| B | 0 | 136 | 0 |
| C | 0 | 136 | 0 |
| D | 0 | 136 | 0 |
| Quadrant | Total seconds | Saturated seconds | Saturation percentage |
|---|---|---|---|
| A | 6709 | 861 | 12.833507% |
| B | 6709 | 75 | 1.117901% |
| C | 6709 | 57 | 0.849605% |
| D | 6708 | 4053 | 60.420394% |
Noise dominated data is calculated using 1-second bins in cleaned event files. If a bin has >2000 counts, and if more than 50% of those come from <1% of pixels, then it is considered to be noise-dominated and hence unusable.
| Quadrant | # 1 sec bins | Bins with >0 counts | Bins with >2000 counts | High rate bins dominated by noise | Noise dominated (total time) | Noise dominated (detector-on time) | Marked lightcurve |
|---|---|---|---|---|---|---|---|
| A | 7704 | 6710 | 797 | 797 | 10.35% | 11.88% | 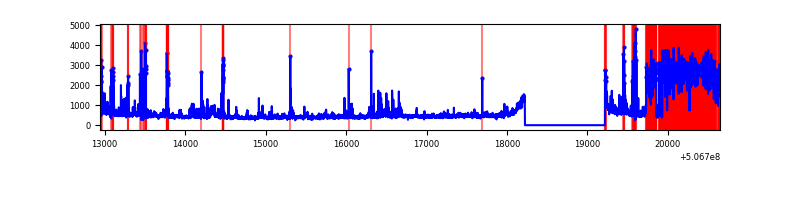 |
| B | 7704 | 6710 | 19 | 19 | 0.25% | 0.28% | 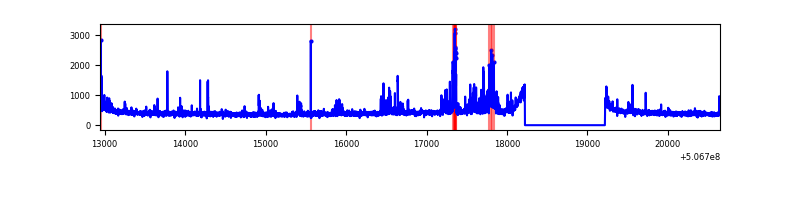 |
| C | 7704 | 6710 | 37 | 37 | 0.48% | 0.55% | 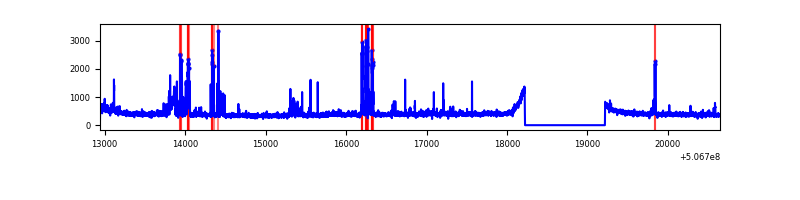 |
| D | 7703 | 6708 | 3901 | 3901 | 50.64% | 58.15% | 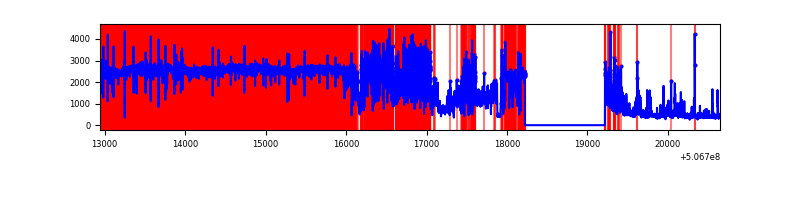 |
Top three noisy pixels from each quadrant. If the there are fewer than three noisy pixels in the level2.evt file, extra rows are filled as -1
| Pixel properties | Quadrant properties | ||||||
|---|---|---|---|---|---|---|---|
| Quadrant | DetID | PixID | Counts | Sigma | Mean | Median | Sigma |
| A | 12 | 115 | 1866366 | 11107.45 | 658 | 641 | 168.0 |
| A | 8 | 249 | 276877 | 1644.55 | 658 | 641 | 168.0 |
| A | 8 | 192 | 167634 | 994.18 | 658 | 641 | 168.0 |
| B | 0 | 213 | 284805 | 1920.52 | 679 | 656 | 148.0 |
| B | 0 | 199 | 31677 | 209.67 | 679 | 656 | 148.0 |
| B | 10 | 247 | 22970 | 150.82 | 679 | 656 | 148.0 |
| C | 12 | 4 | 174271 | 917.7 | 673 | 664 | 189.2 |
| C | 10 | 22 | 81434 | 426.96 | 673 | 664 | 189.2 |
| C | 13 | 3 | 66044 | 345.6 | 673 | 664 | 189.2 |
| D | 2 | 62 | 10729456 | 91544.91 | 402 | 384 | 117.2 |
| D | 11 | 129 | 168478 | 1434.25 | 402 | 384 | 117.2 |
| D | 8 | 160 | 92374 | 784.9 | 402 | 384 | 117.2 |
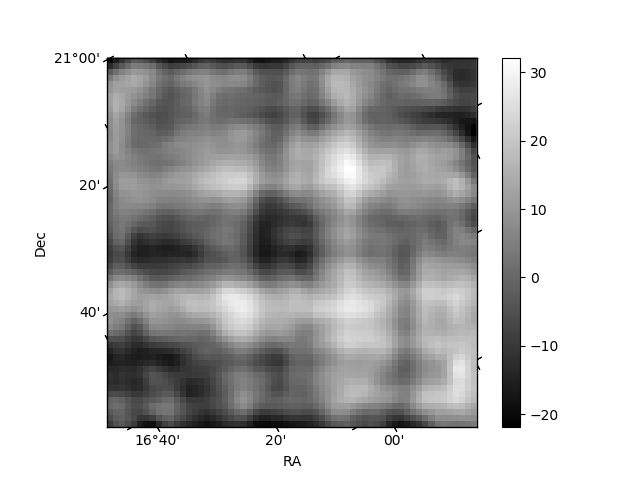
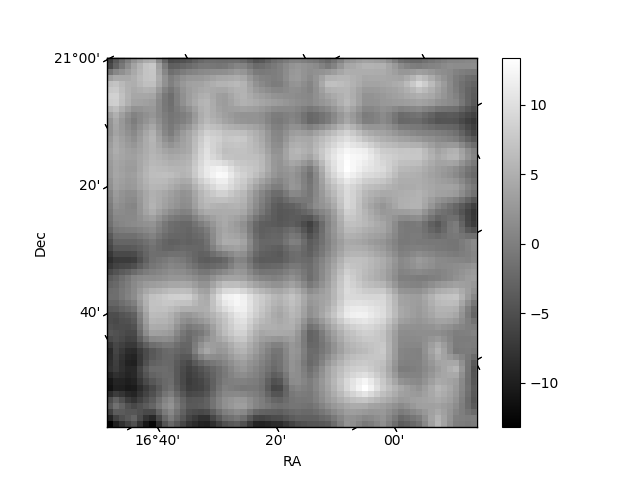
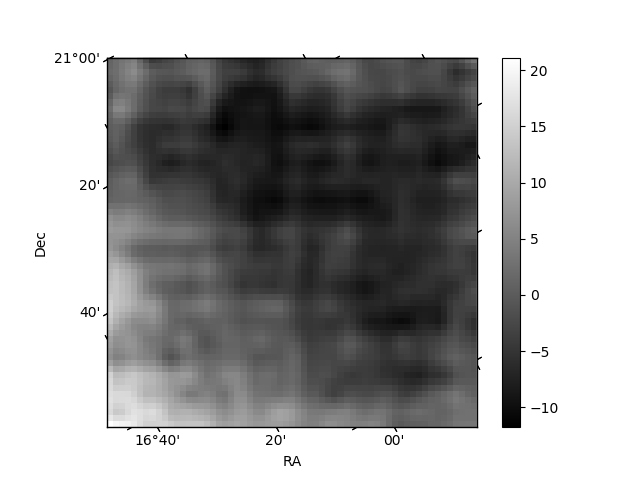
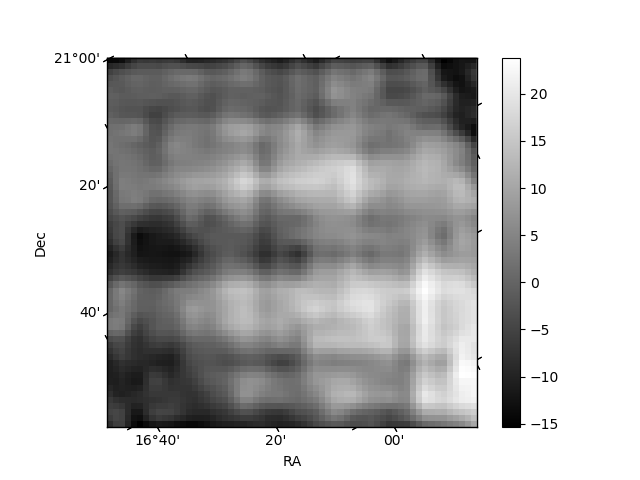
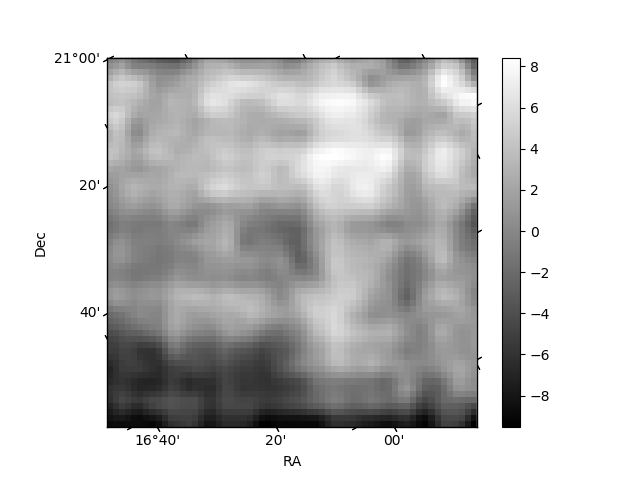
Histogram calculated using DETX and DETY for each event in the final _common_clean file
| Quadrant A | 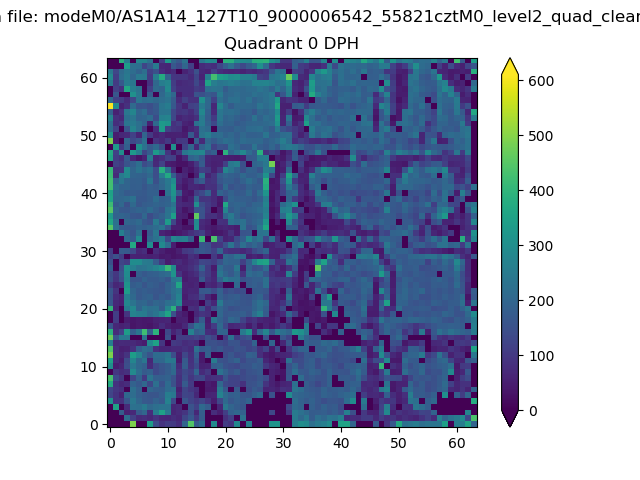 |
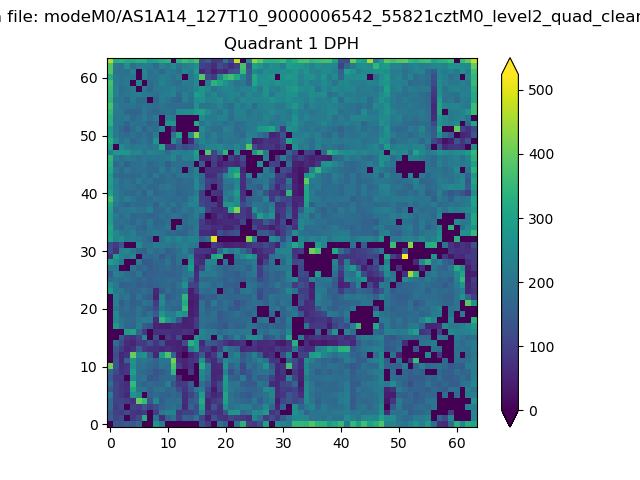 |
Quadrant B |
|---|---|---|---|
| Quadrant D | 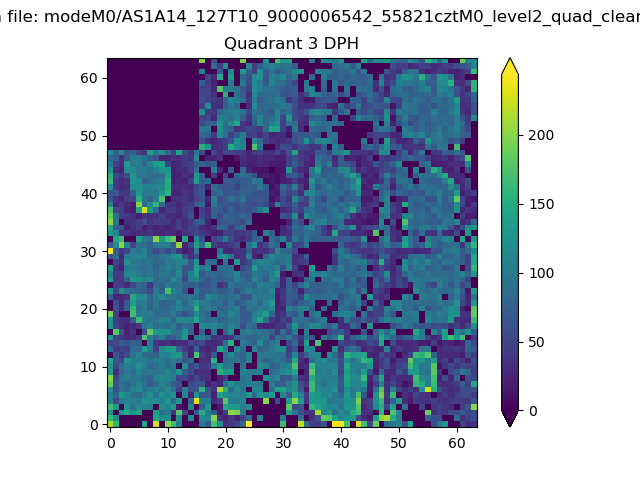 |
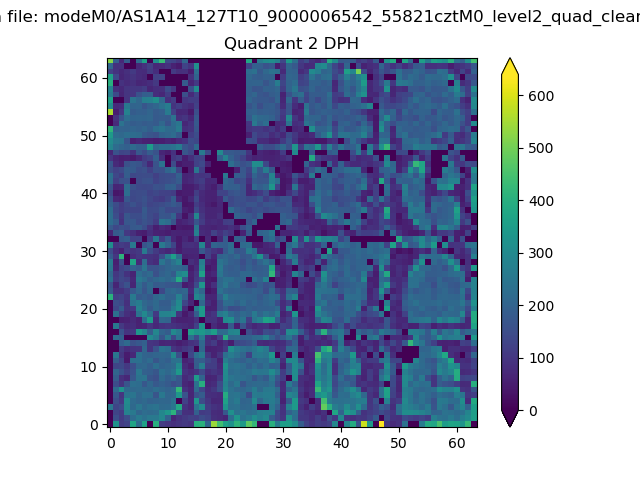 |
Quadrant C |
| Plot type | Count rate plots | Images |
|---|---|---|
| Comparison with Poisson distribution Blue bars denote a histogram of data divided into 1 sec bins. Red curve is a Poisson curve with rate = median count rate of data. |
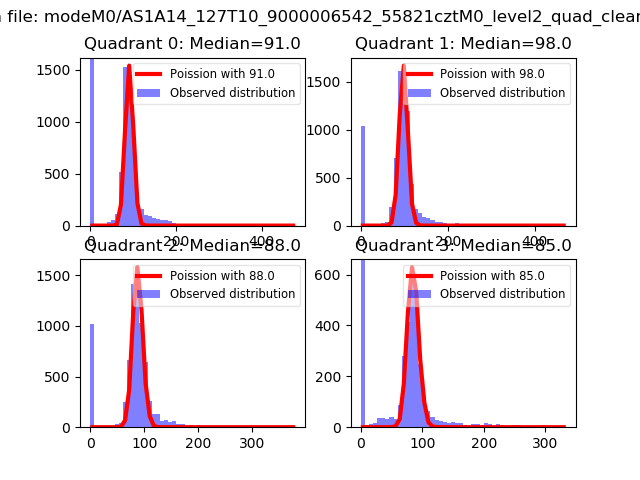 |
 |
| Quadrant-wise count rates Data is divided into 100 sec bins |
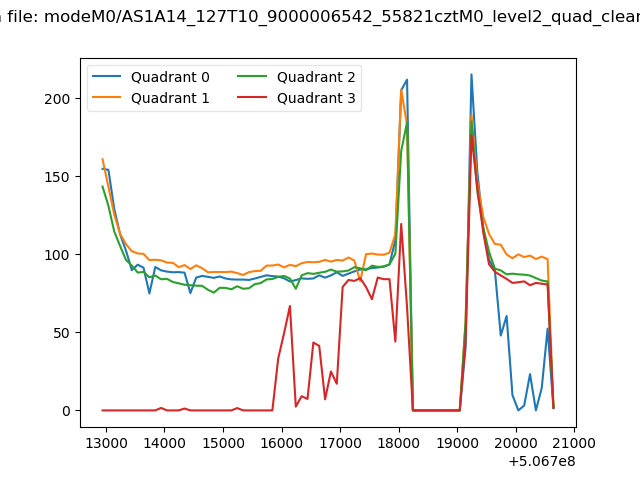 |
|
| Module-wise count rates for Quadrant A Data is divided into 100 sec bins |
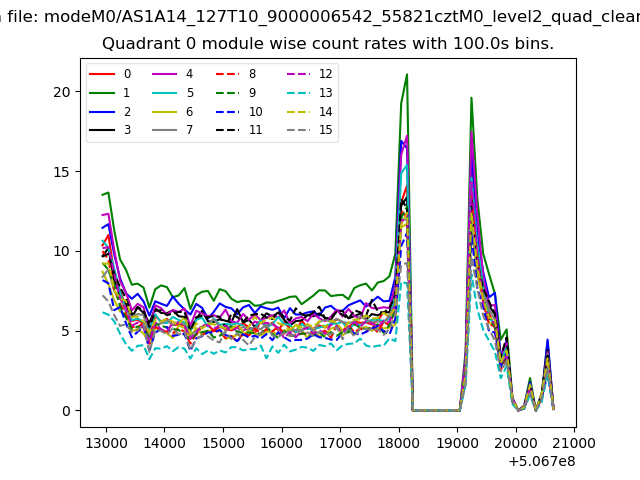 |
 |
| Module-wise count rates for Quadrant B Data is divided into 100 sec bins |
 |
 |
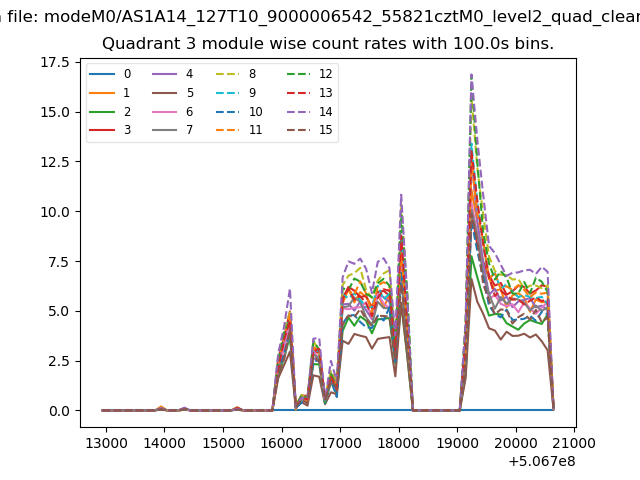
| Module-wise count rates for Quadrant C Data is divided into 100 sec bins |
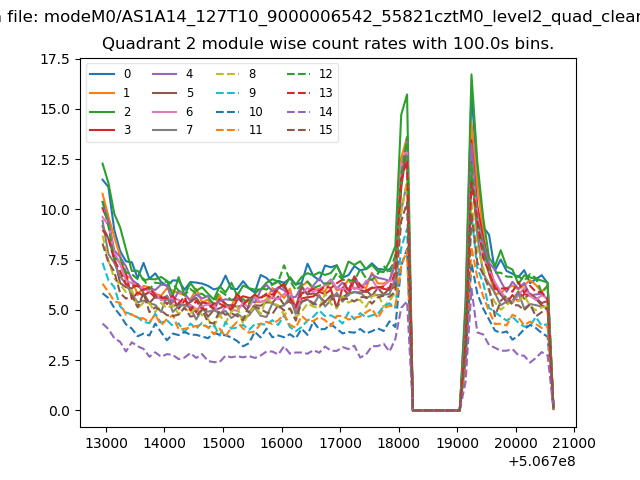 |
 |
| Module-wise count rates for Quadrant D Data is divided into 100 sec bins |
 |
 |
| Parameter | Plot |
|---|---|
| CZT HV Monitor | 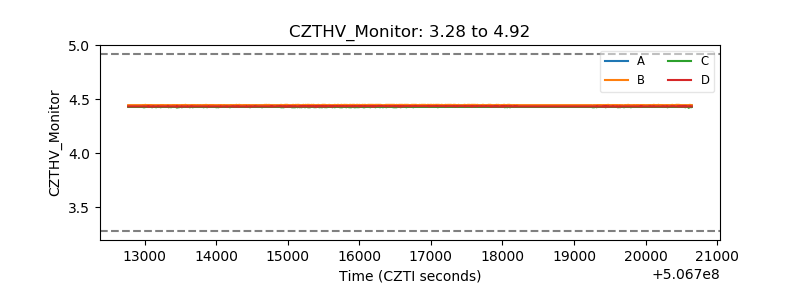 |
| D_VDD | 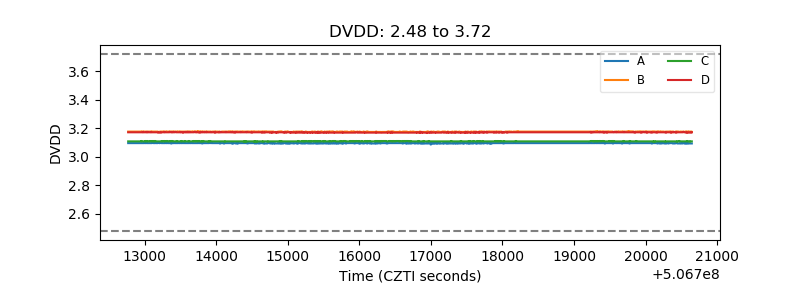 |
| Temperature 1 | 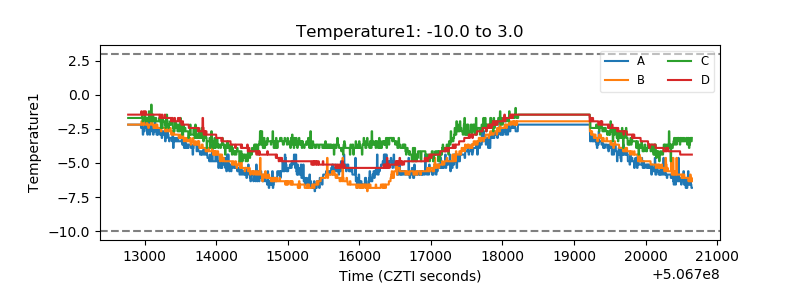 |
| Veto HV Monitor | 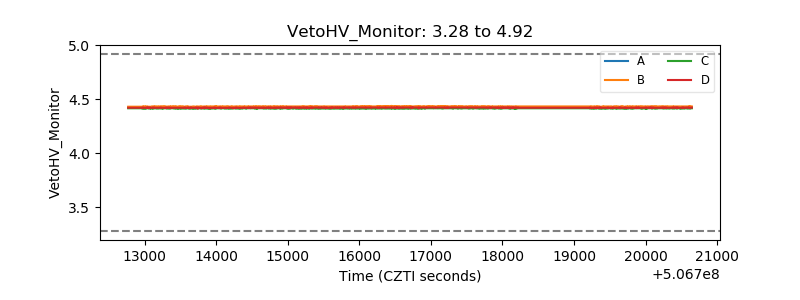 |
| Veto LLD | 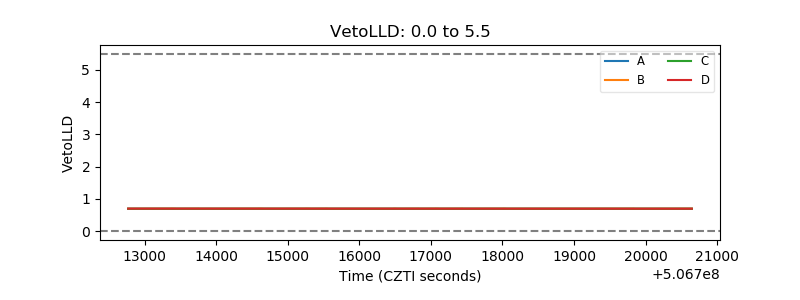 |
| Alpha Counter | 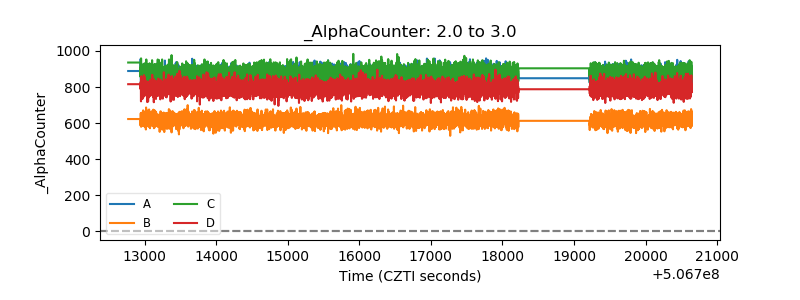 |
| _CPM_Rate | 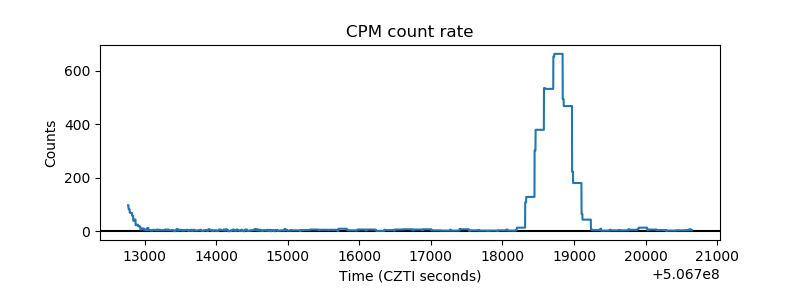 |
| CZT Counter | 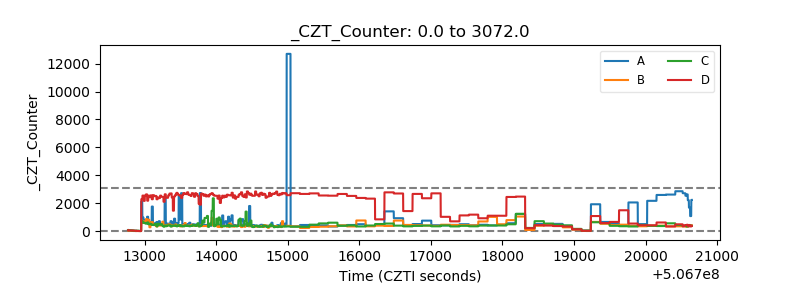 |
| +2.5 Volts monitor |  |
| +5 Volts monitor |  |
| _ROLL_ROT | 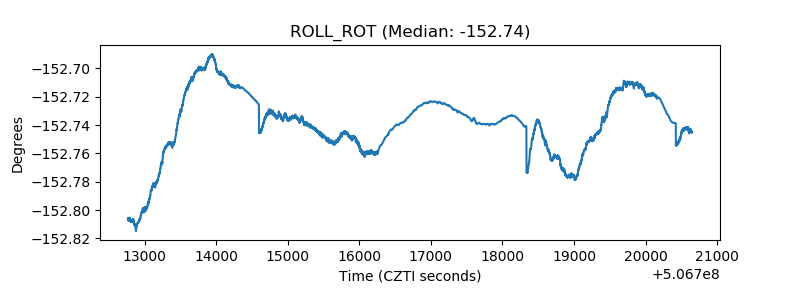 |
| _Roll_DEC | 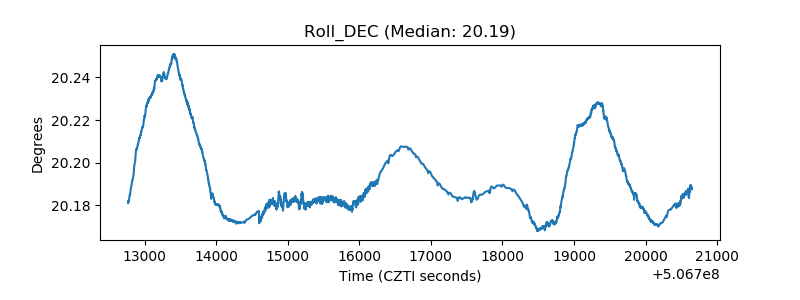 |
| _Roll_RA | 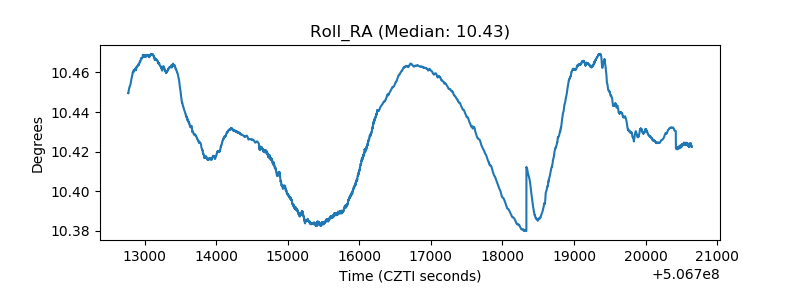 |
| Veto Counter | 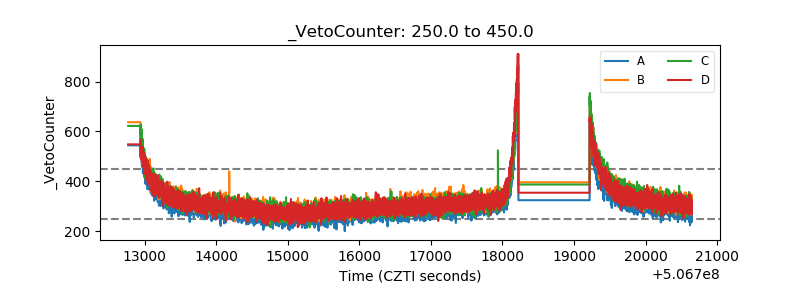 |