| Param | Original file | Final file |
|---|---|---|
| Filename | modeM0/AS1A14_127T10_9000006542_55823cztM0_level2.fits | modeM0/AS1A14_127T10_9000006542_55823cztM0_level2_quad_clean.evt |
| Size (bytes) | 526,072,320 | 94,150,080 |
| Size | 501.7 MB | 89.8 MB |
| Events in quadrant A | 5,778,244 | 571,379 |
| Events in quadrant B | 3,084,178 | 692,861 |
| Events in quadrant C | 4,196,038 | 604,925 |
| Events in quadrant D | 5,894,280 | 514,562 |
| Mode M0 | |||
|---|---|---|---|
| Quadrant | BADHDUFLAG | Total packets | Discarded packets |
| A | 0 | 21831 | 2 |
| B | 0 | 14397 | 2 |
| C | 0 | 17571 | 2 |
| D | 0 | 22320 | 2 |
| Mode M9 | |||
|---|---|---|---|
| Quadrant | BADHDUFLAG | Total packets | Discarded packets |
| A | 0 | 17 | 0 |
| B | 0 | 18 | 0 |
| C | 0 | 18 | 0 |
| D | 0 | 18 | 0 |
| Mode SS | |||
|---|---|---|---|
| Quadrant | BADHDUFLAG | Total packets | Discarded packets |
| A | 0 | 136 | 0 |
| B | 0 | 136 | 0 |
| C | 0 | 136 | 0 |
| D | 0 | 136 | 0 |
| Quadrant | Total seconds | Saturated seconds | Saturation percentage |
|---|---|---|---|
| A | 6700 | 833 | 12.432836% |
| B | 6700 | 89 | 1.328358% |
| C | 6700 | 314 | 4.686567% |
| D | 6700 | 933 | 13.925373% |
Noise dominated data is calculated using 1-second bins in cleaned event files. If a bin has >2000 counts, and if more than 50% of those come from <1% of pixels, then it is considered to be noise-dominated and hence unusable.
| Quadrant | # 1 sec bins | Bins with >0 counts | Bins with >2000 counts | High rate bins dominated by noise | Noise dominated (total time) | Noise dominated (detector-on time) | Marked lightcurve |
|---|---|---|---|---|---|---|---|
| A | 7870 | 6701 | 828 | 828 | 10.52% | 12.36% | 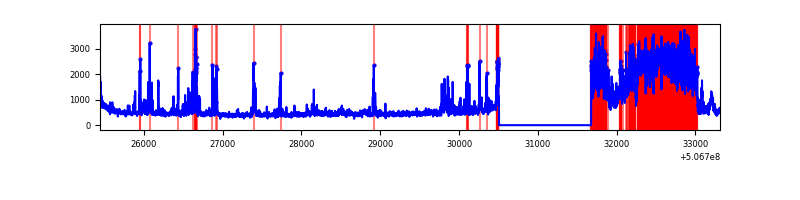 |
| B | 7870 | 6701 | 44 | 44 | 0.56% | 0.66% | 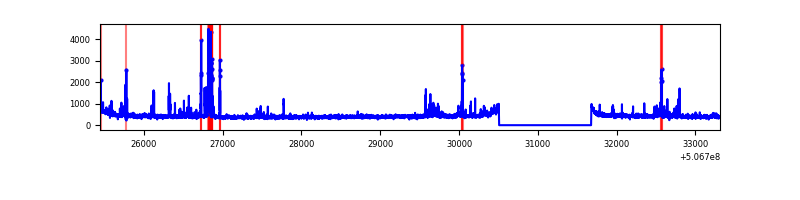 |
| C | 7870 | 6701 | 259 | 259 | 3.29% | 3.87% | 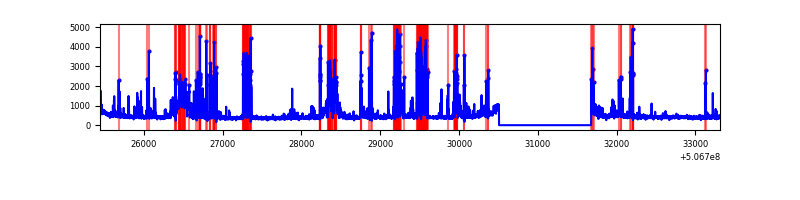 |
| D | 7870 | 6701 | 842 | 842 | 10.70% | 12.57% | 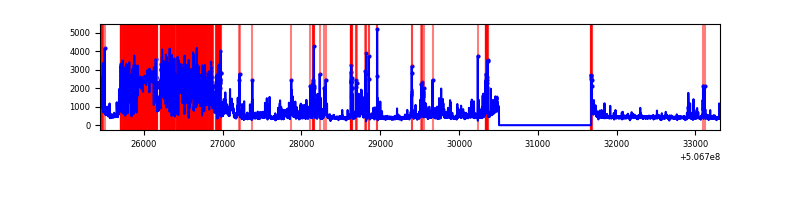 |
Top three noisy pixels from each quadrant. If the there are fewer than three noisy pixels in the level2.evt file, extra rows are filled as -1
| Pixel properties | Quadrant properties | ||||||
|---|---|---|---|---|---|---|---|
| Quadrant | DetID | PixID | Counts | Sigma | Mean | Median | Sigma |
| A | 12 | 115 | 2298144 | 13998.06 | 664 | 648 | 164.1 |
| A | 15 | 32 | 460607 | 2802.41 | 664 | 648 | 164.1 |
| A | 8 | 192 | 199693 | 1212.73 | 664 | 648 | 164.1 |
| B | 5 | 185 | 180651 | 1208.61 | 687 | 662 | 148.9 |
| B | 0 | 213 | 43208 | 285.69 | 687 | 662 | 148.9 |
| B | 10 | 247 | 38760 | 255.82 | 687 | 662 | 148.9 |
| C | 13 | 3 | 1061868 | 5728.4 | 672 | 666 | 185.3 |
| C | 6 | 223 | 393011 | 2117.89 | 672 | 666 | 185.3 |
| C | 1 | 16 | 38515 | 204.31 | 672 | 666 | 185.3 |
| D | 11 | 129 | 2172821 | 12048.75 | 629 | 601 | 180.3 |
| D | 8 | 160 | 815833 | 4521.88 | 629 | 601 | 180.3 |
| D | 7 | 96 | 160513 | 886.99 | 629 | 601 | 180.3 |
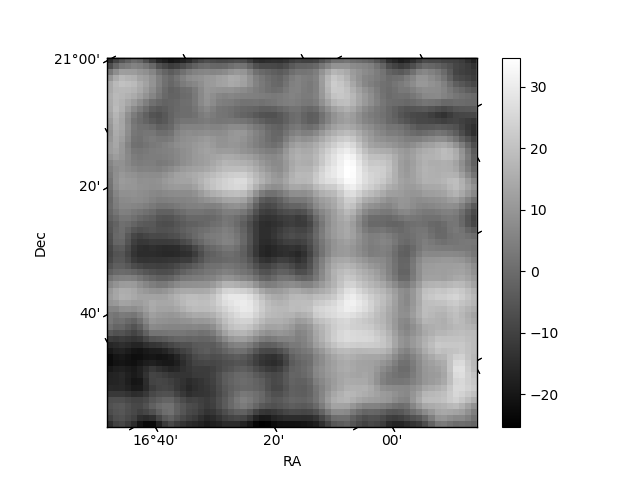
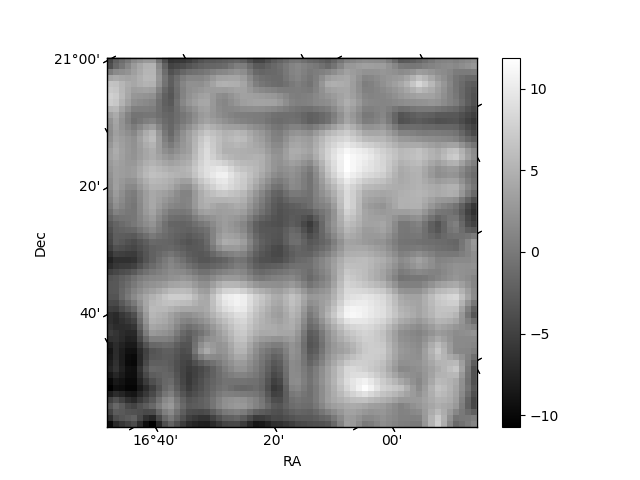
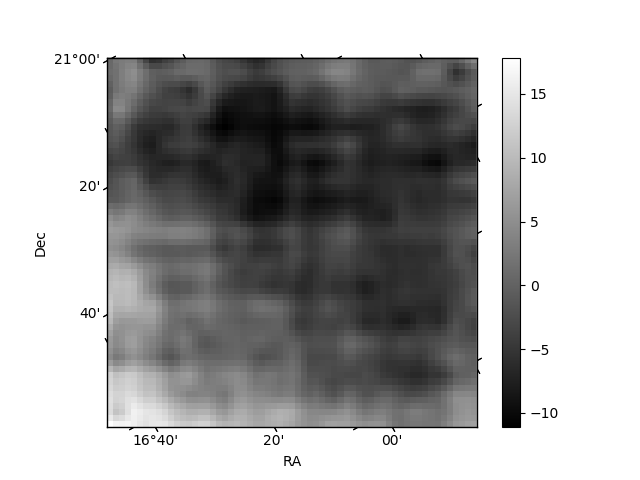
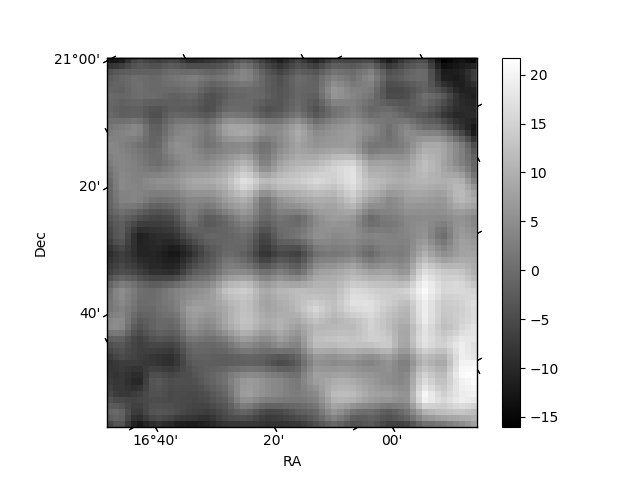
Histogram calculated using DETX and DETY for each event in the final _common_clean file
| Quadrant A | 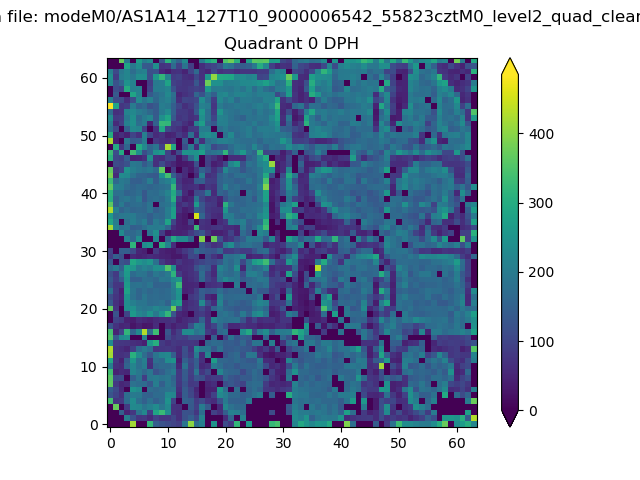 |
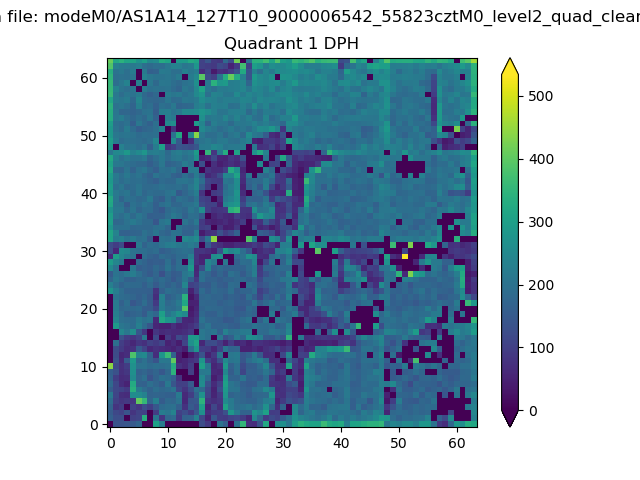 |
Quadrant B |
|---|---|---|---|
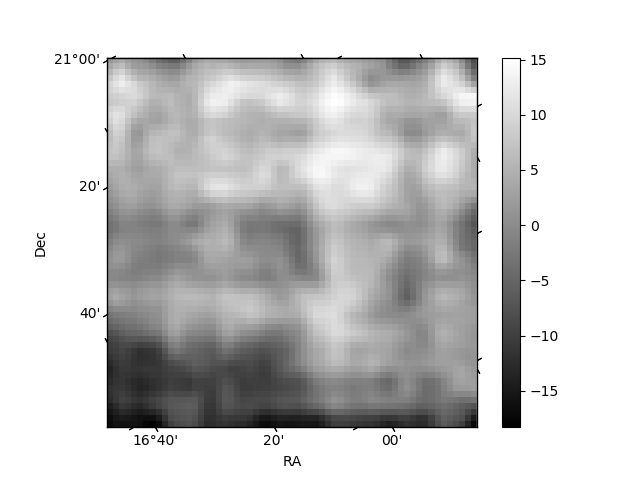
| Quadrant D | 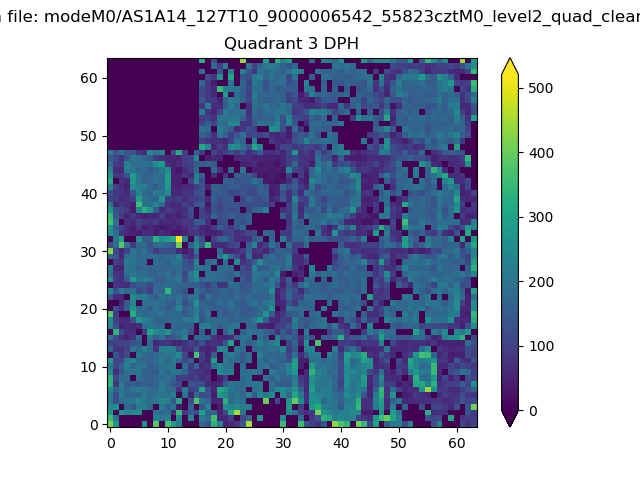 |
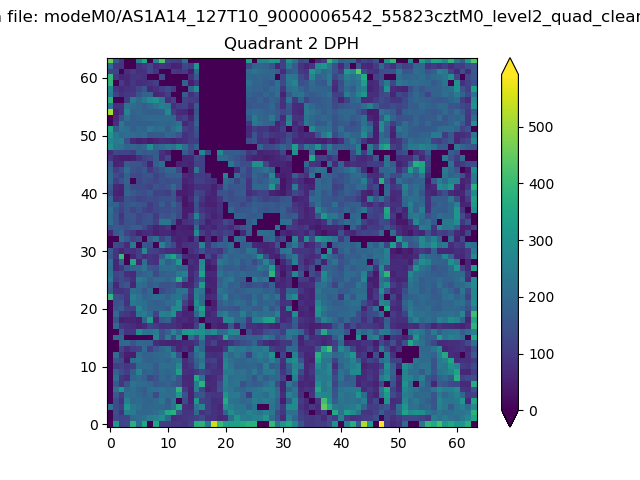 |
Quadrant C |
| Plot type | Count rate plots | Images |
|---|---|---|
| Comparison with Poisson distribution Blue bars denote a histogram of data divided into 1 sec bins. Red curve is a Poisson curve with rate = median count rate of data. |
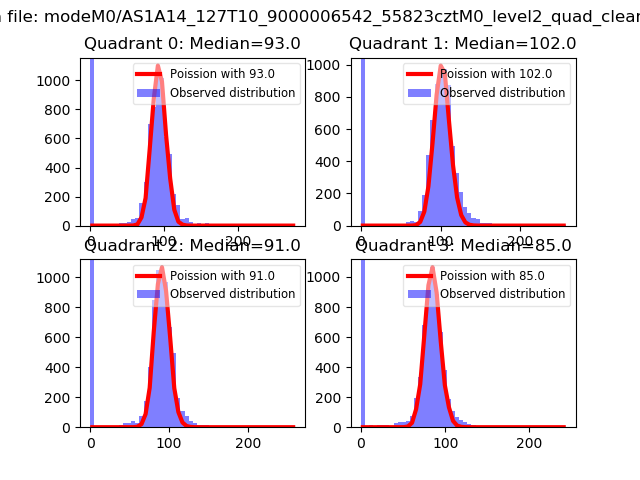 |
 |
| Quadrant-wise count rates Data is divided into 100 sec bins |
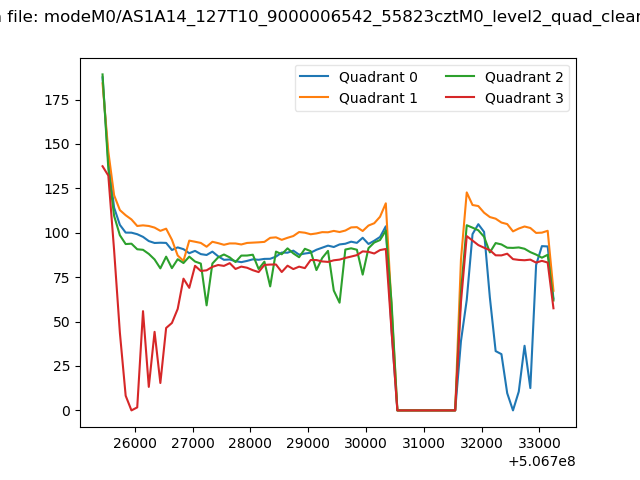 |
|
| Module-wise count rates for Quadrant A Data is divided into 100 sec bins |
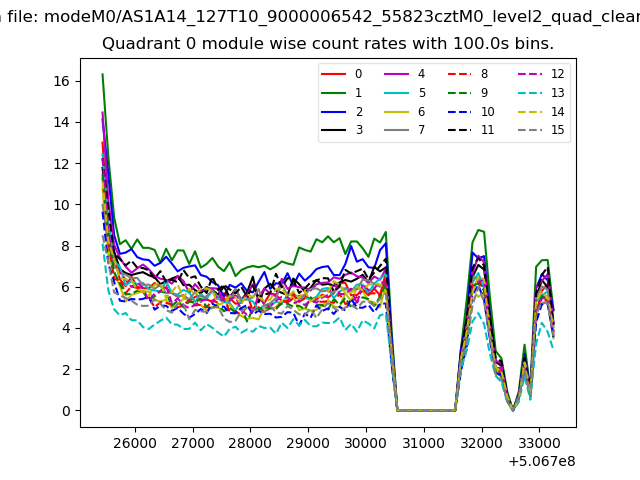 |
 |
| Module-wise count rates for Quadrant B Data is divided into 100 sec bins |
 |
 |
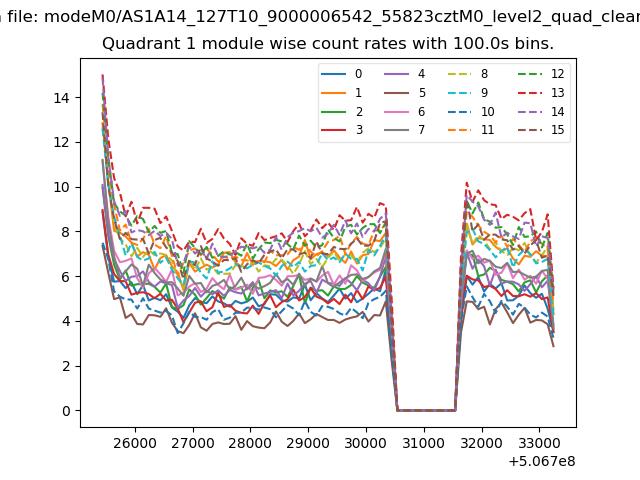
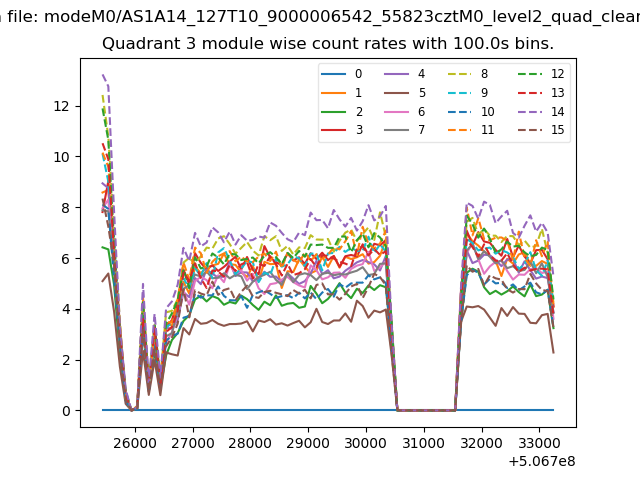
| Module-wise count rates for Quadrant C Data is divided into 100 sec bins |
 |
 |
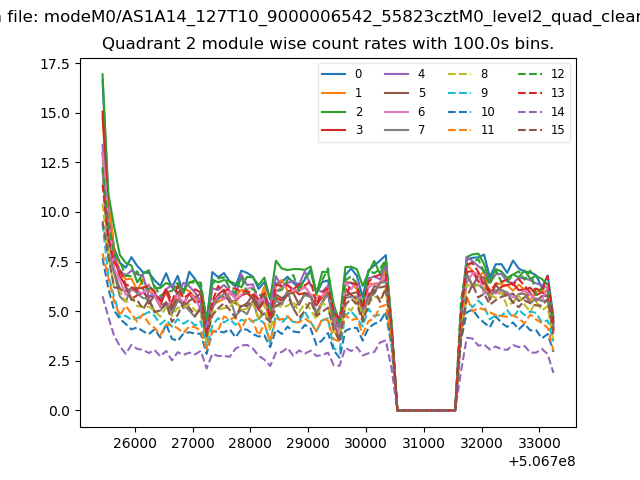
| Module-wise count rates for Quadrant D Data is divided into 100 sec bins |
 |
 |
| Parameter | Plot |
|---|---|
| CZT HV Monitor | 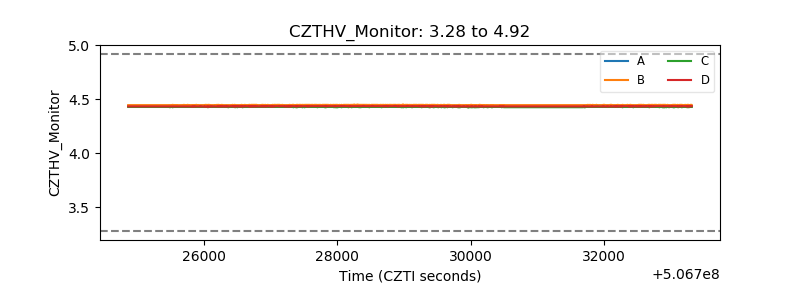 |
| D_VDD | 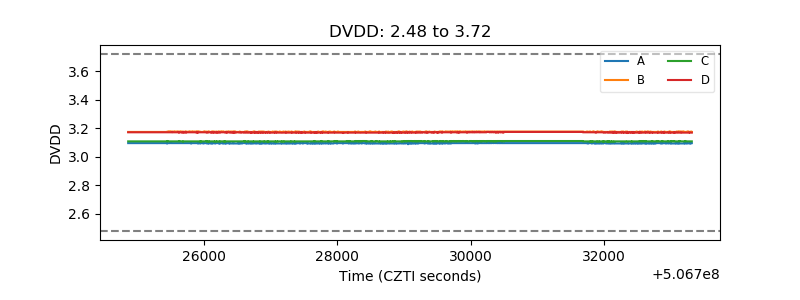 |
| Temperature 1 | 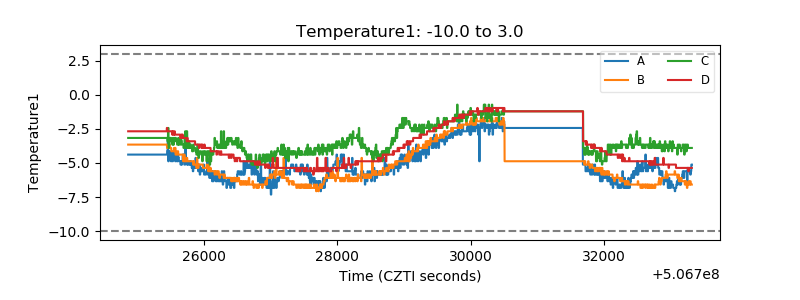 |
| Veto HV Monitor | 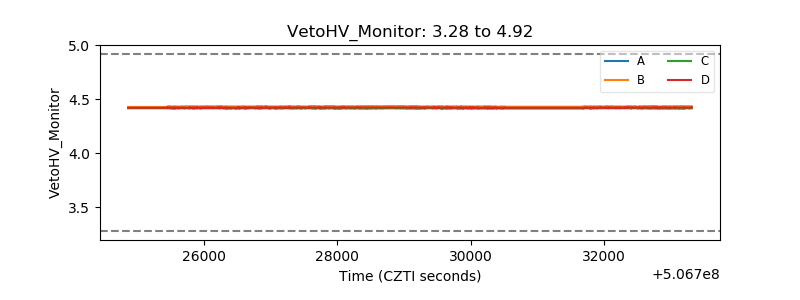 |
| Veto LLD | 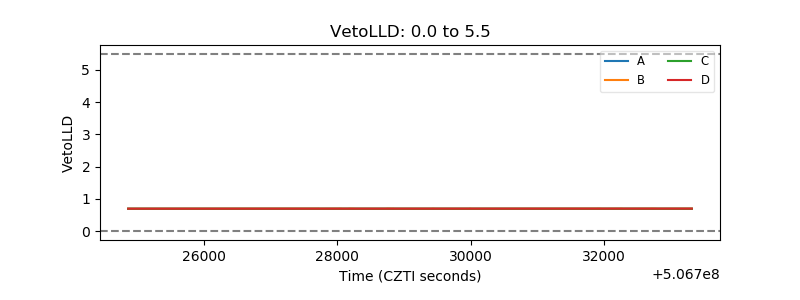 |
| Alpha Counter | 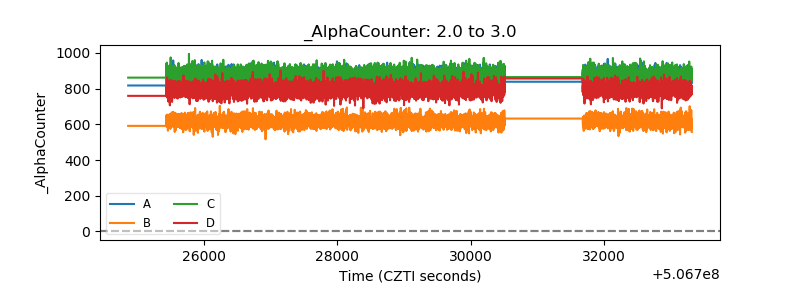 |
| _CPM_Rate | 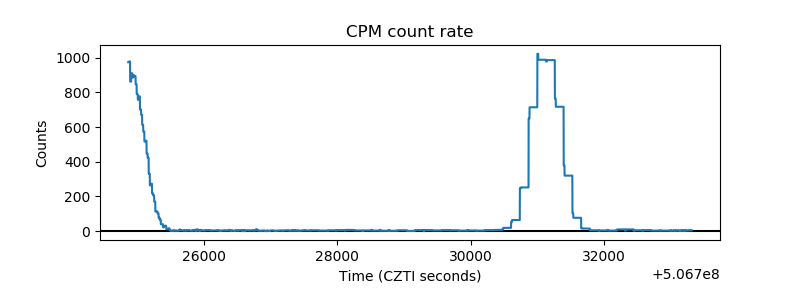 |
| CZT Counter | 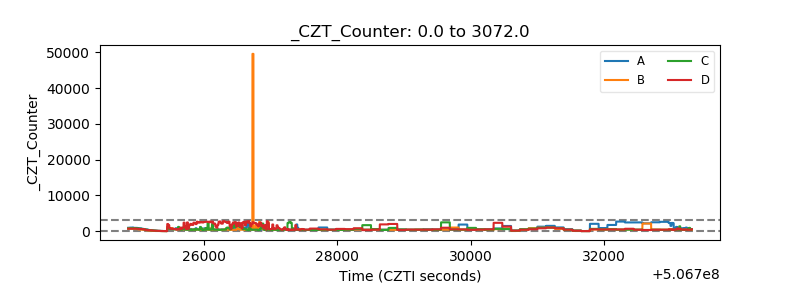 |
| +2.5 Volts monitor |  |
| +5 Volts monitor | 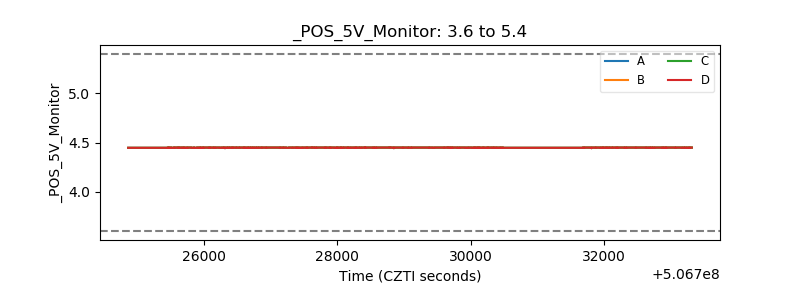 |
| _ROLL_ROT | 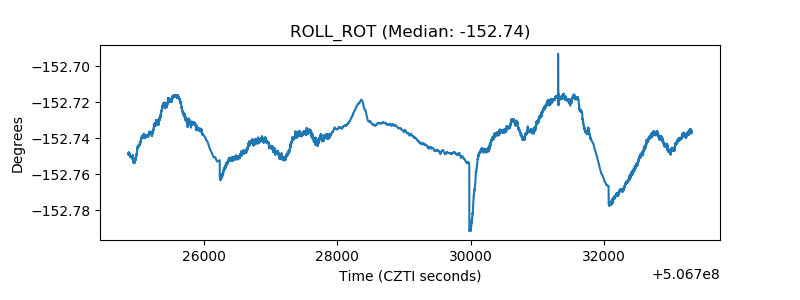 |
| _Roll_DEC | 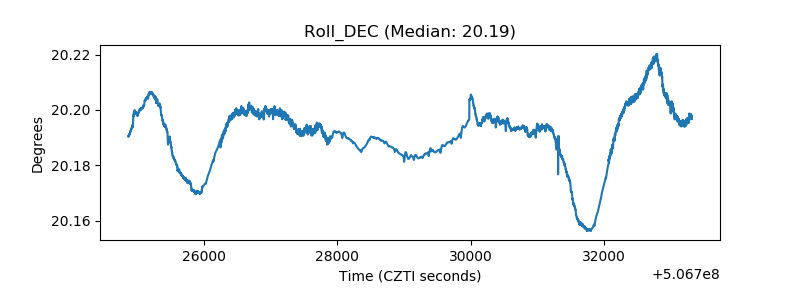 |
| _Roll_RA | 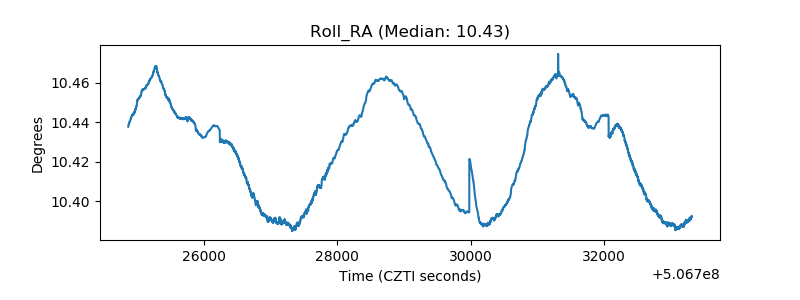 |
| Veto Counter | 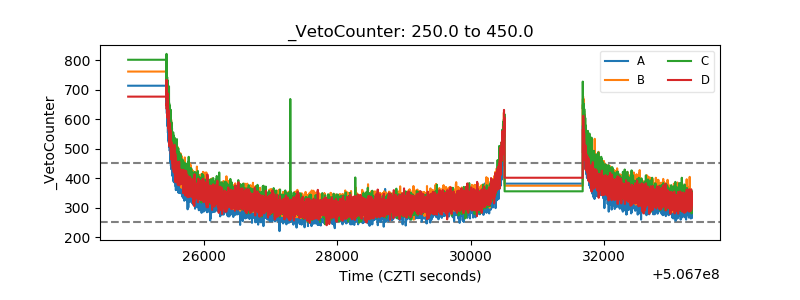 |