| Param | Original file | Final file |
|---|---|---|
| Filename | modeM0/AS1A14_127T10_9000006542_55825cztM0_level2.fits | modeM0/AS1A14_127T10_9000006542_55825cztM0_level2_quad_clean.evt |
| Size (bytes) | 408,412,800 | 96,655,680 |
| Size | 389.5 MB | 92.2 MB |
| Events in quadrant A | 4,621,421 | 614,451 |
| Events in quadrant B | 2,922,189 | 676,249 |
| Events in quadrant C | 3,150,198 | 607,390 |
| Events in quadrant D | 3,908,632 | 566,755 |
| Mode M0 | |||
|---|---|---|---|
| Quadrant | BADHDUFLAG | Total packets | Discarded packets |
| A | 0 | 18180 | 2 |
| B | 0 | 13857 | 2 |
| C | 0 | 14695 | 3 |
| D | 0 | 16552 | 2 |
| Mode M9 | |||
|---|---|---|---|
| Quadrant | BADHDUFLAG | Total packets | Discarded packets |
| A | 0 | 23 | 0 |
| B | 0 | 23 | 0 |
| C | 0 | 23 | 0 |
| D | 0 | 23 | 0 |
| Mode SS | |||
|---|---|---|---|
| Quadrant | BADHDUFLAG | Total packets | Discarded packets |
| A | 0 | 136 | 0 |
| B | 0 | 136 | 0 |
| C | 0 | 136 | 0 |
| D | 0 | 136 | 0 |
| Quadrant | Total seconds | Saturated seconds | Saturation percentage |
|---|---|---|---|
| A | 6629 | 156 | 2.353296% |
| B | 6629 | 66 | 0.995625% |
| C | 6629 | 72 | 1.086137% |
| D | 6629 | 117 | 1.764972% |
Noise dominated data is calculated using 1-second bins in cleaned event files. If a bin has >2000 counts, and if more than 50% of those come from <1% of pixels, then it is considered to be noise-dominated and hence unusable.
| Quadrant | # 1 sec bins | Bins with >0 counts | Bins with >2000 counts | High rate bins dominated by noise | Noise dominated (total time) | Noise dominated (detector-on time) | Marked lightcurve |
|---|---|---|---|---|---|---|---|
| A | 8964 | 6631 | 106 | 106 | 1.18% | 1.60% | 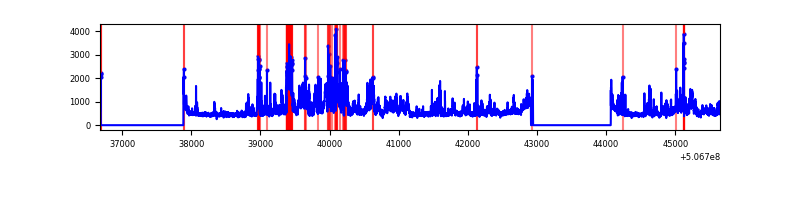 |
| B | 8964 | 6632 | 14 | 14 | 0.16% | 0.21% | 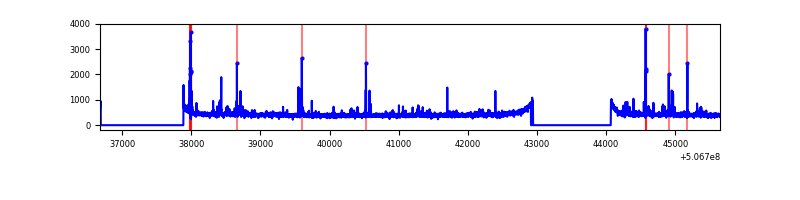 |
| C | 8964 | 6632 | 75 | 75 | 0.84% | 1.13% | 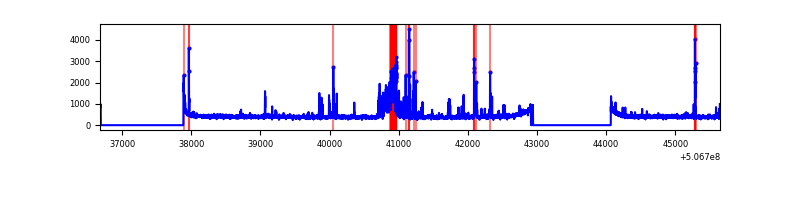 |
| D | 8964 | 6631 | 82 | 82 | 0.91% | 1.24% | 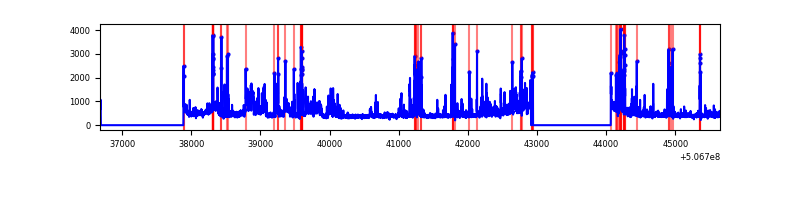 |
Top three noisy pixels from each quadrant. If the there are fewer than three noisy pixels in the level2.evt file, extra rows are filled as -1
| Pixel properties | Quadrant properties | ||||||
|---|---|---|---|---|---|---|---|
| Quadrant | DetID | PixID | Counts | Sigma | Mean | Median | Sigma |
| A | 12 | 115 | 1225525 | 7239.96 | 686 | 671 | 169.2 |
| A | 8 | 192 | 230216 | 1356.81 | 686 | 671 | 169.2 |
| A | 0 | 8 | 171841 | 1011.76 | 686 | 671 | 169.2 |
| B | 7 | 252 | 95988 | 631.0 | 689 | 663 | 151.1 |
| B | 0 | 213 | 68539 | 449.3 | 689 | 663 | 151.1 |
| B | 12 | 111 | 17956 | 114.47 | 689 | 663 | 151.1 |
| C | 9 | 38 | 166798 | 885.68 | 679 | 673 | 187.6 |
| C | 14 | 254 | 132334 | 701.94 | 679 | 673 | 187.6 |
| C | 12 | 250 | 118845 | 630.02 | 679 | 673 | 187.6 |
| D | 8 | 245 | 517793 | 2704.87 | 668 | 638 | 191.2 |
| D | 11 | 129 | 299334 | 1562.27 | 668 | 638 | 191.2 |
| D | 3 | 12 | 96255 | 500.1 | 668 | 638 | 191.2 |
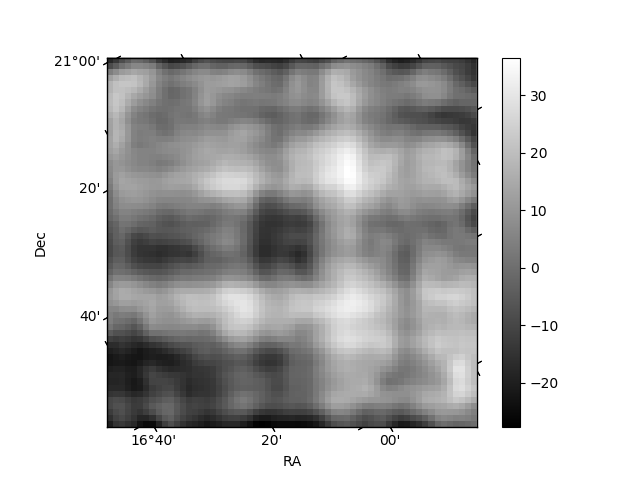
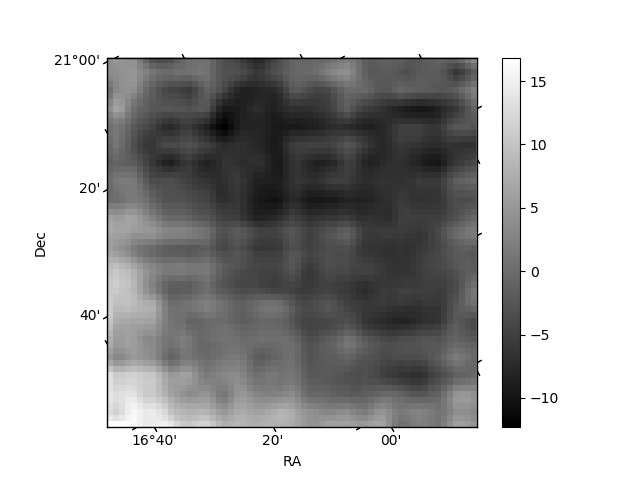
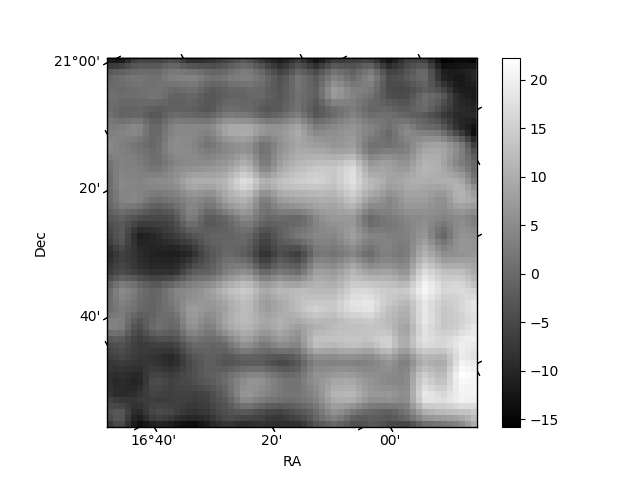
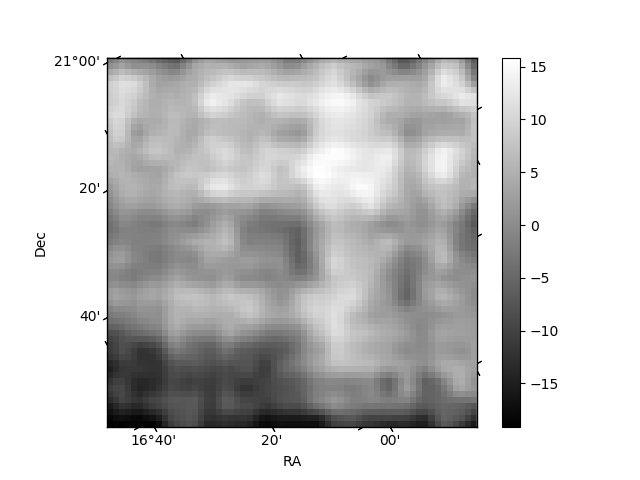
Histogram calculated using DETX and DETY for each event in the final _common_clean file
| Quadrant A | 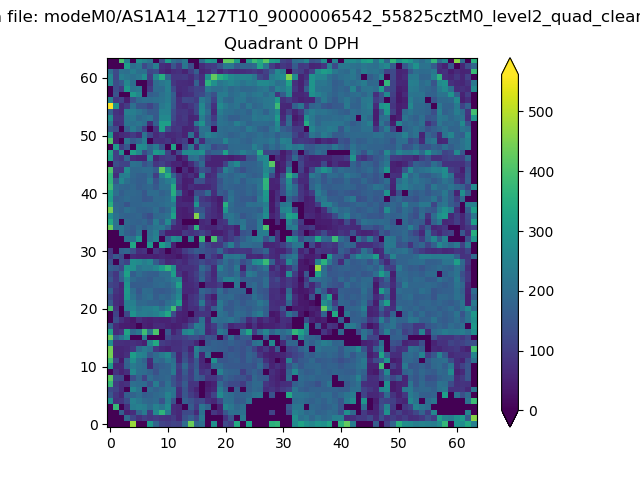 |
 |
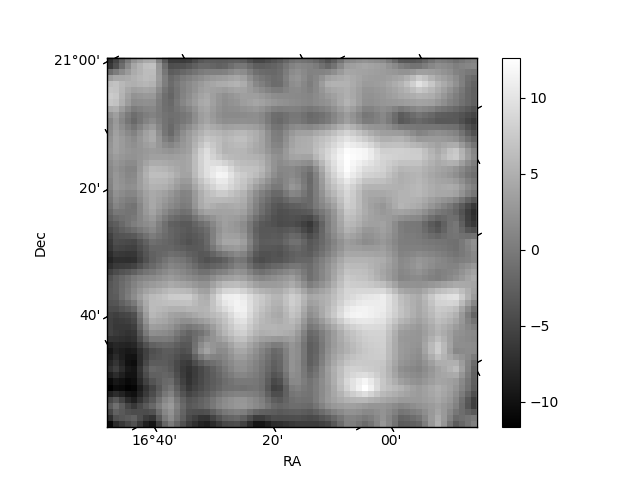
Quadrant B |
|---|---|---|---|
| Quadrant D | 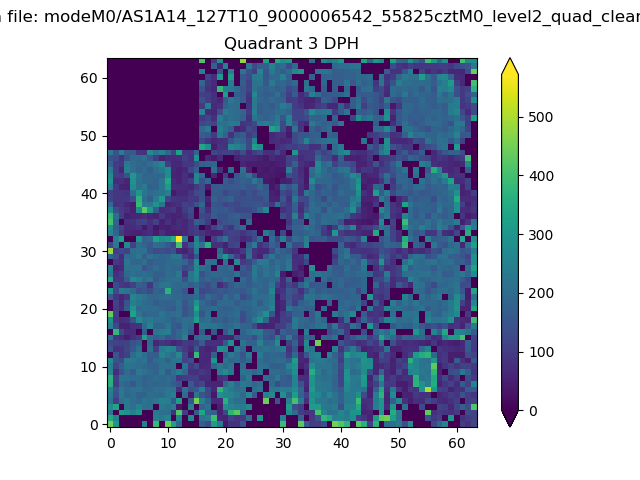 |
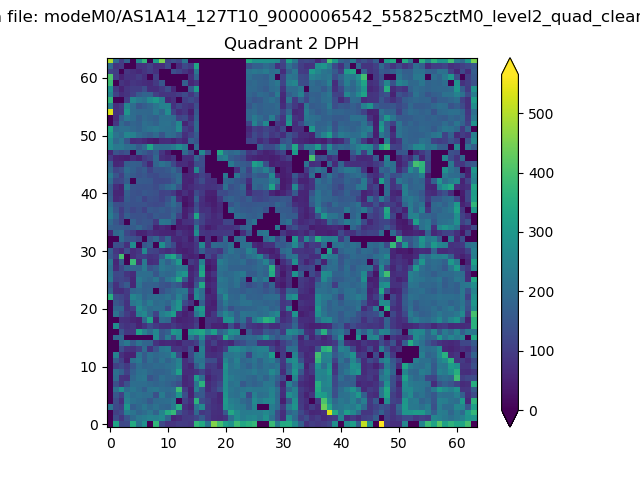 |
Quadrant C |
| Plot type | Count rate plots | Images |
|---|---|---|
| Comparison with Poisson distribution Blue bars denote a histogram of data divided into 1 sec bins. Red curve is a Poisson curve with rate = median count rate of data. |
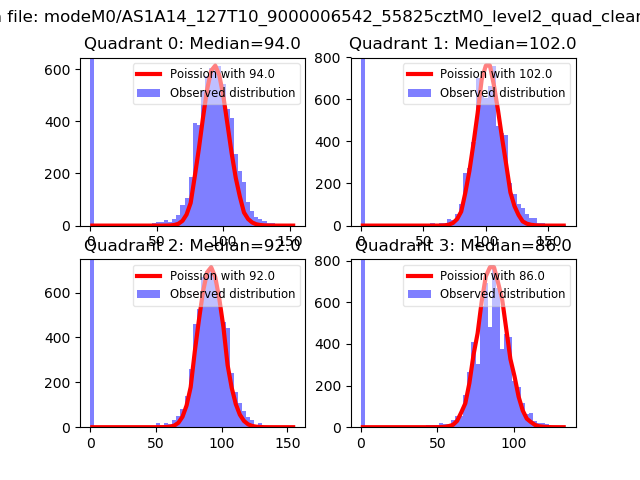 |
 |
| Quadrant-wise count rates Data is divided into 100 sec bins |
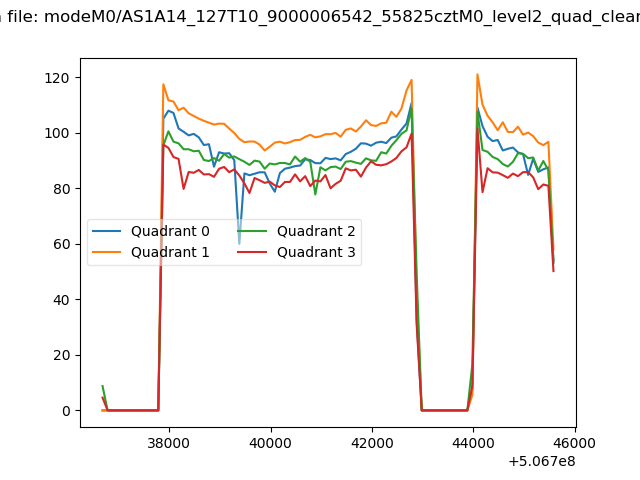 |
|
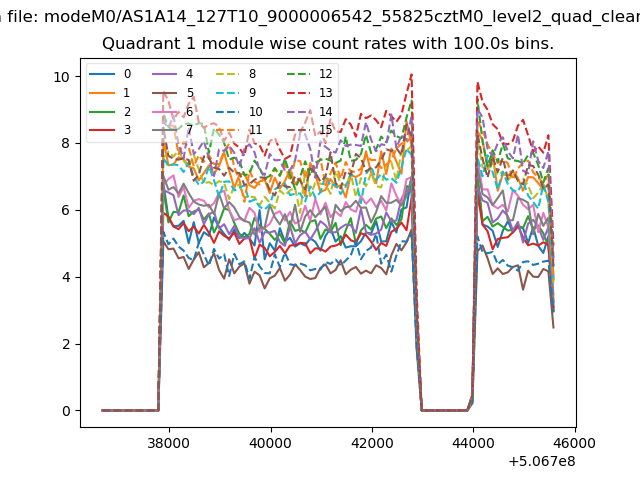
| Module-wise count rates for Quadrant A Data is divided into 100 sec bins |
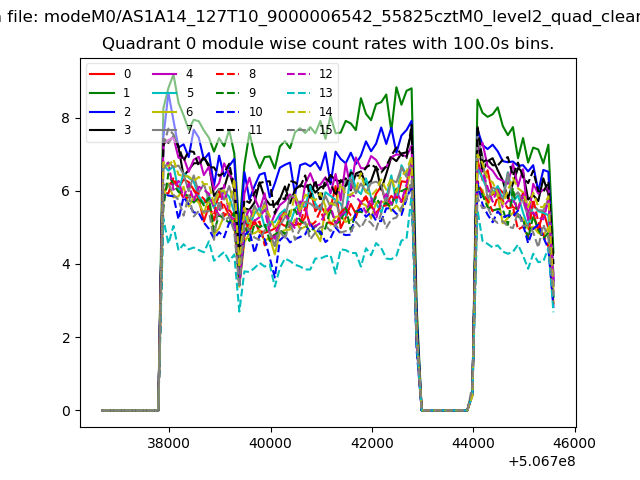 |
 |
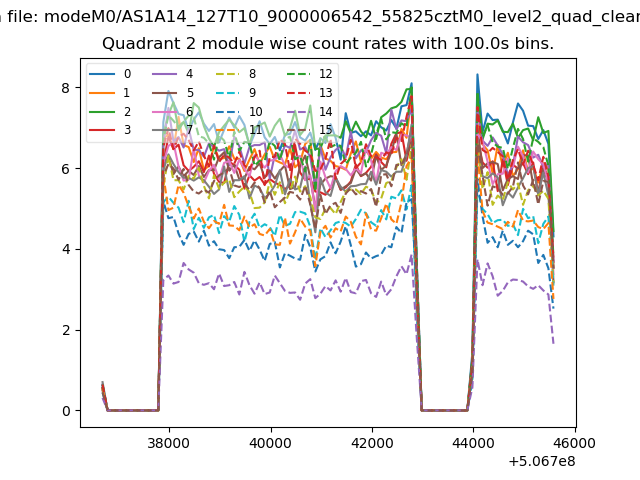
| Module-wise count rates for Quadrant B Data is divided into 100 sec bins |
 |
 |
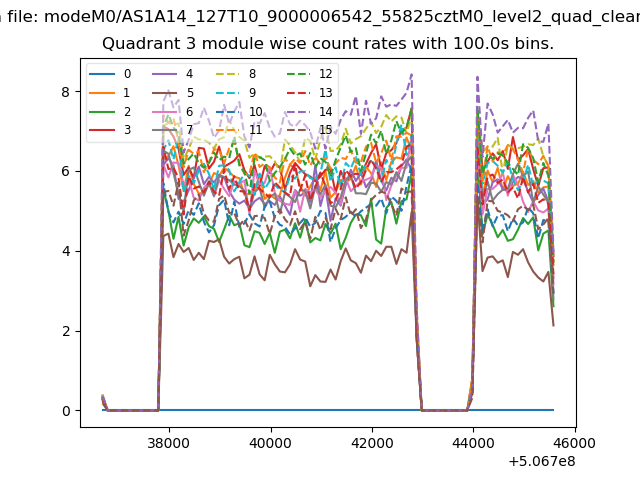
| Module-wise count rates for Quadrant C Data is divided into 100 sec bins |
 |
 |
| Module-wise count rates for Quadrant D Data is divided into 100 sec bins |
 |
 |
| Parameter | Plot |
|---|---|
| CZT HV Monitor | 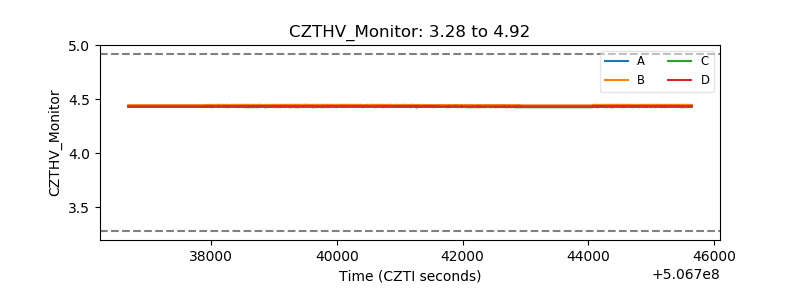 |
| D_VDD | 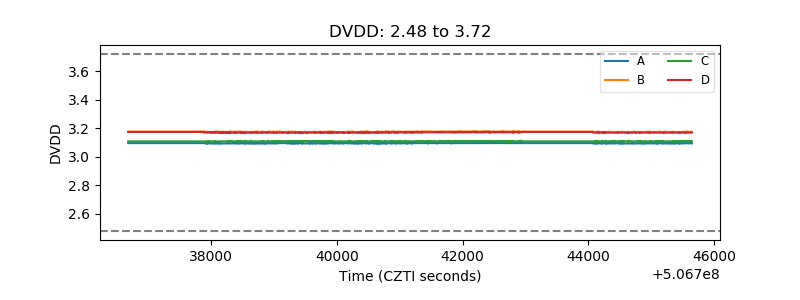 |
| Temperature 1 | 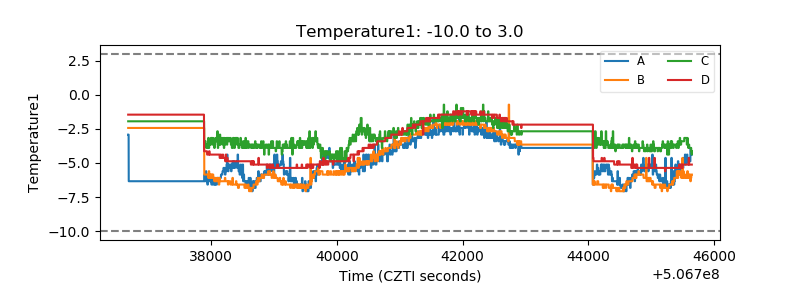 |
| Veto HV Monitor |  |
| Veto LLD | 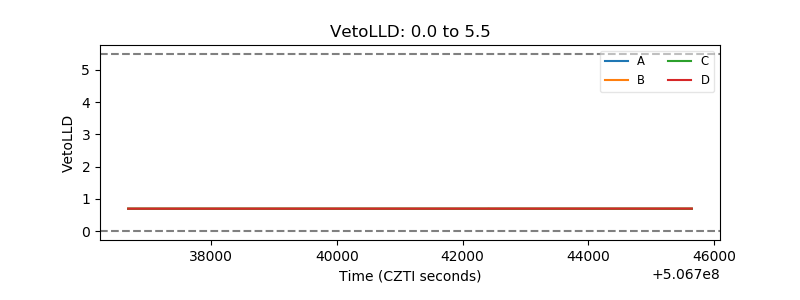 |
| Alpha Counter | 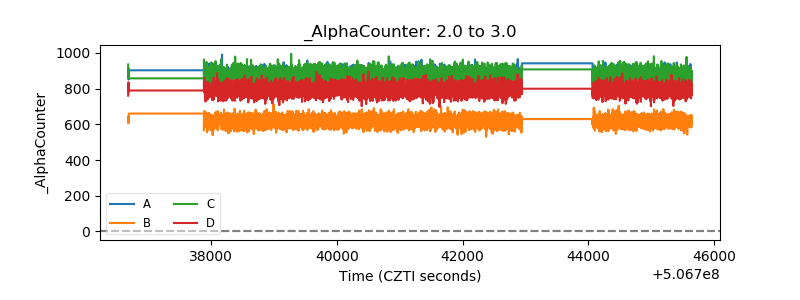 |
| _CPM_Rate | 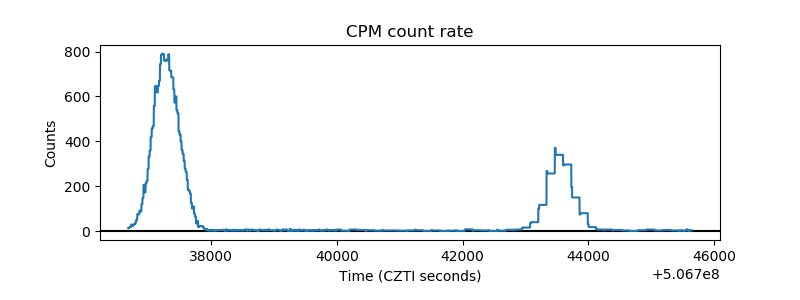 |
| CZT Counter | 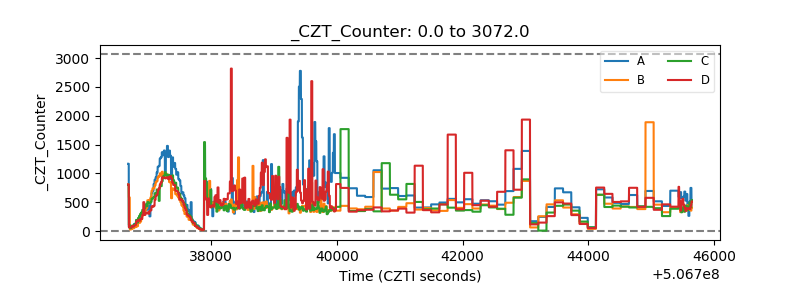 |
| +2.5 Volts monitor |  |
| +5 Volts monitor | 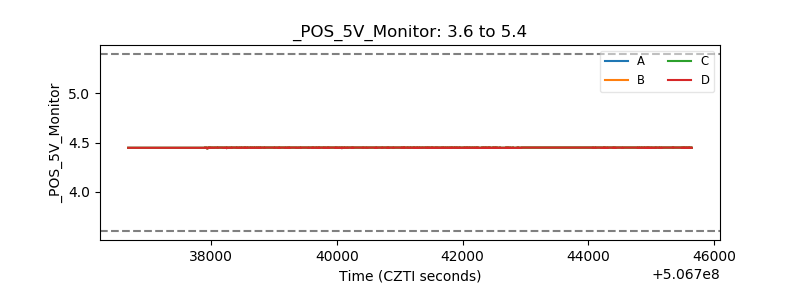 |
| _ROLL_ROT | 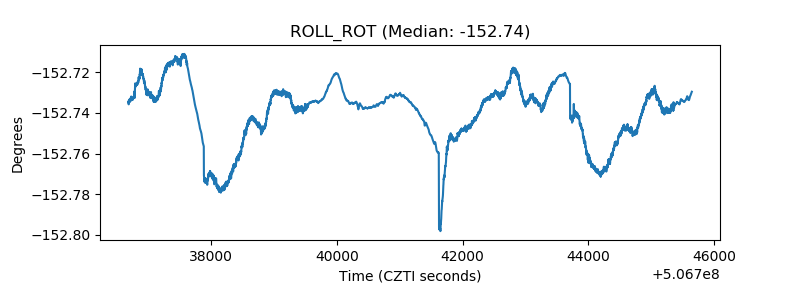 |
| _Roll_DEC | 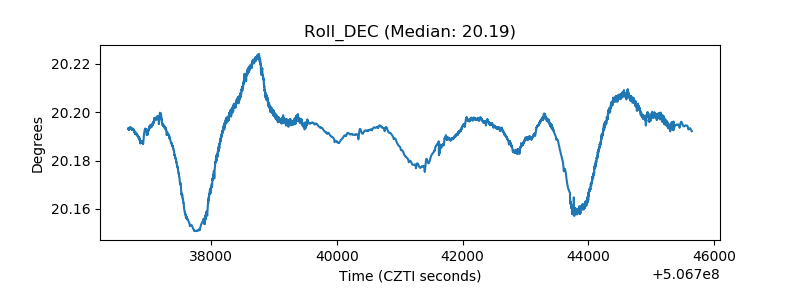 |
| _Roll_RA | 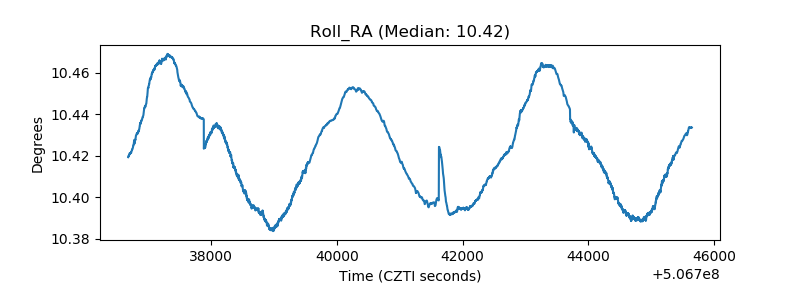 |
| Veto Counter | 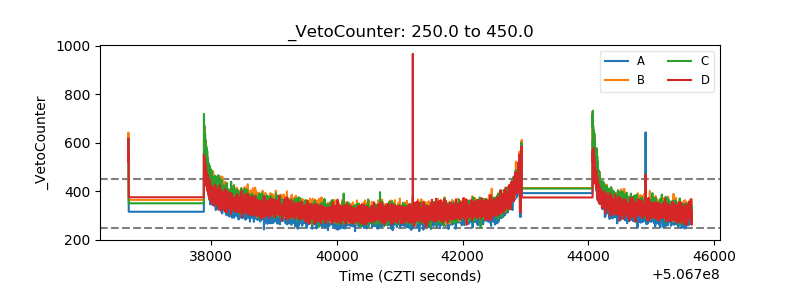 |