| Param | Original file | Final file |
|---|---|---|
| Filename | modeM0/AS1A14_127T10_9000006542_55826cztM0_level2.fits | modeM0/AS1A14_127T10_9000006542_55826cztM0_level2_quad_clean.evt |
| Size (bytes) | 444,006,720 | 99,576,000 |
| Size | 423.4 MB | 95.0 MB |
| Events in quadrant A | 5,559,870 | 611,295 |
| Events in quadrant B | 3,150,786 | 694,036 |
| Events in quadrant C | 3,048,803 | 637,053 |
| Events in quadrant D | 4,129,607 | 583,021 |
| Mode M0 | |||
|---|---|---|---|
| Quadrant | BADHDUFLAG | Total packets | Discarded packets |
| A | 0 | 21313 | 2 |
| B | 0 | 14843 | 2 |
| C | 0 | 14839 | 3 |
| D | 0 | 17581 | 2 |
| Mode M9 | |||
|---|---|---|---|
| Quadrant | BADHDUFLAG | Total packets | Discarded packets |
| A | 0 | 19 | 0 |
| B | 0 | 19 | 0 |
| C | 0 | 19 | 0 |
| D | 0 | 19 | 0 |
| Mode SS | |||
|---|---|---|---|
| Quadrant | BADHDUFLAG | Total packets | Discarded packets |
| A | 0 | 146 | 0 |
| B | 0 | 146 | 0 |
| C | 0 | 146 | 0 |
| D | 0 | 146 | 0 |
| Quadrant | Total seconds | Saturated seconds | Saturation percentage |
|---|---|---|---|
| A | 7026 | 580 | 8.255053% |
| B | 7027 | 178 | 2.533087% |
| C | 7026 | 78 | 1.110162% |
| D | 7026 | 283 | 4.027896% |
Noise dominated data is calculated using 1-second bins in cleaned event files. If a bin has >2000 counts, and if more than 50% of those come from <1% of pixels, then it is considered to be noise-dominated and hence unusable.
| Quadrant | # 1 sec bins | Bins with >0 counts | Bins with >2000 counts | High rate bins dominated by noise | Noise dominated (total time) | Noise dominated (detector-on time) | Marked lightcurve |
|---|---|---|---|---|---|---|---|
| A | 9012 | 7030 | 399 | 399 | 4.43% | 5.68% | 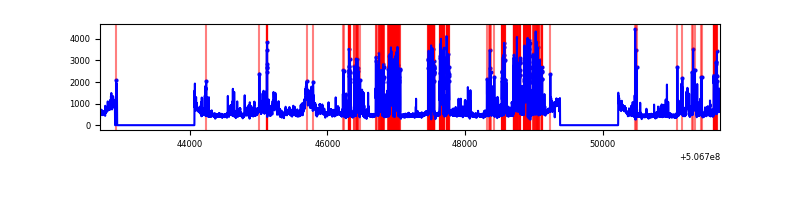 |
| B | 9013 | 7030 | 5 | 5 | 0.06% | 0.07% | 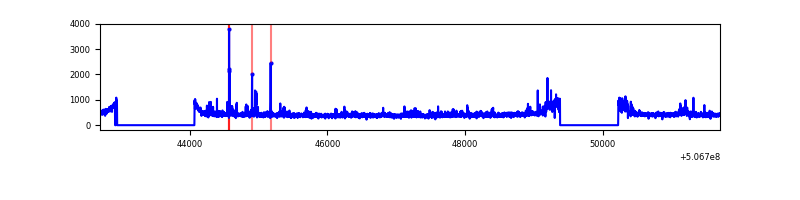 |
| C | 9012 | 7030 | 17 | 17 | 0.19% | 0.24% | 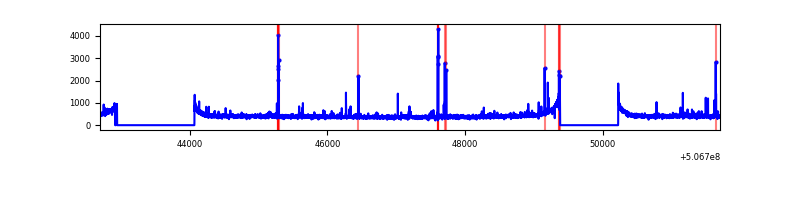 |
| D | 9012 | 7029 | 143 | 143 | 1.59% | 2.03% | 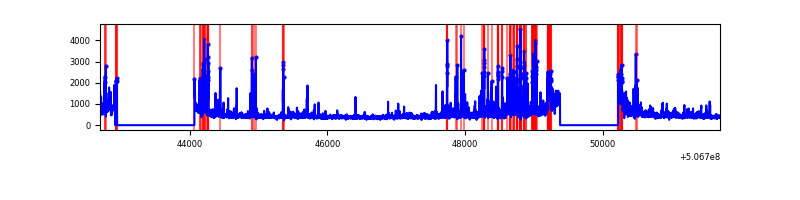 |
Top three noisy pixels from each quadrant. If the there are fewer than three noisy pixels in the level2.evt file, extra rows are filled as -1
| Pixel properties | Quadrant properties | ||||||
|---|---|---|---|---|---|---|---|
| Quadrant | DetID | PixID | Counts | Sigma | Mean | Median | Sigma |
| A | 0 | 8 | 875916 | 4797.12 | 737 | 717 | 182.4 |
| A | 12 | 115 | 583953 | 3196.82 | 737 | 717 | 182.4 |
| A | 4 | 249 | 487471 | 2667.99 | 737 | 717 | 182.4 |
| B | 0 | 213 | 109297 | 666.67 | 749 | 721 | 162.9 |
| B | 7 | 252 | 39329 | 237.06 | 749 | 721 | 162.9 |
| B | 12 | 111 | 19740 | 116.78 | 749 | 721 | 162.9 |
| C | 14 | 254 | 79821 | 388.12 | 741 | 735 | 203.8 |
| C | 6 | 223 | 22929 | 108.92 | 741 | 735 | 203.8 |
| C | 10 | 22 | 21890 | 103.82 | 741 | 735 | 203.8 |
| D | 11 | 129 | 615758 | 2989.04 | 726 | 696 | 205.8 |
| D | 7 | 96 | 339866 | 1648.28 | 726 | 696 | 205.8 |
| D | 2 | 62 | 65354 | 314.22 | 726 | 696 | 205.8 |
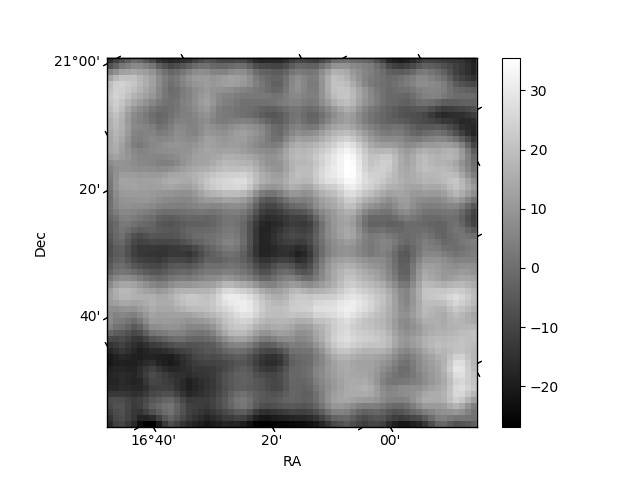
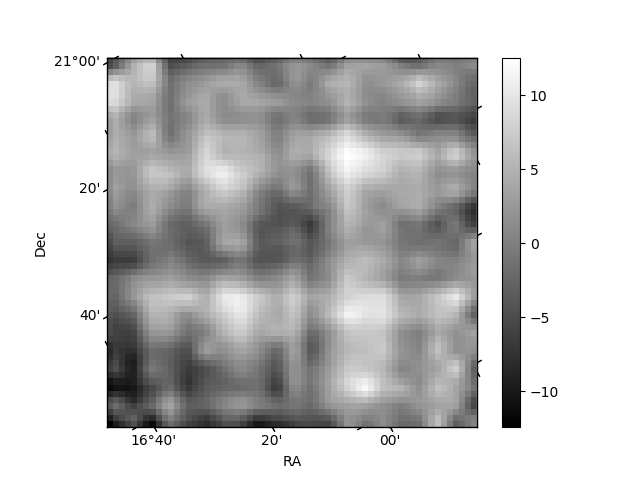
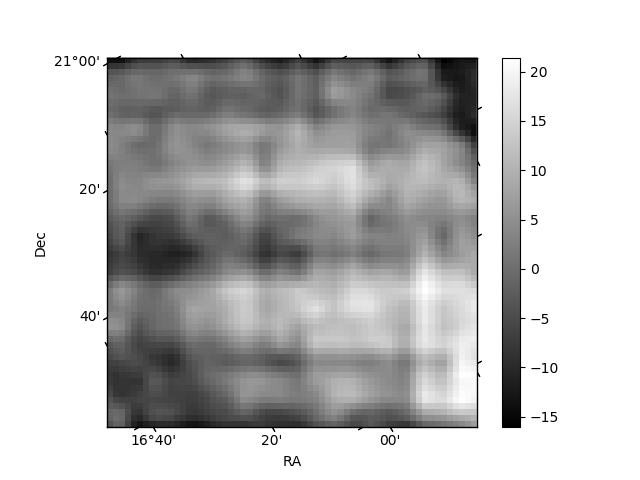
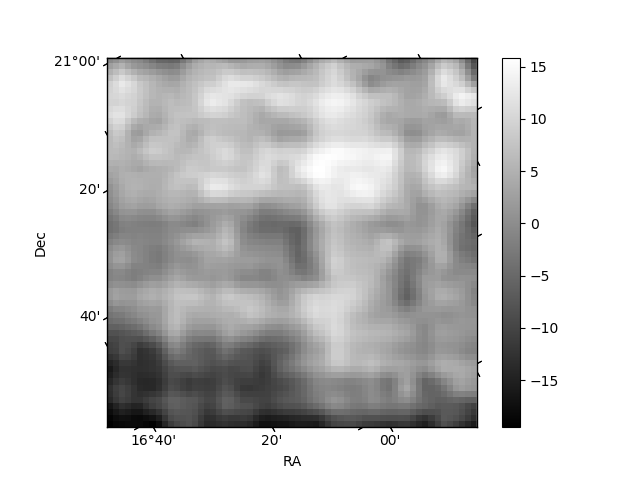
Histogram calculated using DETX and DETY for each event in the final _common_clean file
| Quadrant A | 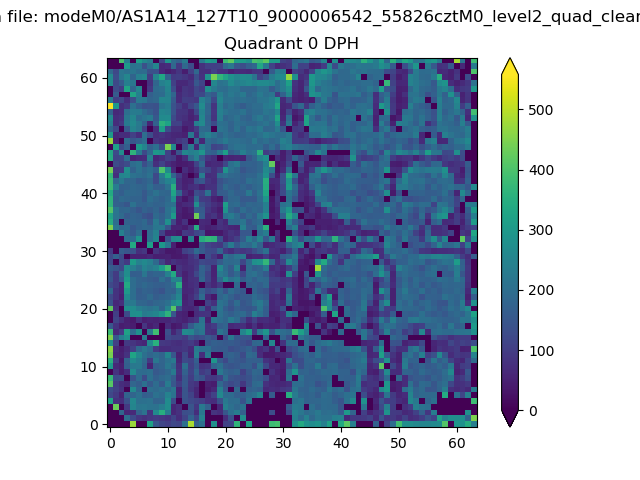 |
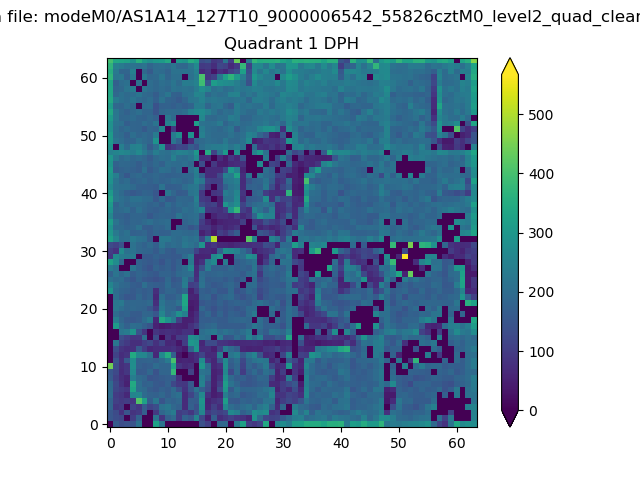 |
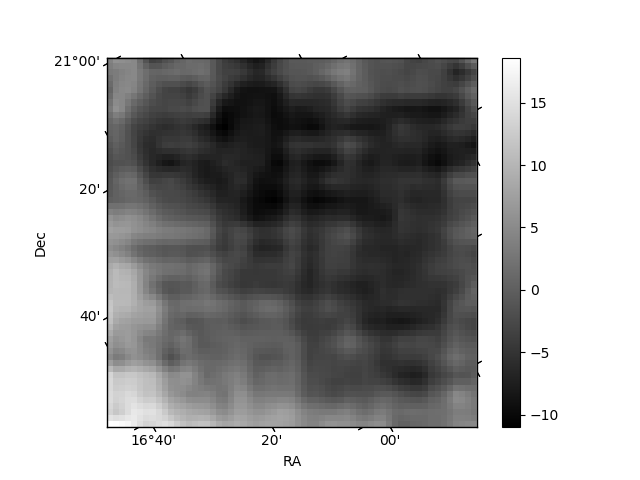
Quadrant B |
|---|---|---|---|
| Quadrant D | 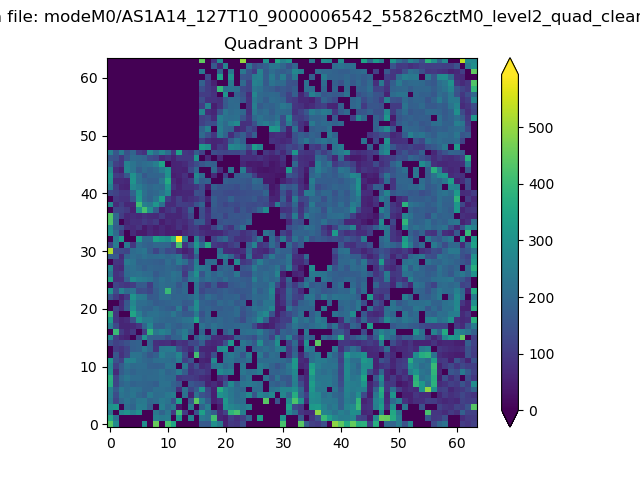 |
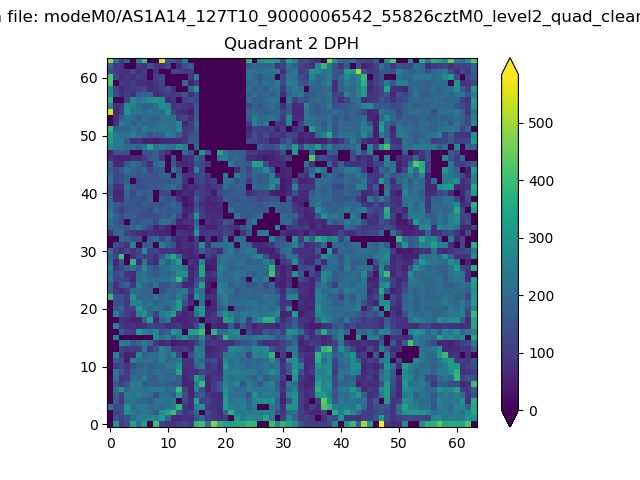 |
Quadrant C |
| Plot type | Count rate plots | Images |
|---|---|---|
| Comparison with Poisson distribution Blue bars denote a histogram of data divided into 1 sec bins. Red curve is a Poisson curve with rate = median count rate of data. |
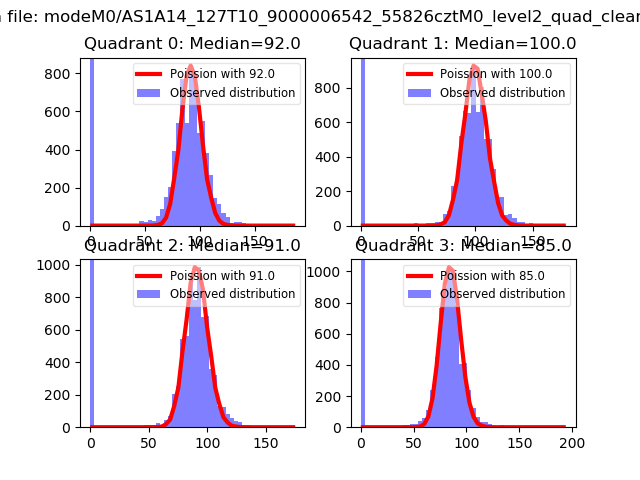 |
 |
| Quadrant-wise count rates Data is divided into 100 sec bins |
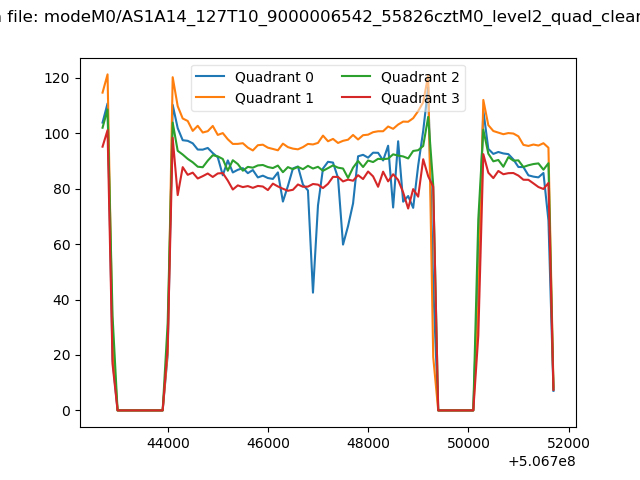 |
|
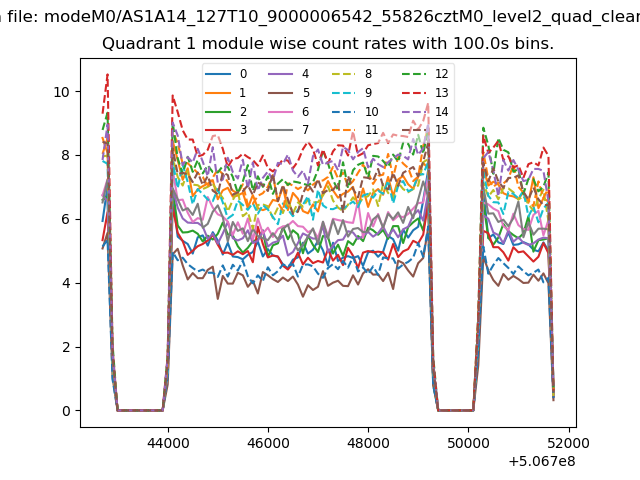
| Module-wise count rates for Quadrant A Data is divided into 100 sec bins |
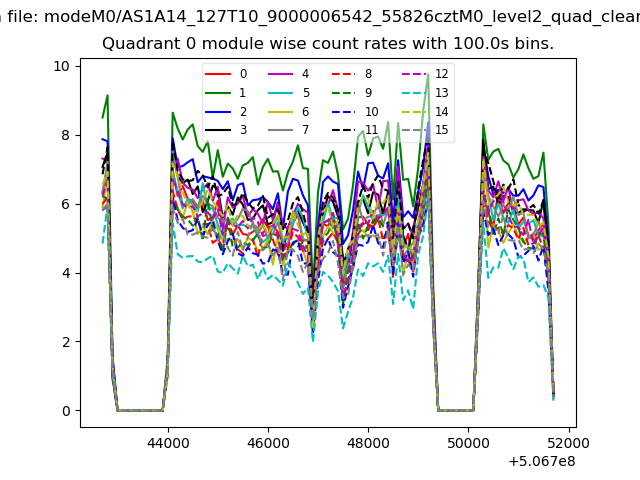 |
 |
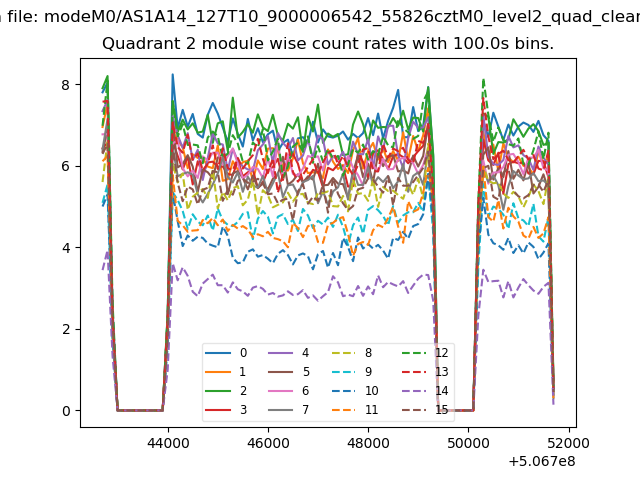
| Module-wise count rates for Quadrant B Data is divided into 100 sec bins |
 |
 |
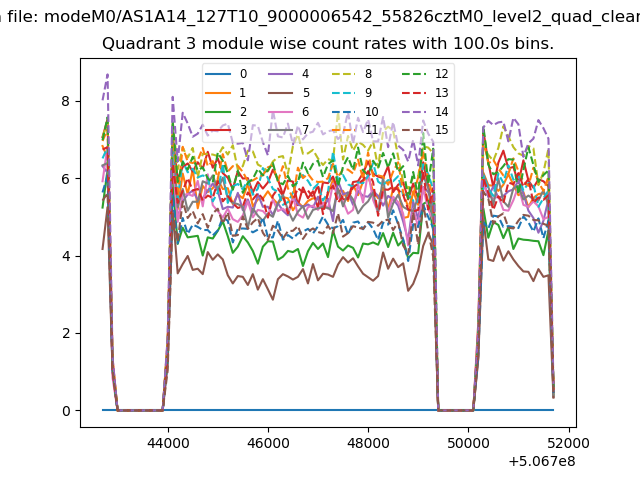
| Module-wise count rates for Quadrant C Data is divided into 100 sec bins |
 |
 |
| Module-wise count rates for Quadrant D Data is divided into 100 sec bins |
 |
 |
| Parameter | Plot |
|---|---|
| CZT HV Monitor | 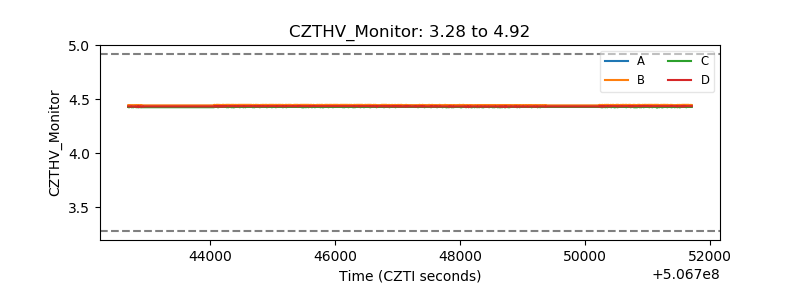 |
| D_VDD | 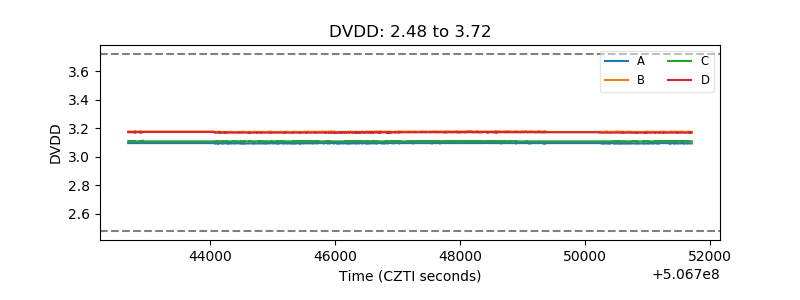 |
| Temperature 1 | 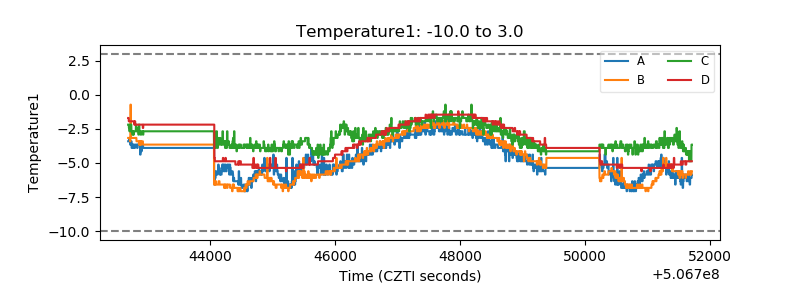 |
| Veto HV Monitor | 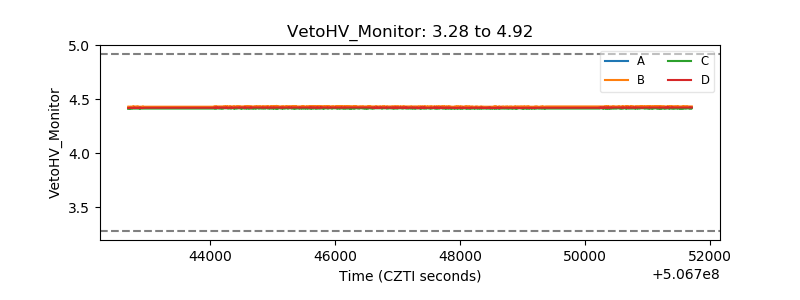 |
| Veto LLD | 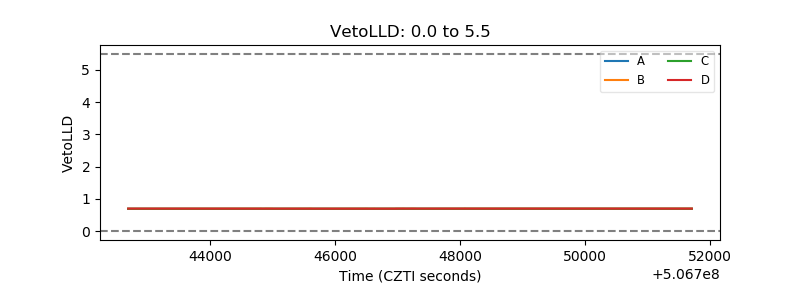 |
| Alpha Counter | 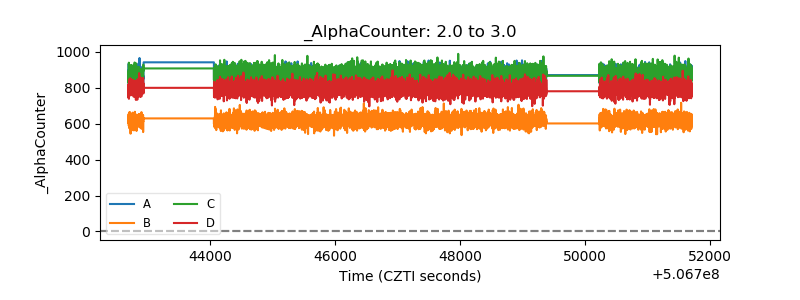 |
| _CPM_Rate | 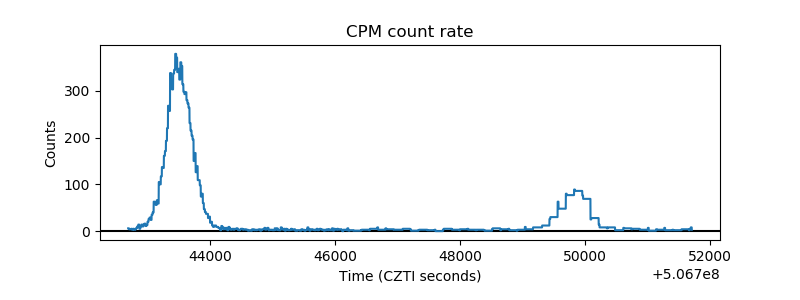 |
| CZT Counter | 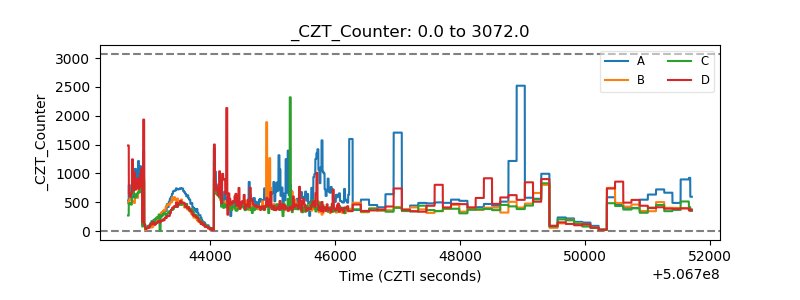 |
| +2.5 Volts monitor |  |
| +5 Volts monitor | 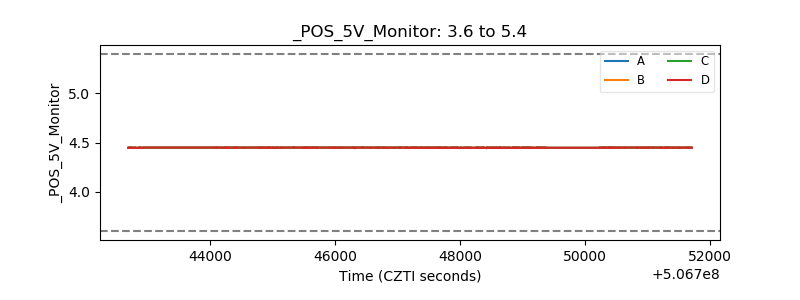 |
| _ROLL_ROT | 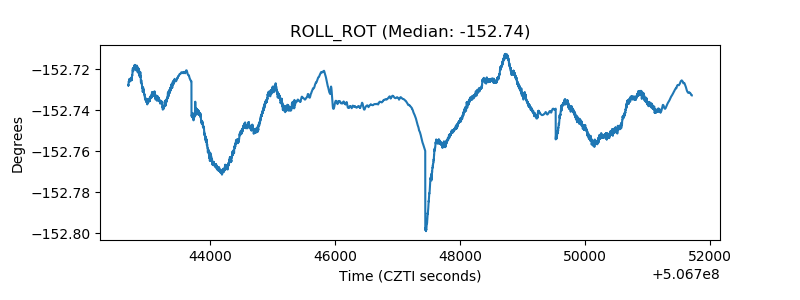 |
| _Roll_DEC | 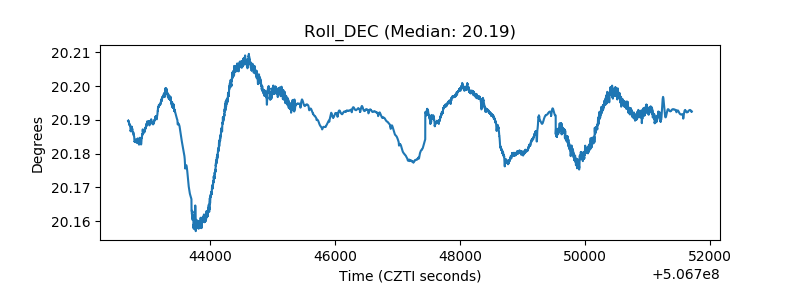 |
| _Roll_RA | 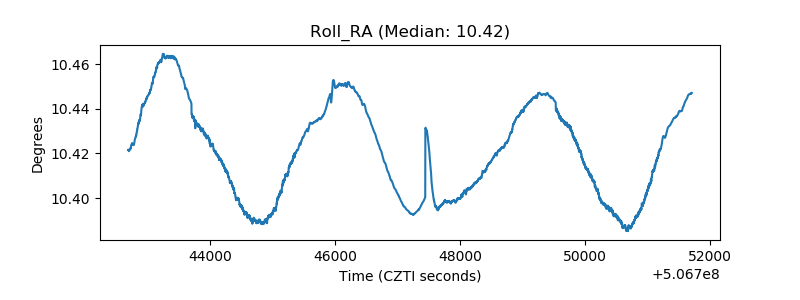 |
| Veto Counter | 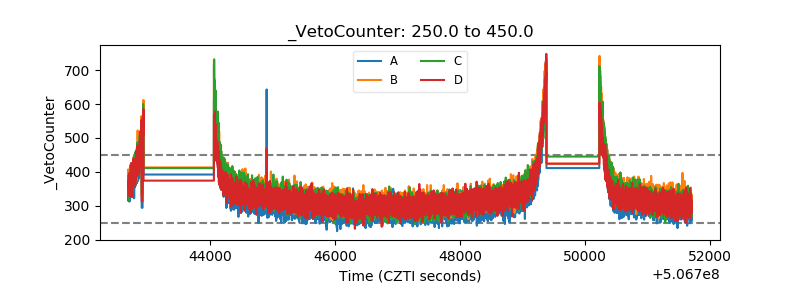 |