| Param | Original file | Final file |
|---|---|---|
| Filename | modeM0/AS1A14_127T10_9000006542_55827cztM0_level2.fits | modeM0/AS1A14_127T10_9000006542_55827cztM0_level2_quad_clean.evt |
| Size (bytes) | 522,483,840 | 111,335,040 |
| Size | 498.3 MB | 106.2 MB |
| Events in quadrant A | 6,633,642 | 672,089 |
| Events in quadrant B | 3,570,354 | 770,310 |
| Events in quadrant C | 3,477,442 | 714,029 |
| Events in quadrant D | 5,041,696 | 662,951 |
| Mode M0 | |||
|---|---|---|---|
| Quadrant | BADHDUFLAG | Total packets | Discarded packets |
| A | 0 | 25268 | 3 |
| B | 0 | 16857 | 3 |
| C | 0 | 16808 | 3 |
| D | 0 | 20705 | 3 |
| Mode M9 | |||
|---|---|---|---|
| Quadrant | BADHDUFLAG | Total packets | Discarded packets |
| A | 0 | 12 | 0 |
| B | 0 | 12 | 0 |
| C | 0 | 12 | 0 |
| D | 0 | 12 | 0 |
| Mode SS | |||
|---|---|---|---|
| Quadrant | BADHDUFLAG | Total packets | Discarded packets |
| A | 0 | 164 | 0 |
| B | 0 | 164 | 0 |
| C | 0 | 164 | 0 |
| D | 0 | 164 | 0 |
| Quadrant | Total seconds | Saturated seconds | Saturation percentage |
|---|---|---|---|
| A | 7940 | 888 | 11.183879% |
| B | 7940 | 350 | 4.408060% |
| C | 7941 | 169 | 2.128195% |
| D | 7941 | 354 | 4.457877% |
Noise dominated data is calculated using 1-second bins in cleaned event files. If a bin has >2000 counts, and if more than 50% of those come from <1% of pixels, then it is considered to be noise-dominated and hence unusable.
| Quadrant | # 1 sec bins | Bins with >0 counts | Bins with >2000 counts | High rate bins dominated by noise | Noise dominated (total time) | Noise dominated (detector-on time) | Marked lightcurve |
|---|---|---|---|---|---|---|---|
| A | 9111 | 7943 | 592 | 592 | 6.50% | 7.45% | 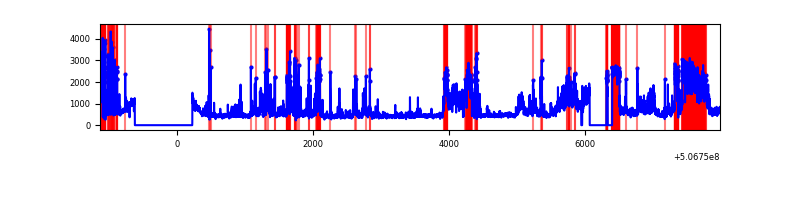 |
| B | 9111 | 7943 | 2 | 2 | 0.02% | 0.03% | 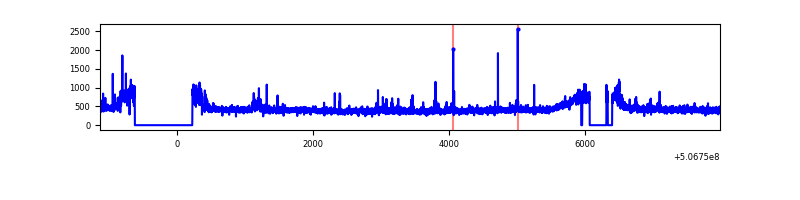 |
| C | 9112 | 7946 | 11 | 11 | 0.12% | 0.14% | 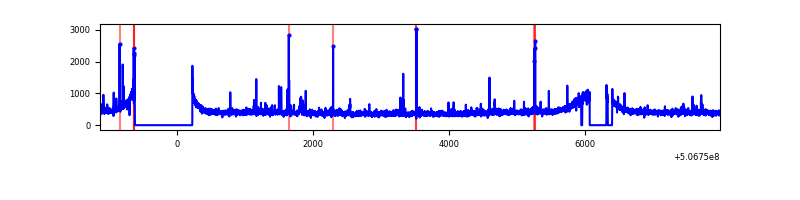 |
| D | 9112 | 7946 | 158 | 158 | 1.73% | 1.99% | 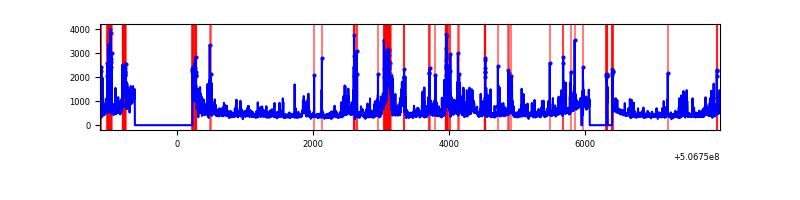 |
Top three noisy pixels from each quadrant. If the there are fewer than three noisy pixels in the level2.evt file, extra rows are filled as -1
| Pixel properties | Quadrant properties | ||||||
|---|---|---|---|---|---|---|---|
| Quadrant | DetID | PixID | Counts | Sigma | Mean | Median | Sigma |
| A | 12 | 115 | 2186937 | 10626.39 | 834 | 811 | 205.7 |
| A | 4 | 249 | 385796 | 1871.35 | 834 | 811 | 205.7 |
| A | 8 | 192 | 239256 | 1159.04 | 834 | 811 | 205.7 |
| B | 0 | 213 | 101355 | 539.25 | 858 | 825 | 186.4 |
| B | 0 | 171 | 26600 | 138.26 | 858 | 825 | 186.4 |
| B | 12 | 111 | 22706 | 117.37 | 858 | 825 | 186.4 |
| C | 14 | 254 | 57101 | 239.37 | 854 | 848 | 235.0 |
| C | 6 | 223 | 34917 | 144.97 | 854 | 848 | 235.0 |
| C | 7 | 220 | 13722 | 54.78 | 854 | 848 | 235.0 |
| D | 11 | 129 | 974487 | 4111.54 | 841 | 804 | 236.8 |
| D | 7 | 96 | 316047 | 1331.17 | 841 | 804 | 236.8 |
| D | 3 | 12 | 124746 | 523.37 | 841 | 804 | 236.8 |
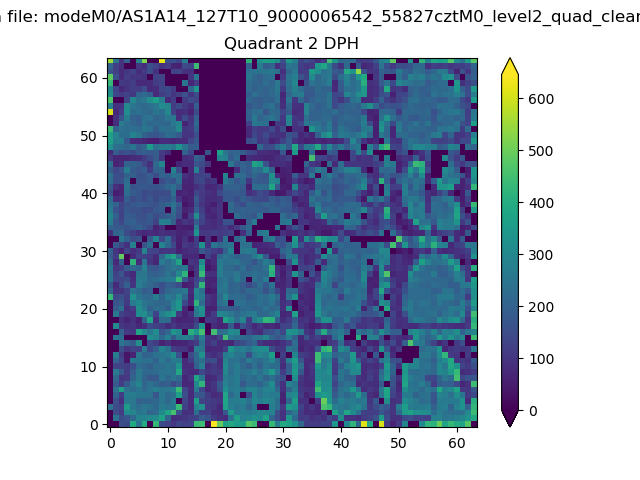
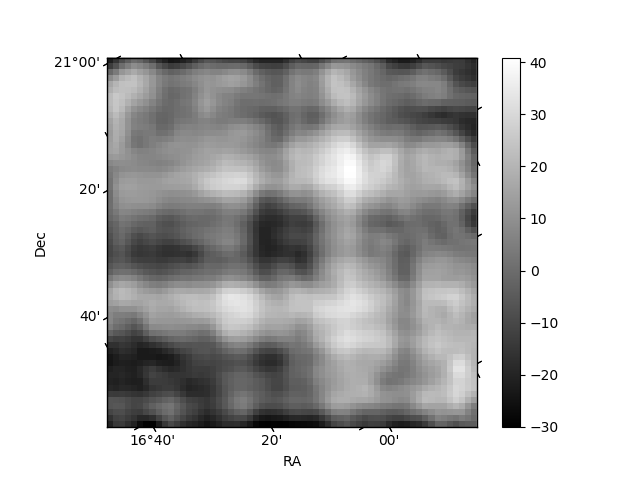
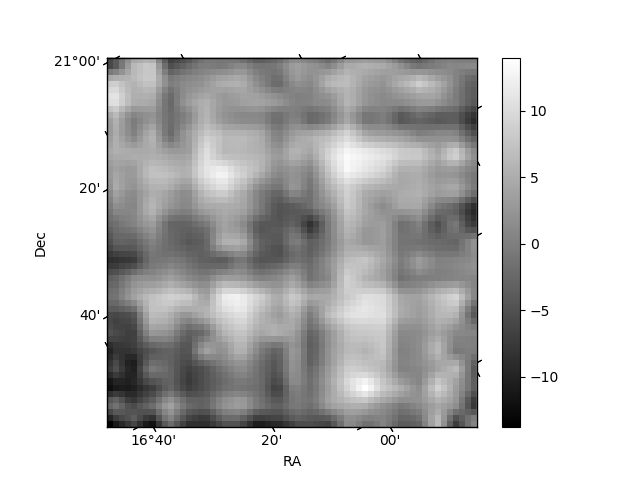
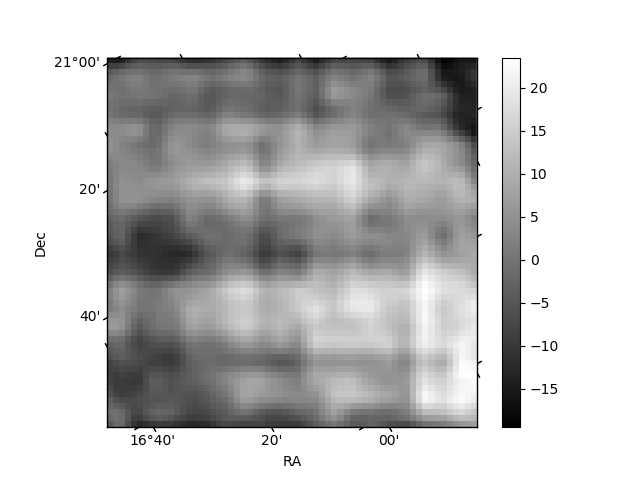
Histogram calculated using DETX and DETY for each event in the final _common_clean file
| Quadrant A | 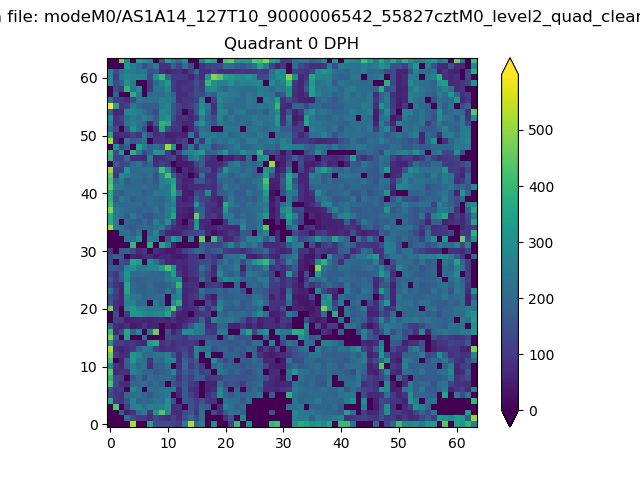 |
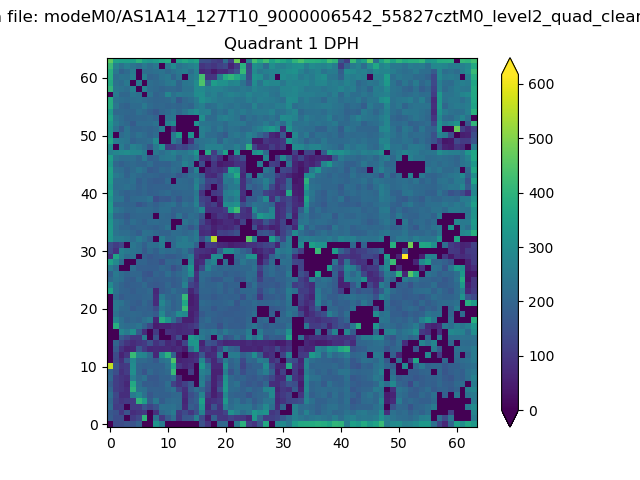 |
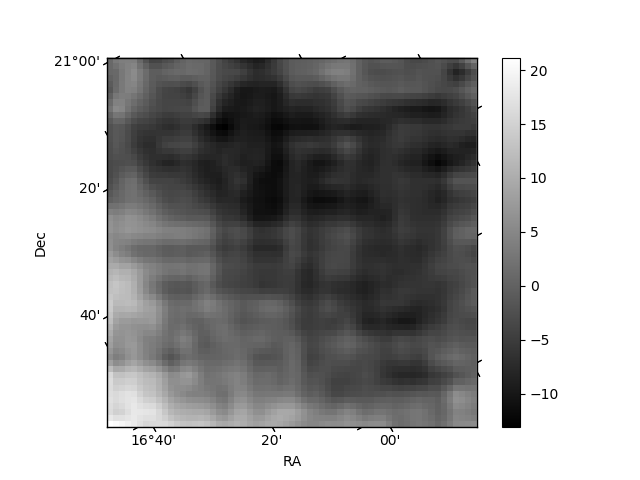
Quadrant B |
|---|---|---|---|
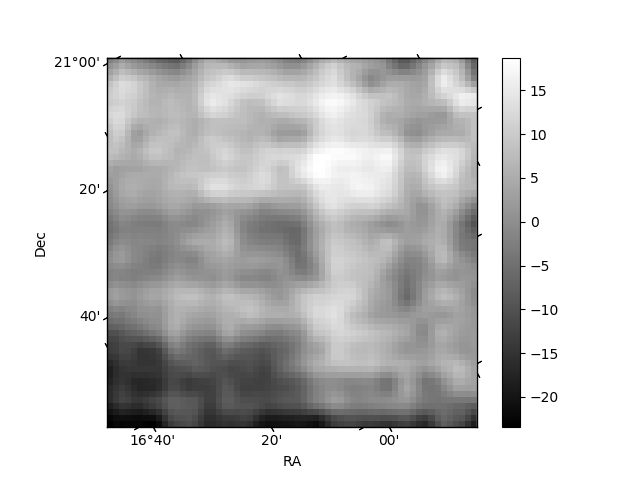
| Quadrant D | 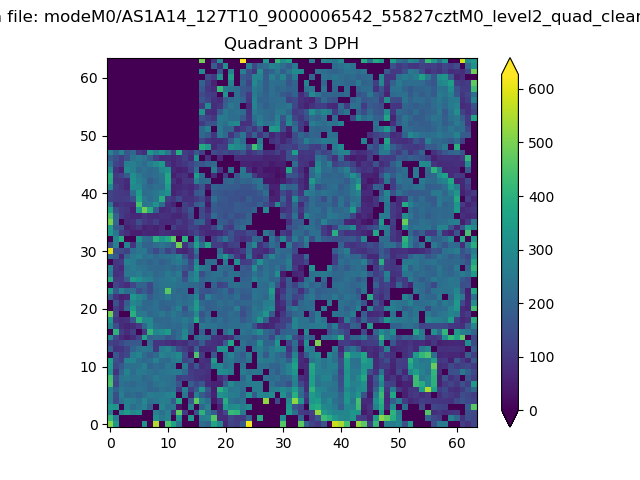 |
 |
Quadrant C |
| Plot type | Count rate plots | Images |
|---|---|---|
| Comparison with Poisson distribution Blue bars denote a histogram of data divided into 1 sec bins. Red curve is a Poisson curve with rate = median count rate of data. |
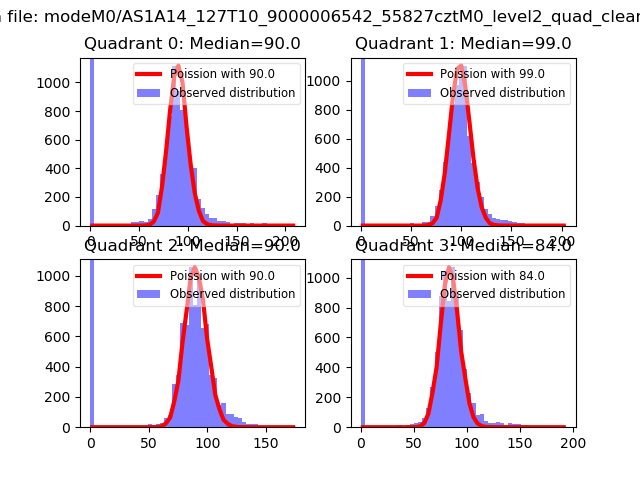 |
 |
| Quadrant-wise count rates Data is divided into 100 sec bins |
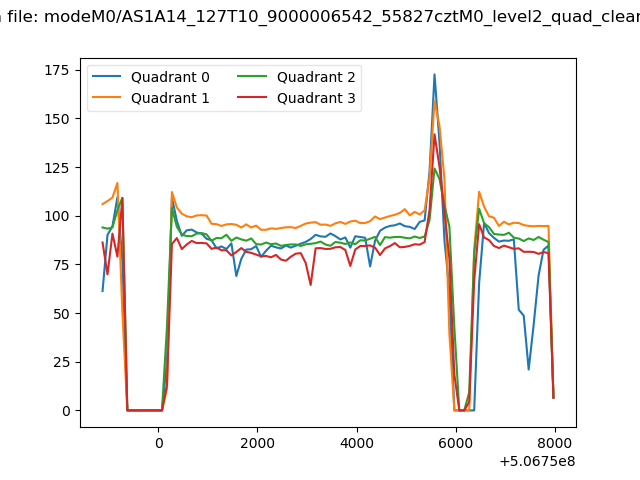 |
|
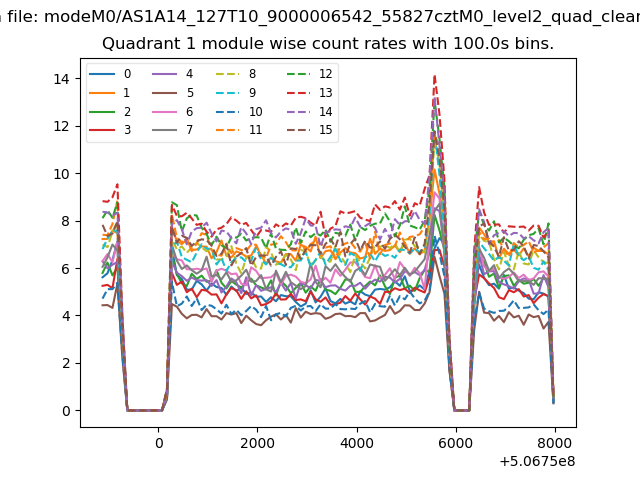
| Module-wise count rates for Quadrant A Data is divided into 100 sec bins |
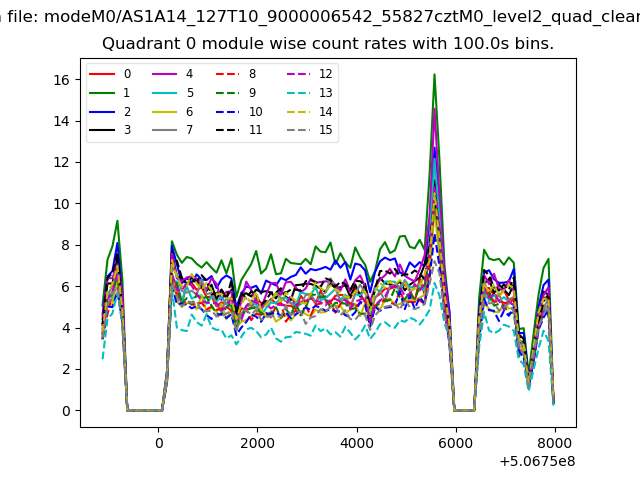 |
 |
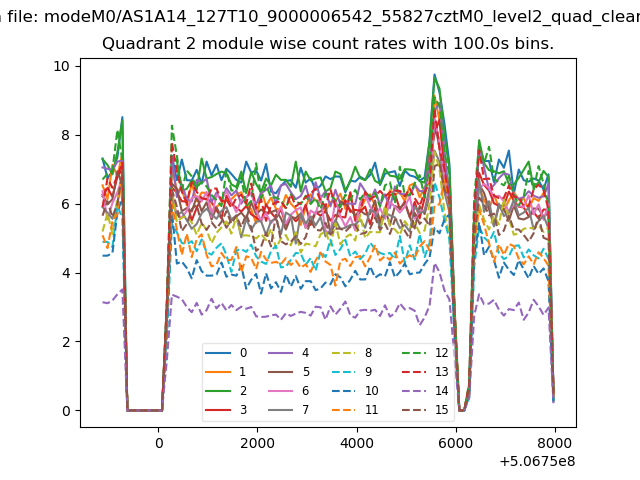
| Module-wise count rates for Quadrant B Data is divided into 100 sec bins |
 |
 |
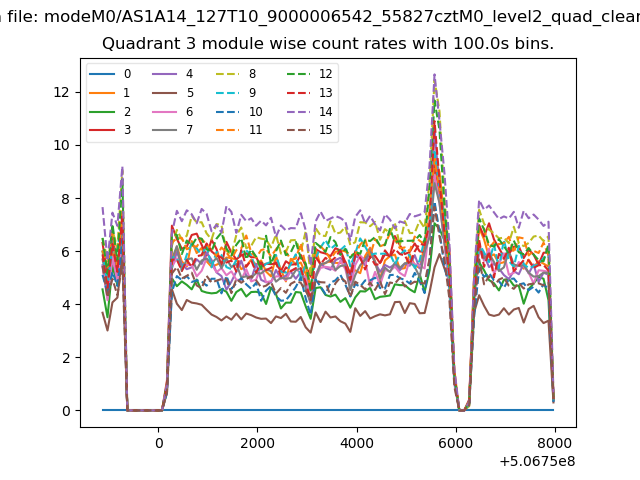
| Module-wise count rates for Quadrant C Data is divided into 100 sec bins |
 |
 |
| Module-wise count rates for Quadrant D Data is divided into 100 sec bins |
 |
 |
| Parameter | Plot |
|---|---|
| CZT HV Monitor | 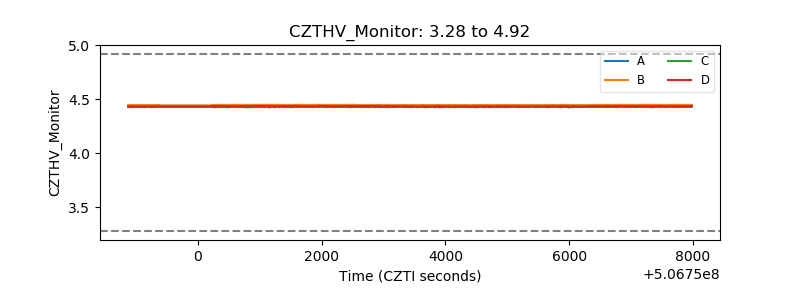 |
| D_VDD | 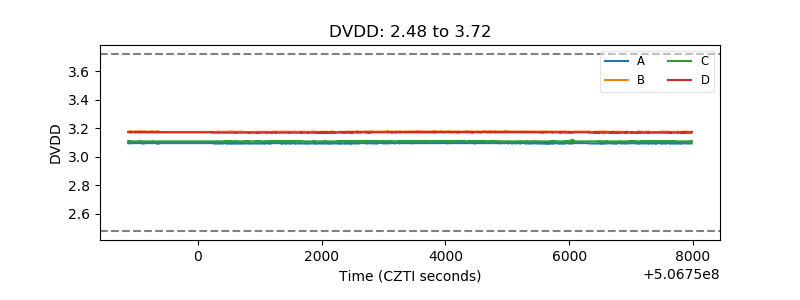 |
| Temperature 1 | 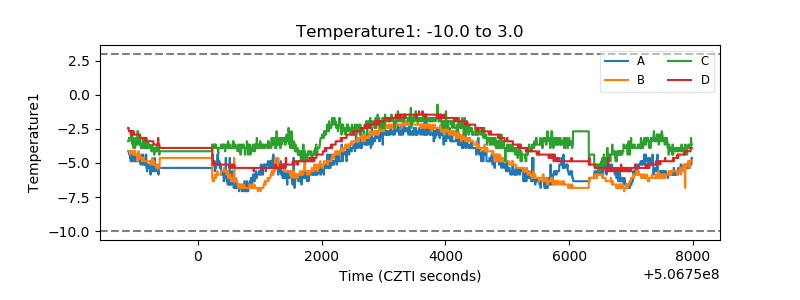 |
| Veto HV Monitor | 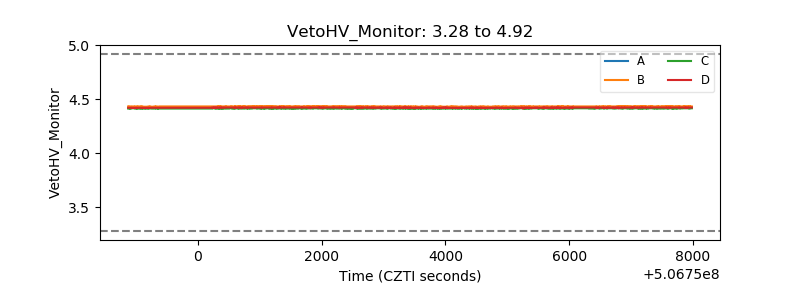 |
| Veto LLD | 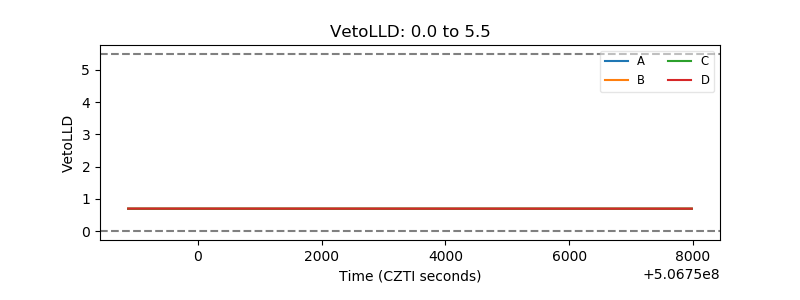 |
| Alpha Counter | 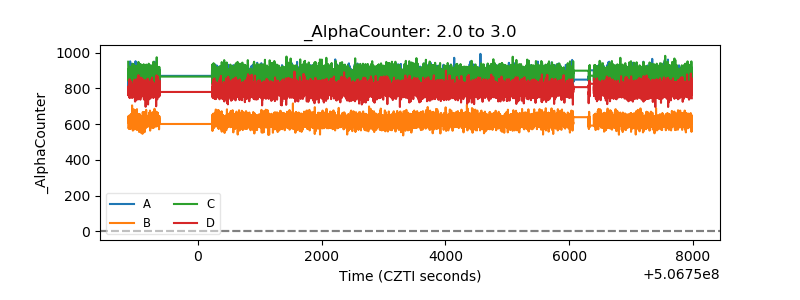 |
| _CPM_Rate | 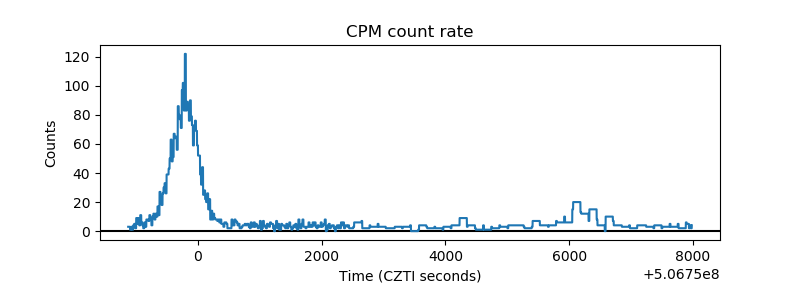 |
| CZT Counter | 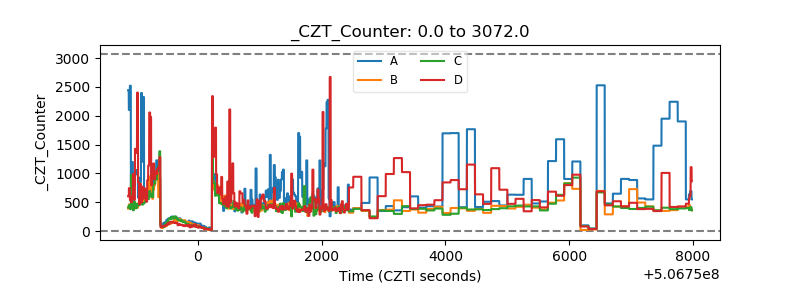 |
| +2.5 Volts monitor |  |
| +5 Volts monitor |  |
| _ROLL_ROT | 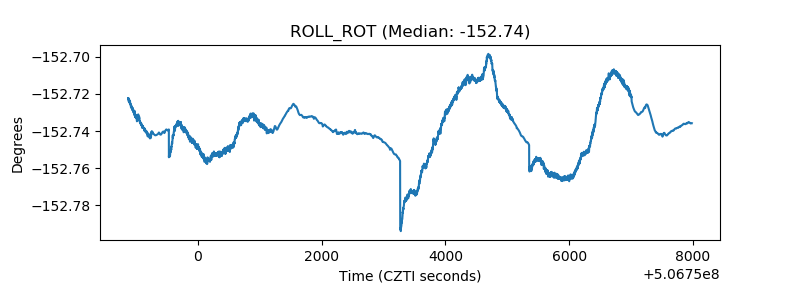 |
| _Roll_DEC | 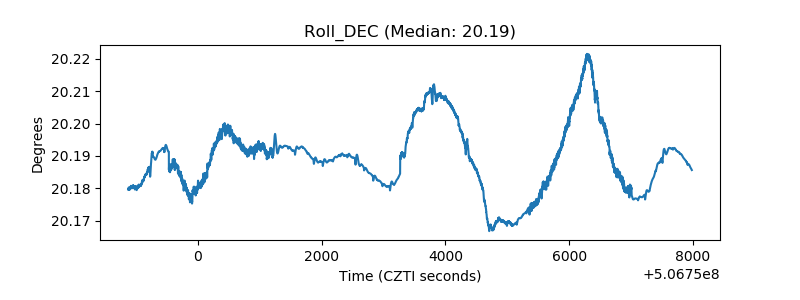 |
| _Roll_RA | 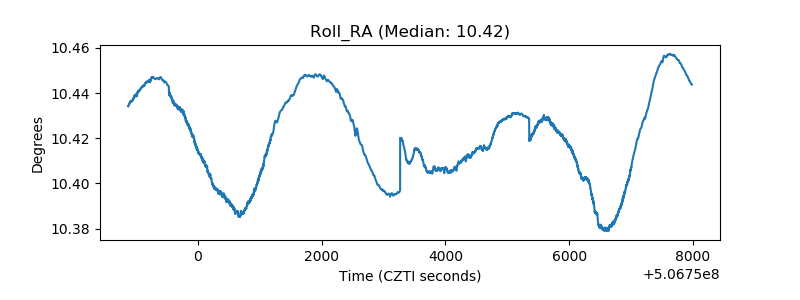 |
| Veto Counter | 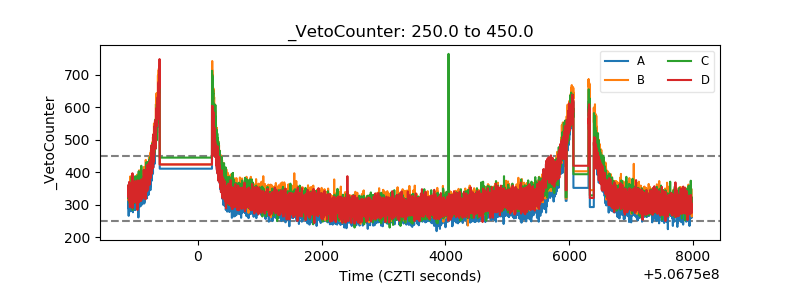 |