| Param | Original file | Final file |
|---|---|---|
| Filename | modeM0/AS1A14_127T10_9000006542_55828cztM0_level2.fits | modeM0/AS1A14_127T10_9000006542_55828cztM0_level2_quad_clean.evt |
| Size (bytes) | 567,745,920 | 99,797,760 |
| Size | 541.4 MB | 95.2 MB |
| Events in quadrant A | 8,693,629 | 534,942 |
| Events in quadrant B | 3,055,574 | 732,284 |
| Events in quadrant C | 3,023,651 | 661,293 |
| Events in quadrant D | 5,665,285 | 575,365 |
| Mode M0 | |||
|---|---|---|---|
| Quadrant | BADHDUFLAG | Total packets | Discarded packets |
| A | 0 | 30946 | 0 |
| B | 0 | 15031 | 0 |
| C | 0 | 15106 | 0 |
| D | 0 | 22345 | 1 |
| Mode SS | |||
|---|---|---|---|
| Quadrant | BADHDUFLAG | Total packets | Discarded packets |
| A | 0 | 150 | 0 |
| B | 0 | 150 | 0 |
| C | 0 | 150 | 0 |
| D | 0 | 150 | 0 |
| Quadrant | Total seconds | Saturated seconds | Saturation percentage |
|---|---|---|---|
| A | 7437 | 1603 | 21.554390% |
| B | 7438 | 9 | 0.121000% |
| C | 7438 | 7 | 0.094111% |
| D | 7437 | 660 | 8.874546% |
Noise dominated data is calculated using 1-second bins in cleaned event files. If a bin has >2000 counts, and if more than 50% of those come from <1% of pixels, then it is considered to be noise-dominated and hence unusable.
| Quadrant | # 1 sec bins | Bins with >0 counts | Bins with >2000 counts | High rate bins dominated by noise | Noise dominated (total time) | Noise dominated (detector-on time) | Marked lightcurve |
|---|---|---|---|---|---|---|---|
| A | 7437 | 7437 | 1804 | 1804 | 24.26% | 24.26% | 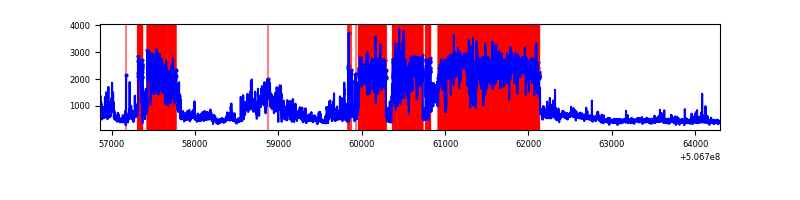 |
| B | 7438 | 7438 | 0 | 0 | 0.00% | 0.00% | 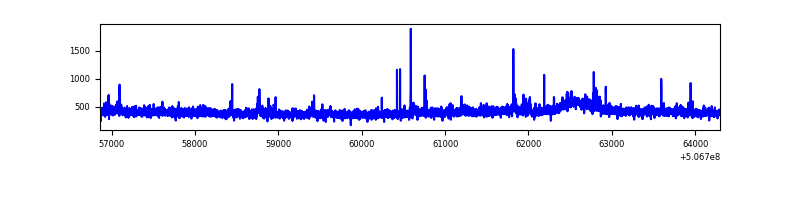 |
| C | 7438 | 7438 | 6 | 6 | 0.08% | 0.08% | 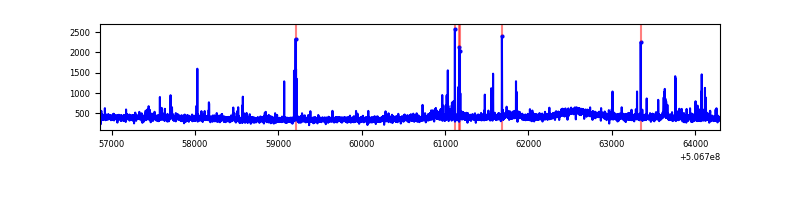 |
| D | 7437 | 7437 | 695 | 695 | 9.35% | 9.35% | 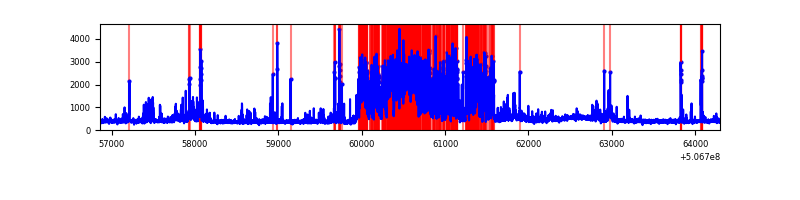 |
Top three noisy pixels from each quadrant. If the there are fewer than three noisy pixels in the level2.evt file, extra rows are filled as -1
| Pixel properties | Quadrant properties | ||||||
|---|---|---|---|---|---|---|---|
| Quadrant | DetID | PixID | Counts | Sigma | Mean | Median | Sigma |
| A | 12 | 115 | 4995865 | 28105.98 | 713 | 694 | 177.7 |
| A | 8 | 192 | 196555 | 1102.04 | 713 | 694 | 177.7 |
| A | 0 | 8 | 194747 | 1091.86 | 713 | 694 | 177.7 |
| B | 0 | 213 | 50061 | 305.83 | 747 | 721 | 161.3 |
| B | 12 | 111 | 19513 | 116.48 | 747 | 721 | 161.3 |
| B | 11 | 111 | 18595 | 110.79 | 747 | 721 | 161.3 |
| C | 6 | 223 | 44915 | 215.82 | 739 | 733 | 204.7 |
| C | 15 | 131 | 30330 | 144.58 | 739 | 733 | 204.7 |
| C | 12 | 252 | 24411 | 115.66 | 739 | 733 | 204.7 |
| D | 11 | 129 | 2404194 | 11868.5 | 713 | 682 | 202.5 |
| D | 3 | 12 | 167669 | 824.58 | 713 | 682 | 202.5 |
| D | 7 | 96 | 81579 | 399.47 | 713 | 682 | 202.5 |
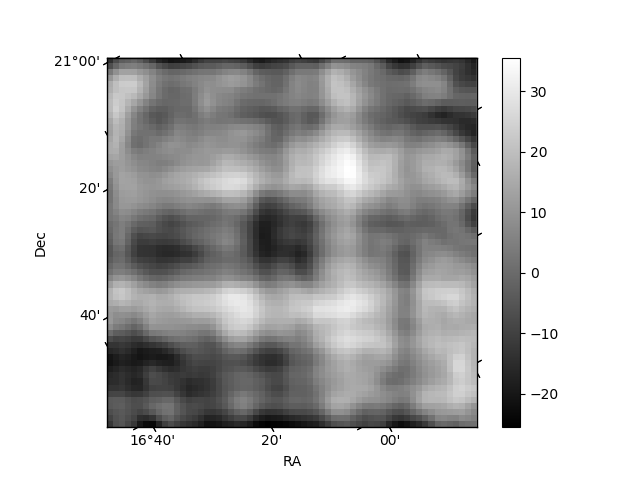
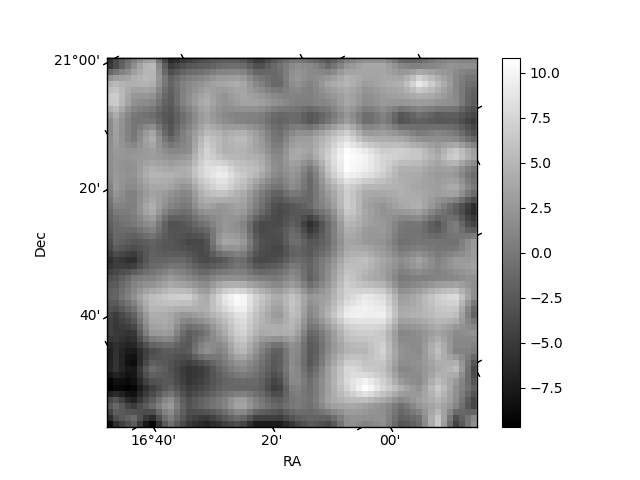
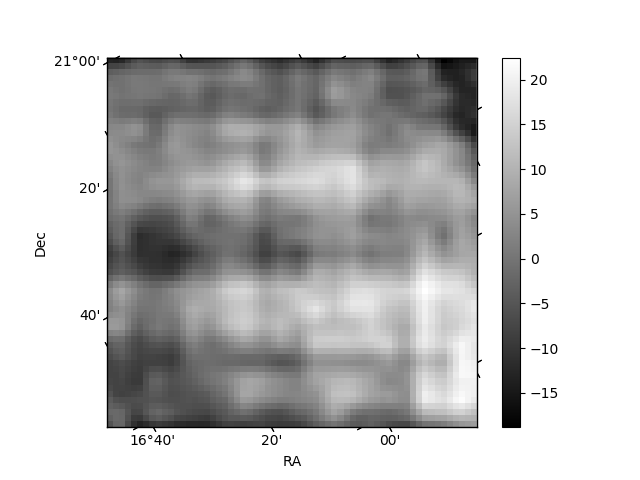
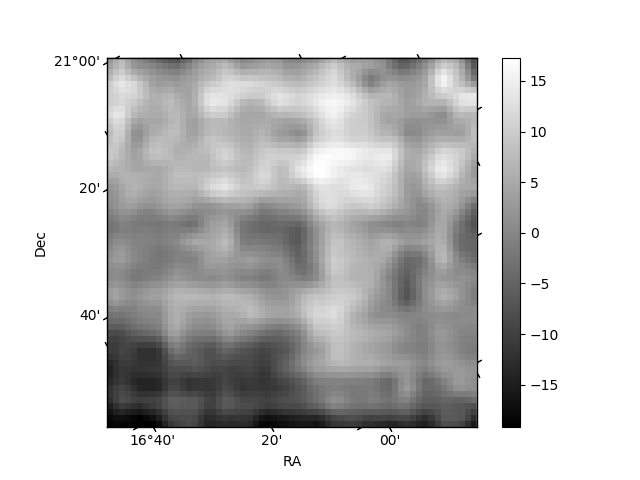
Histogram calculated using DETX and DETY for each event in the final _common_clean file
| Quadrant A | 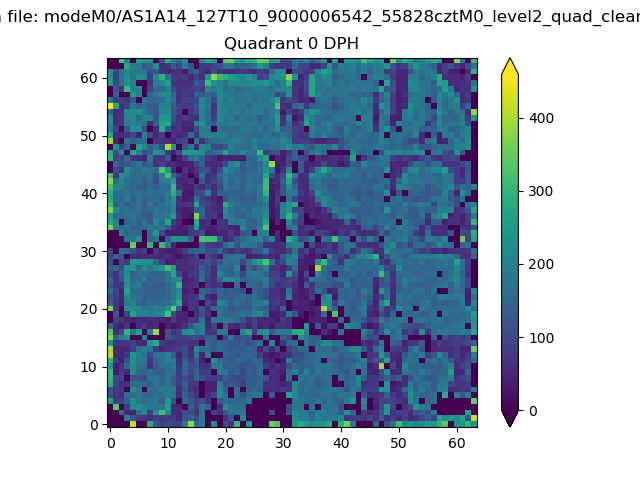 |
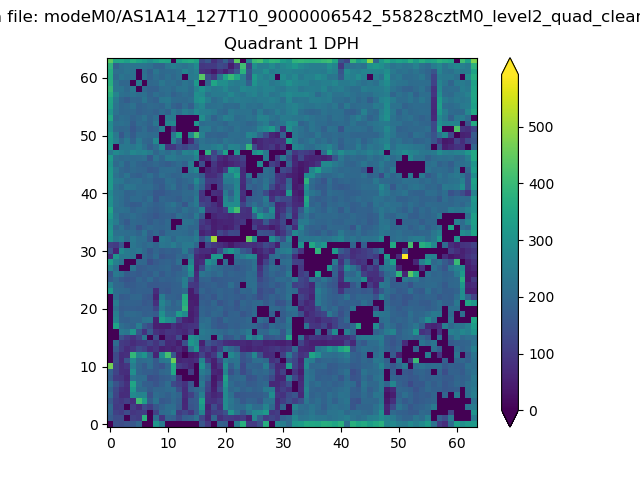 |
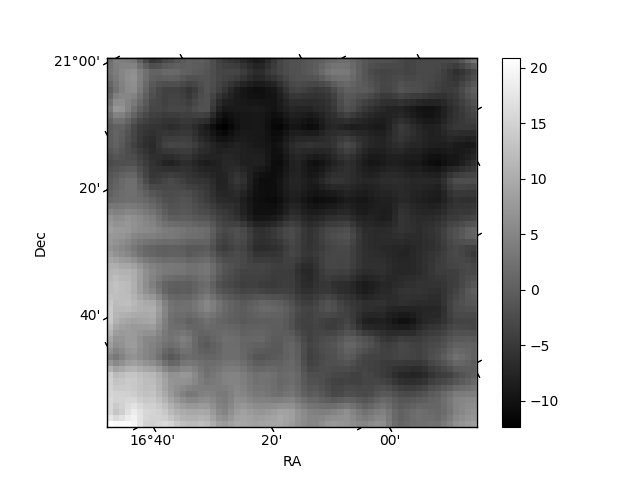
Quadrant B |
|---|---|---|---|
| Quadrant D | 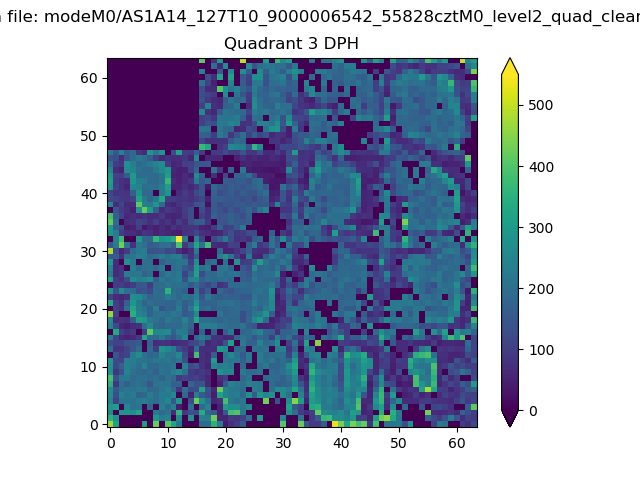 |
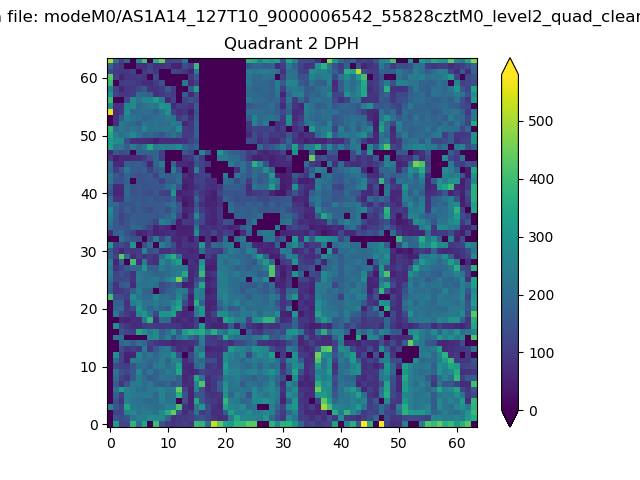 |
Quadrant C |
| Plot type | Count rate plots | Images |
|---|---|---|
| Comparison with Poisson distribution Blue bars denote a histogram of data divided into 1 sec bins. Red curve is a Poisson curve with rate = median count rate of data. |
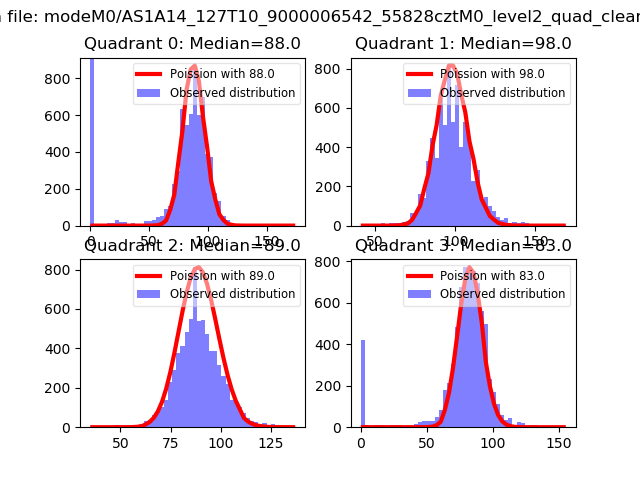 |
 |
| Quadrant-wise count rates Data is divided into 100 sec bins |
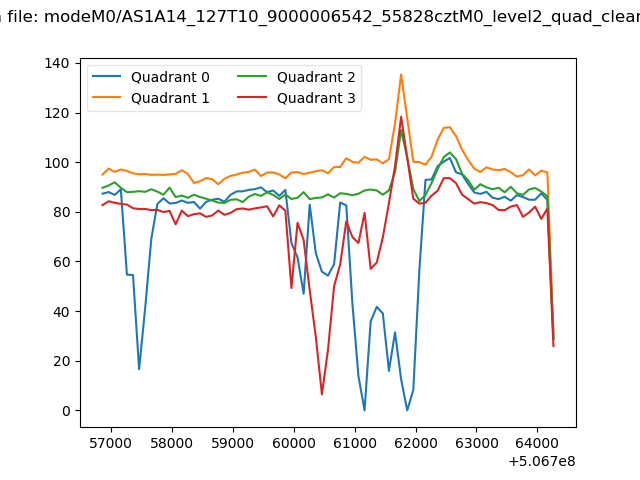 |
|
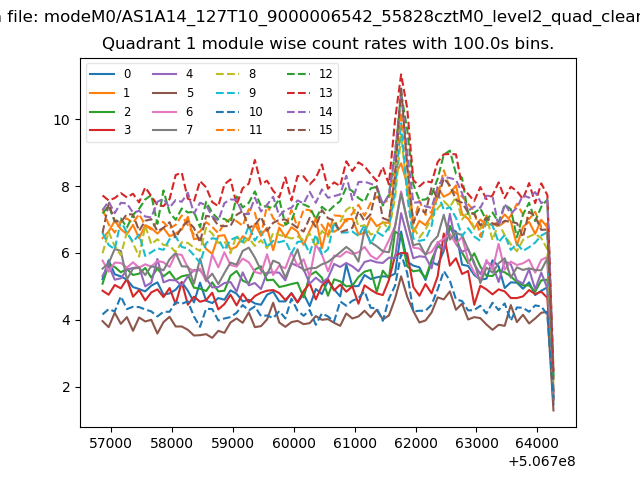
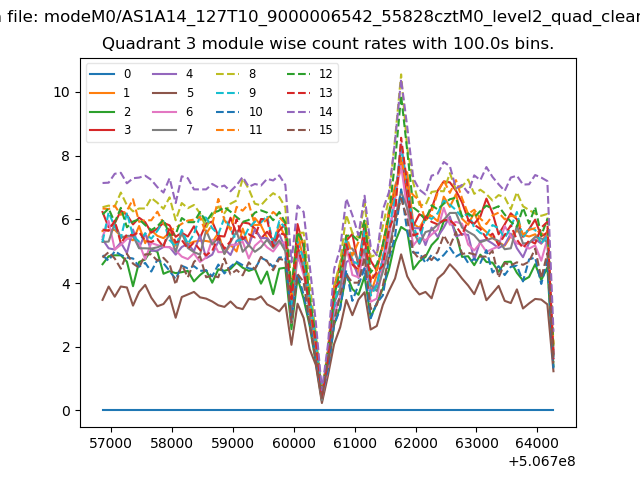
| Module-wise count rates for Quadrant A Data is divided into 100 sec bins |
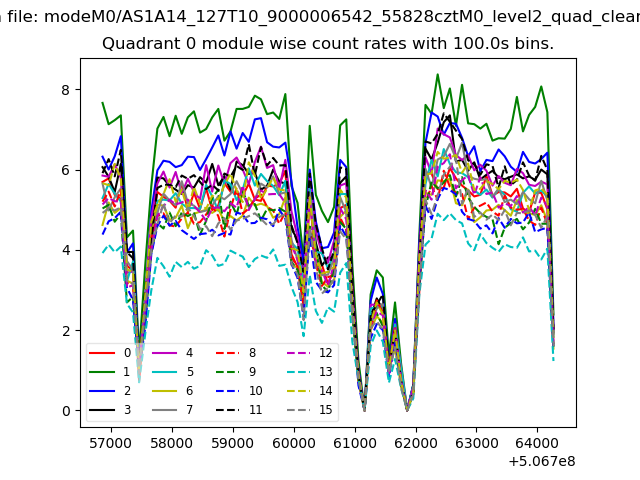 |
 |
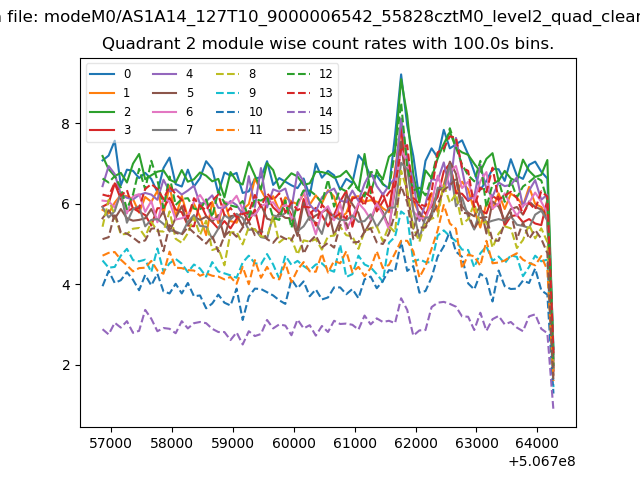
| Module-wise count rates for Quadrant B Data is divided into 100 sec bins |
 |
 |
| Module-wise count rates for Quadrant C Data is divided into 100 sec bins |
 |
 |
| Module-wise count rates for Quadrant D Data is divided into 100 sec bins |
 |
 |
| Parameter | Plot |
|---|---|
| CZT HV Monitor | 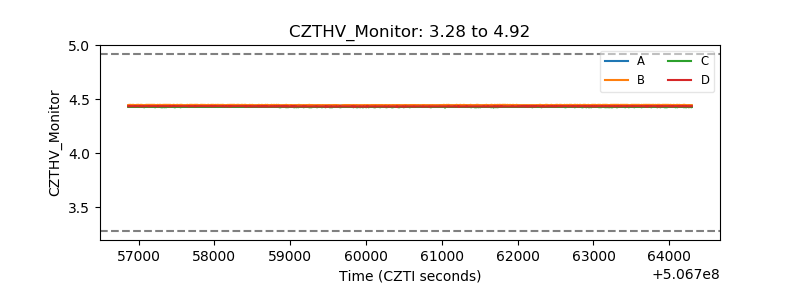 |
| D_VDD | 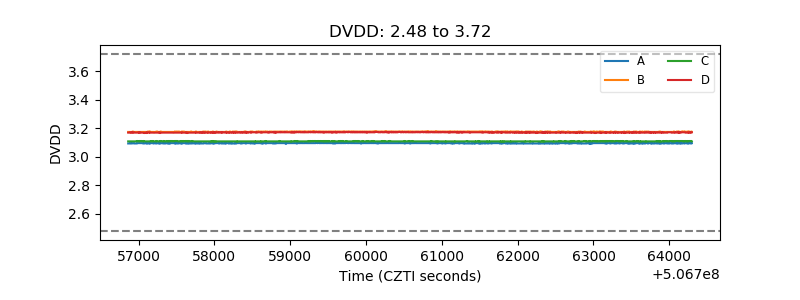 |
| Temperature 1 | 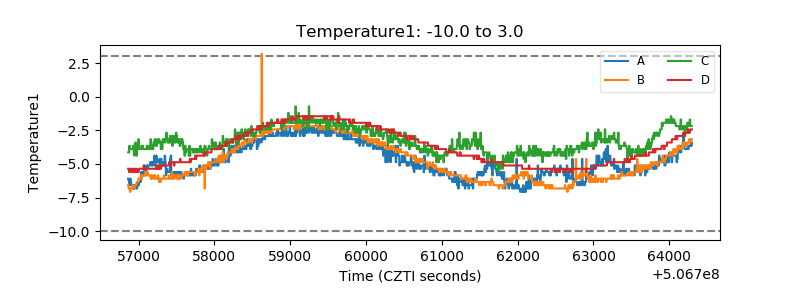 |
| Veto HV Monitor | 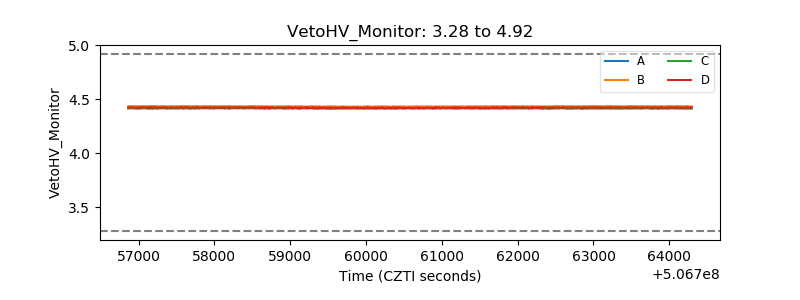 |
| Veto LLD | 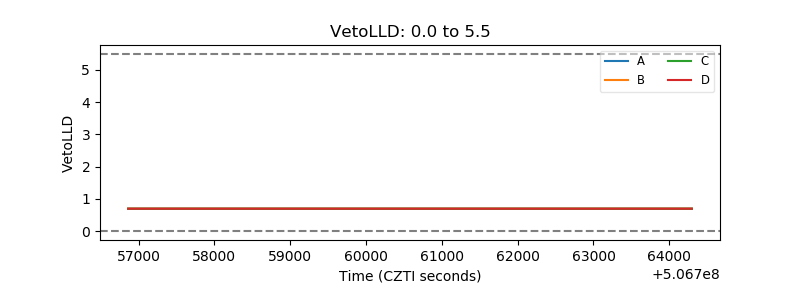 |
| Alpha Counter | 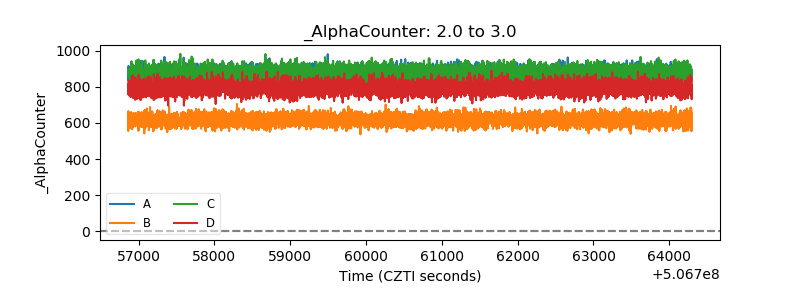 |
| _CPM_Rate | 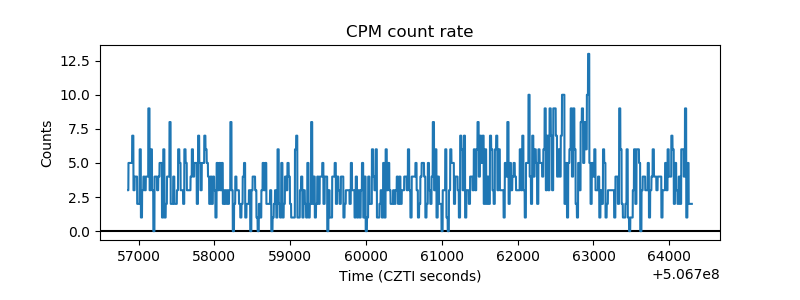 |
| CZT Counter | 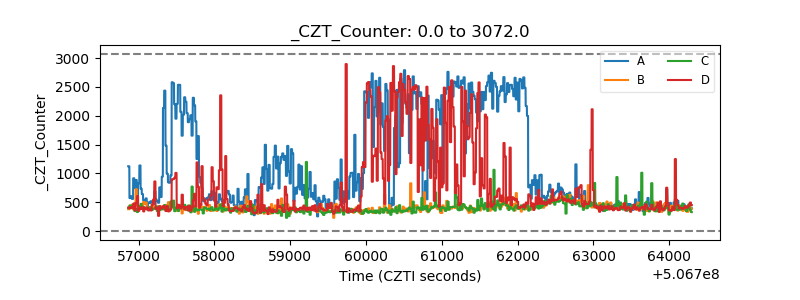 |
| +2.5 Volts monitor | 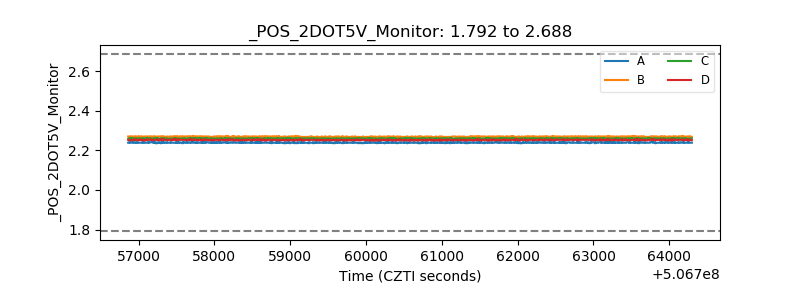 |
| +5 Volts monitor | 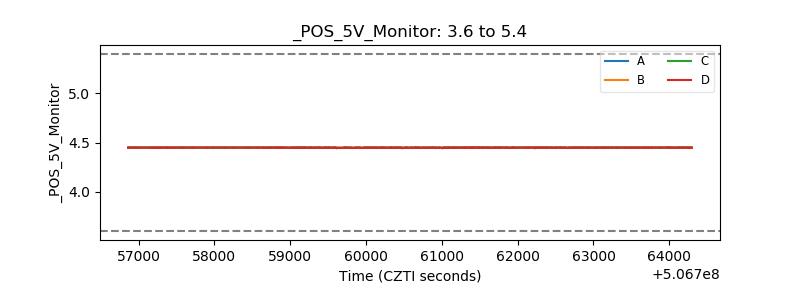 |
| _ROLL_ROT | 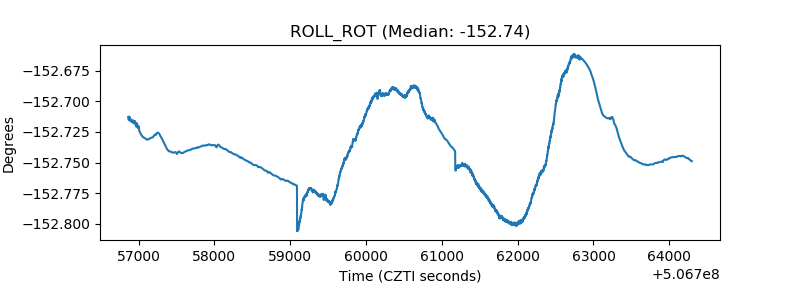 |
| _Roll_DEC | 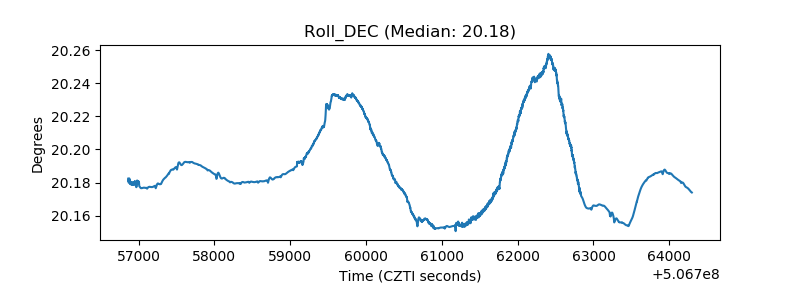 |
| _Roll_RA | 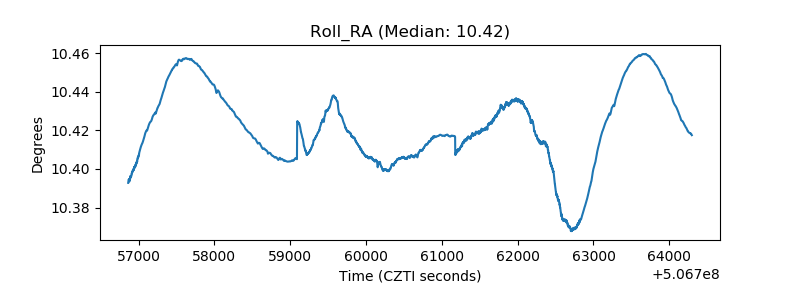 |
| Veto Counter | 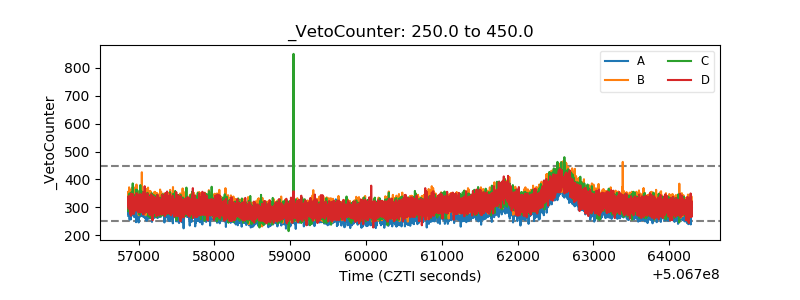 |