| Param | Original file | Final file |
|---|---|---|
| Filename | modeM0/AS1A14_127T10_9000006542_55829cztM0_level2.fits | modeM0/AS1A14_127T10_9000006542_55829cztM0_level2_quad_clean.evt |
| Size (bytes) | 411,949,440 | 103,072,320 |
| Size | 392.9 MB | 98.3 MB |
| Events in quadrant A | 3,646,424 | 654,643 |
| Events in quadrant B | 3,084,266 | 716,588 |
| Events in quadrant C | 3,361,358 | 642,641 |
| Events in quadrant D | 4,586,962 | 597,270 |
| Mode M0 | |||
|---|---|---|---|
| Quadrant | BADHDUFLAG | Total packets | Discarded packets |
| A | 0 | 16072 | 0 |
| B | 0 | 14881 | 0 |
| C | 0 | 15820 | 0 |
| D | 0 | 19069 | 1 |
| Mode SS | |||
|---|---|---|---|
| Quadrant | BADHDUFLAG | Total packets | Discarded packets |
| A | 0 | 146 | 0 |
| B | 0 | 146 | 0 |
| C | 0 | 146 | 0 |
| D | 0 | 146 | 0 |
| Quadrant | Total seconds | Saturated seconds | Saturation percentage |
|---|---|---|---|
| A | 7325 | 85 | 1.160410% |
| B | 7326 | 5 | 0.068250% |
| C | 7326 | 40 | 0.546001% |
| D | 7325 | 200 | 2.730375% |
Noise dominated data is calculated using 1-second bins in cleaned event files. If a bin has >2000 counts, and if more than 50% of those come from <1% of pixels, then it is considered to be noise-dominated and hence unusable.
| Quadrant | # 1 sec bins | Bins with >0 counts | Bins with >2000 counts | High rate bins dominated by noise | Noise dominated (total time) | Noise dominated (detector-on time) | Marked lightcurve |
|---|---|---|---|---|---|---|---|
| A | 7325 | 7325 | 74 | 74 | 1.01% | 1.01% | 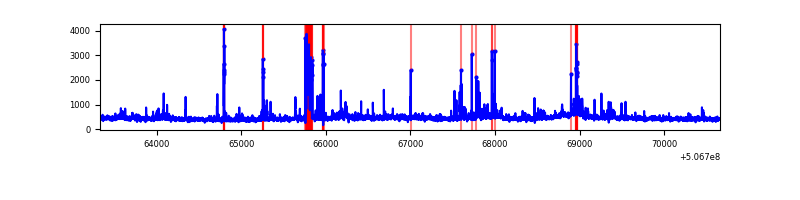 |
| B | 7326 | 7326 | 2 | 2 | 0.03% | 0.03% | 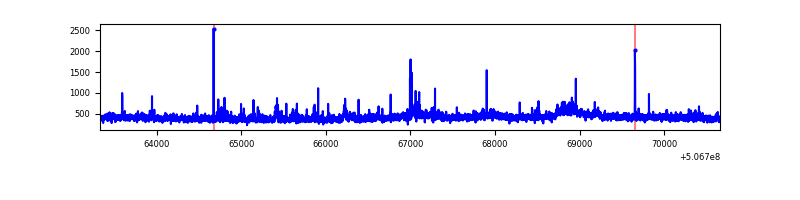 |
| C | 7326 | 7326 | 43 | 43 | 0.59% | 0.59% | 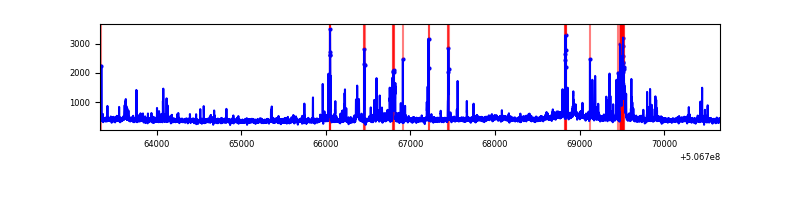 |
| D | 7325 | 7325 | 203 | 203 | 2.77% | 2.77% | 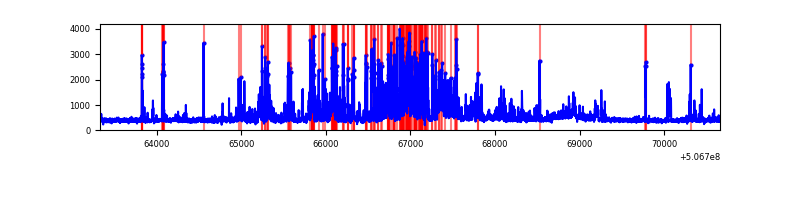 |
Top three noisy pixels from each quadrant. If the there are fewer than three noisy pixels in the level2.evt file, extra rows are filled as -1
| Pixel properties | Quadrant properties | ||||||
|---|---|---|---|---|---|---|---|
| Quadrant | DetID | PixID | Counts | Sigma | Mean | Median | Sigma |
| A | 4 | 205 | 141440 | 763.64 | 740 | 720 | 184.3 |
| A | 15 | 32 | 127059 | 685.6 | 740 | 720 | 184.3 |
| A | 4 | 3 | 125099 | 674.96 | 740 | 720 | 184.3 |
| B | 0 | 213 | 83557 | 517.38 | 733 | 706 | 160.1 |
| B | 7 | 0 | 45802 | 281.61 | 733 | 706 | 160.1 |
| B | 7 | 252 | 28152 | 171.39 | 733 | 706 | 160.1 |
| C | 12 | 252 | 174773 | 870.98 | 722 | 716 | 199.8 |
| C | 5 | 96 | 105069 | 522.18 | 722 | 716 | 199.8 |
| C | 6 | 223 | 79057 | 392.02 | 722 | 716 | 199.8 |
| D | 11 | 129 | 1218408 | 6016.73 | 713 | 680 | 202.4 |
| D | 8 | 245 | 248732 | 1225.61 | 713 | 680 | 202.4 |
| D | 3 | 12 | 145320 | 714.66 | 713 | 680 | 202.4 |
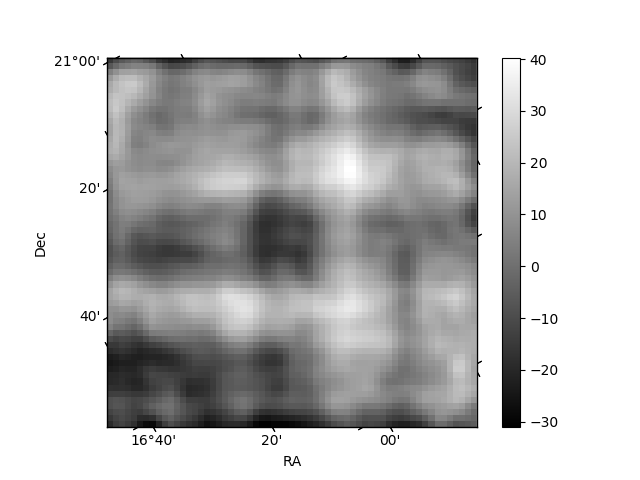
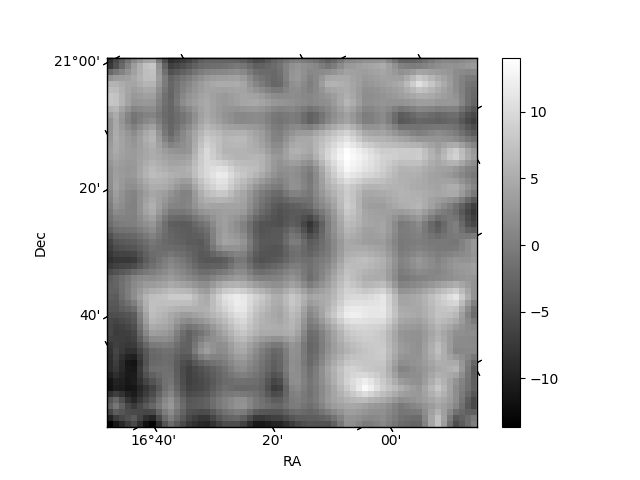
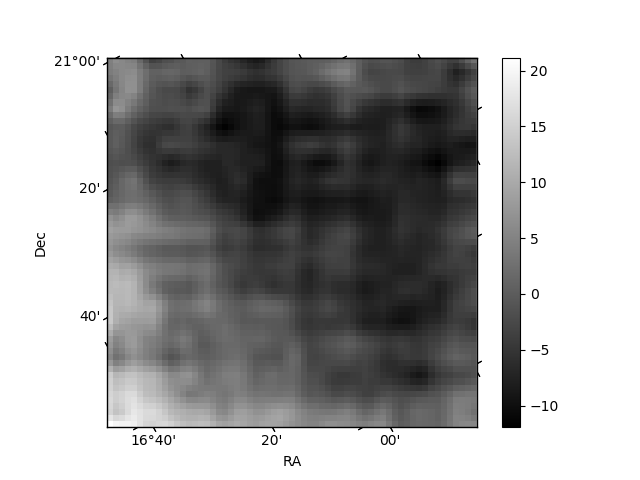
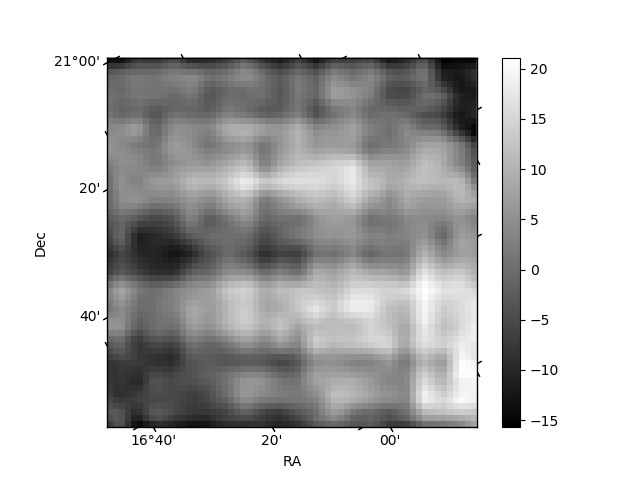
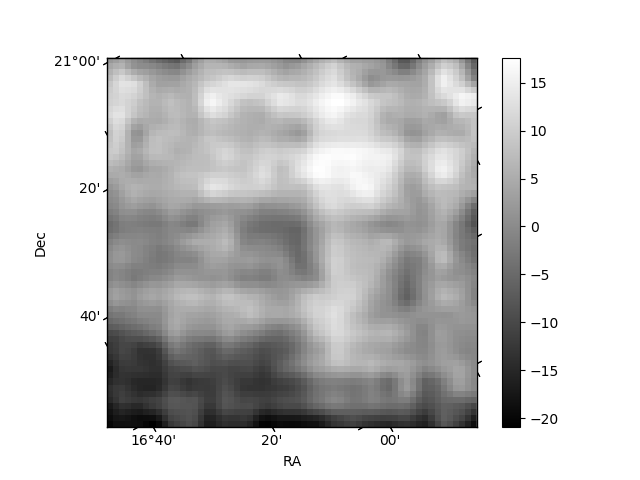
Histogram calculated using DETX and DETY for each event in the final _common_clean file
| Quadrant A | 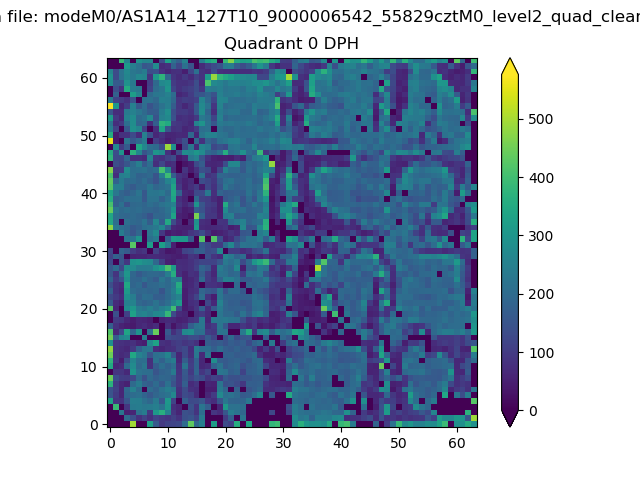 |
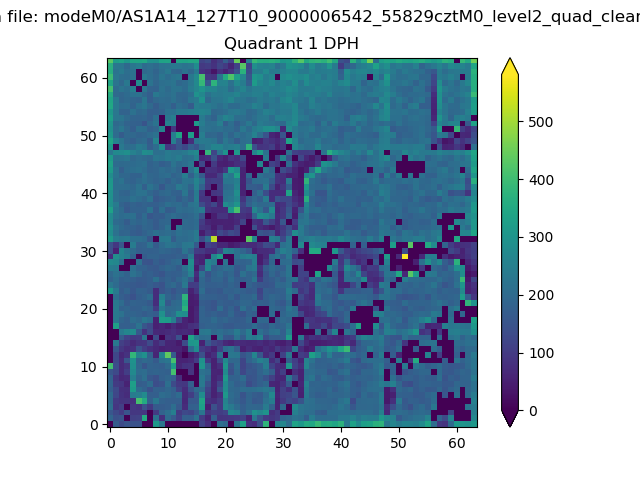 |
Quadrant B |
|---|---|---|---|
| Quadrant D | 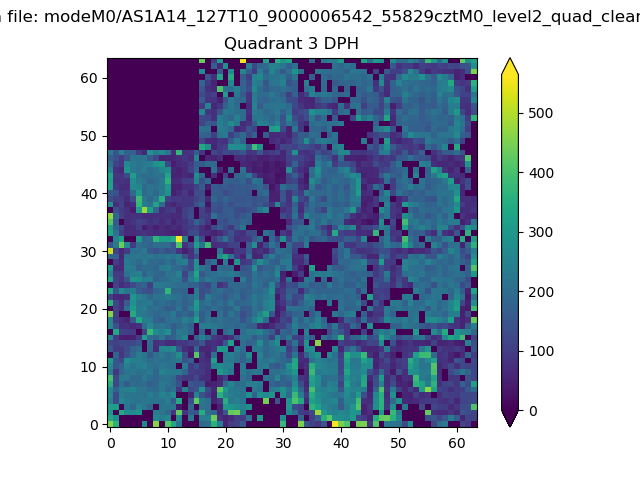 |
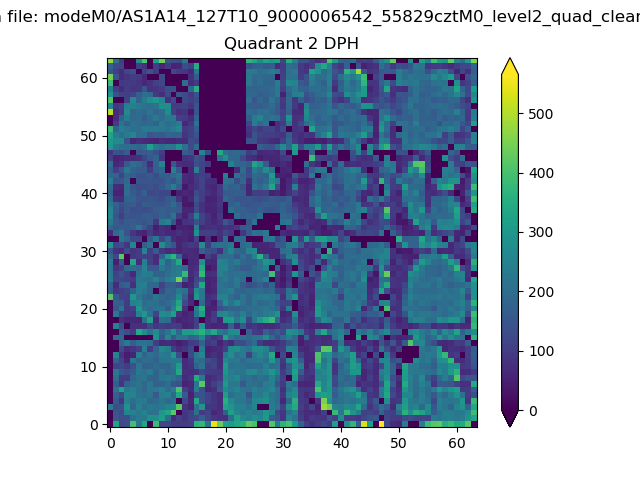 |
Quadrant C |
| Plot type | Count rate plots | Images |
|---|---|---|
| Comparison with Poisson distribution Blue bars denote a histogram of data divided into 1 sec bins. Red curve is a Poisson curve with rate = median count rate of data. |
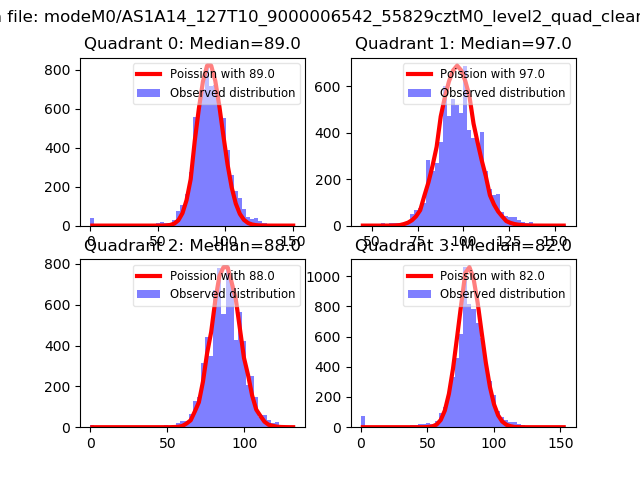 |
 |
| Quadrant-wise count rates Data is divided into 100 sec bins |
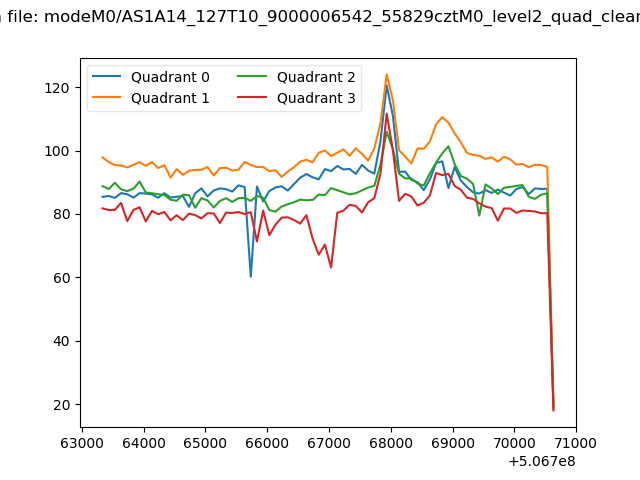 |
|
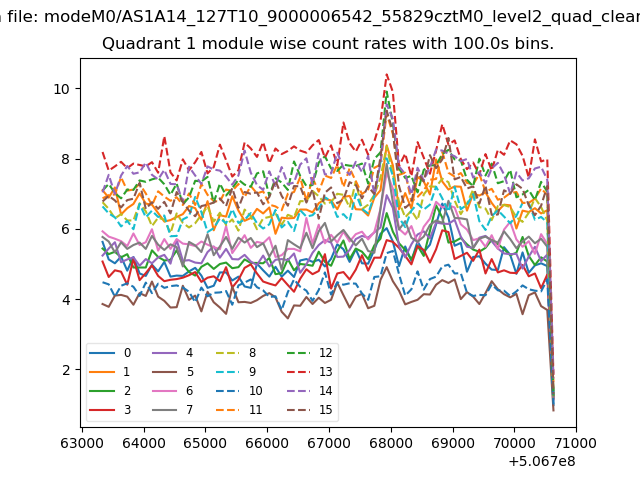
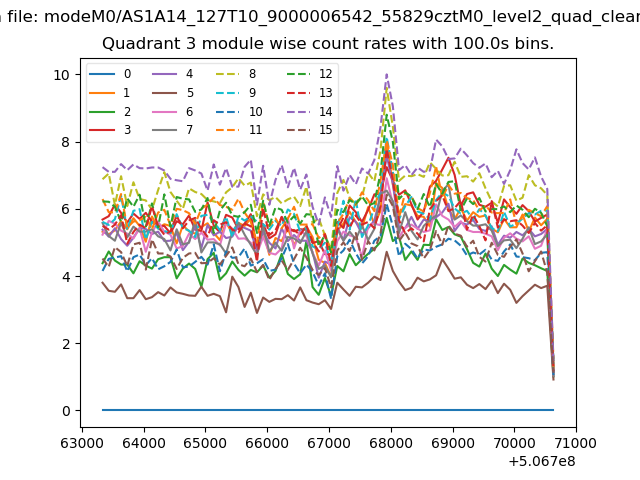
| Module-wise count rates for Quadrant A Data is divided into 100 sec bins |
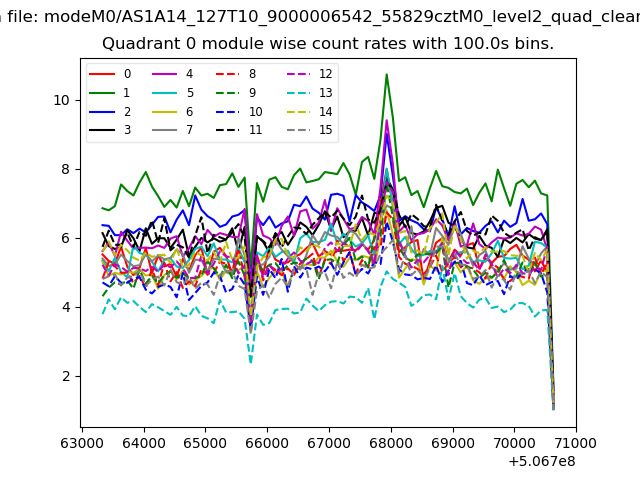 |
 |
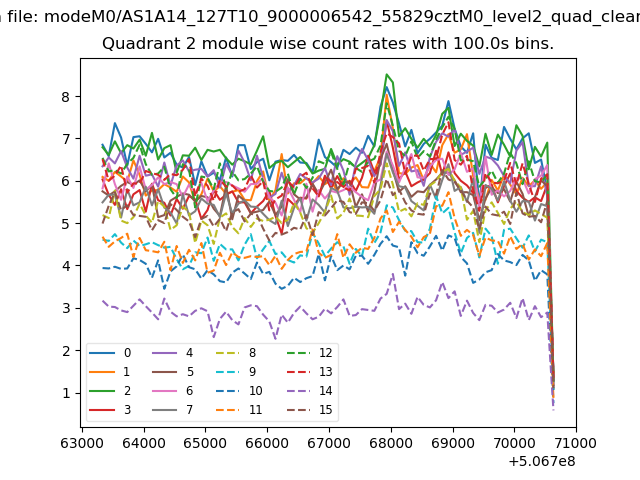
| Module-wise count rates for Quadrant B Data is divided into 100 sec bins |
 |
 |
| Module-wise count rates for Quadrant C Data is divided into 100 sec bins |
 |
 |
| Module-wise count rates for Quadrant D Data is divided into 100 sec bins |
 |
 |
| Parameter | Plot |
|---|---|
| CZT HV Monitor | 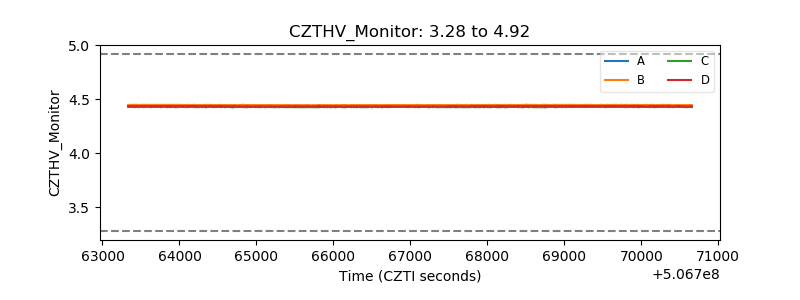 |
| D_VDD | 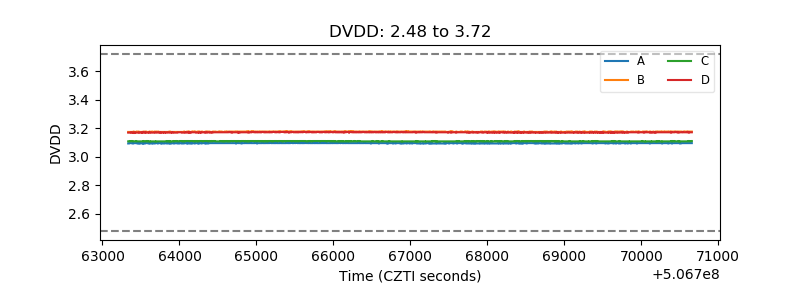 |
| Temperature 1 |  |
| Veto HV Monitor | 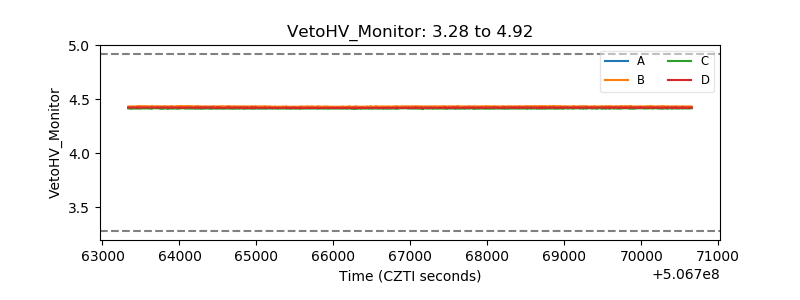 |
| Veto LLD | 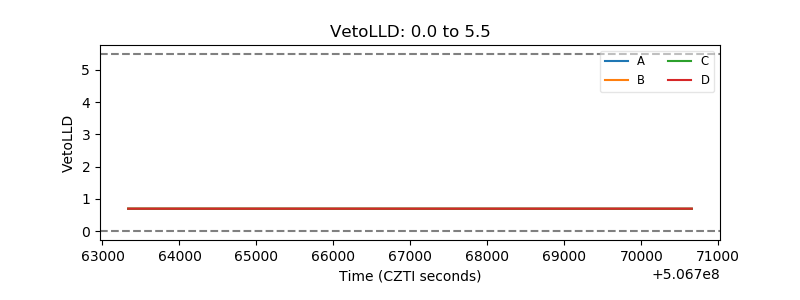 |
| Alpha Counter | 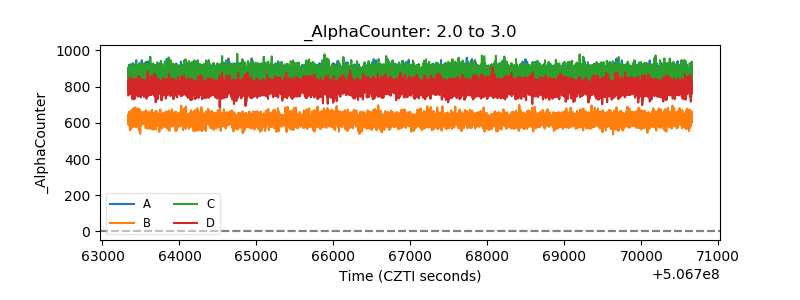 |
| _CPM_Rate | 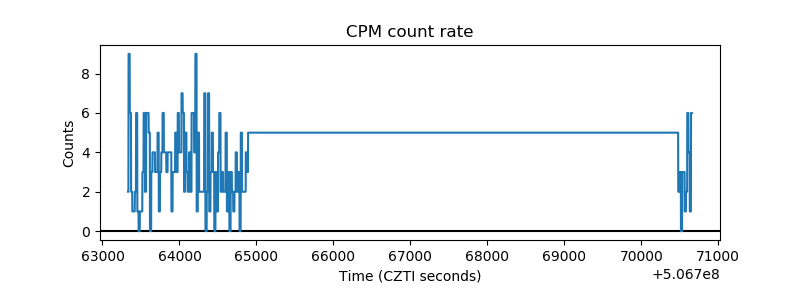 |
| CZT Counter | 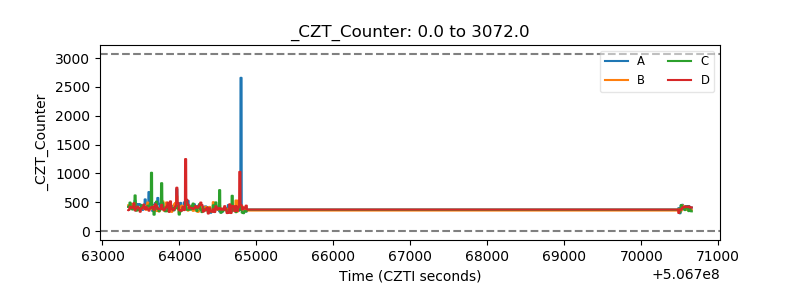 |
| +2.5 Volts monitor | 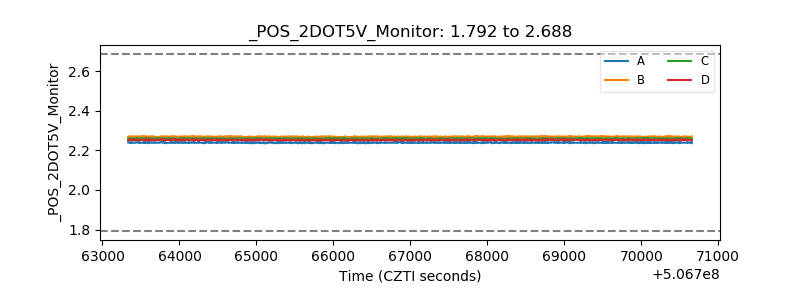 |
| +5 Volts monitor | 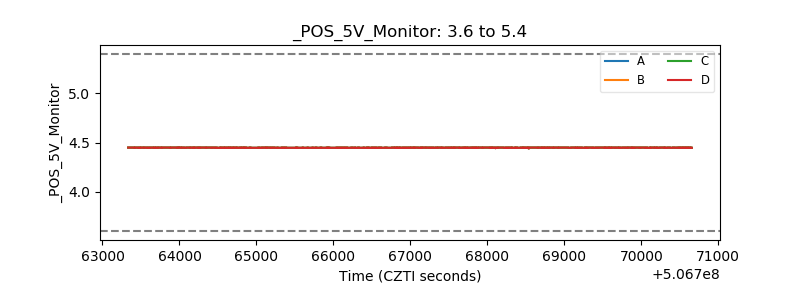 |
| _ROLL_ROT | 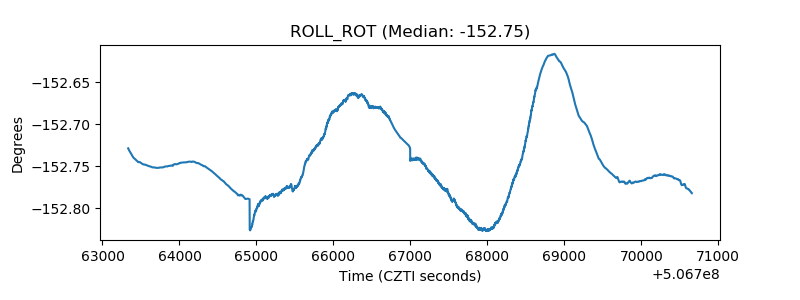 |
| _Roll_DEC | 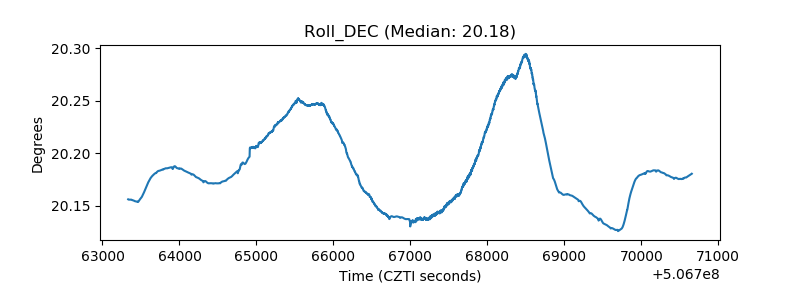 |
| _Roll_RA | 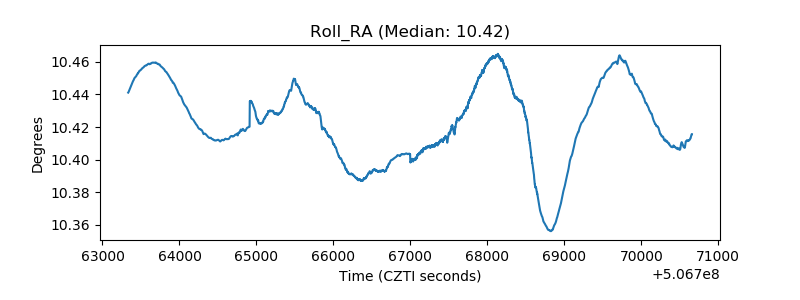 |
| Veto Counter | 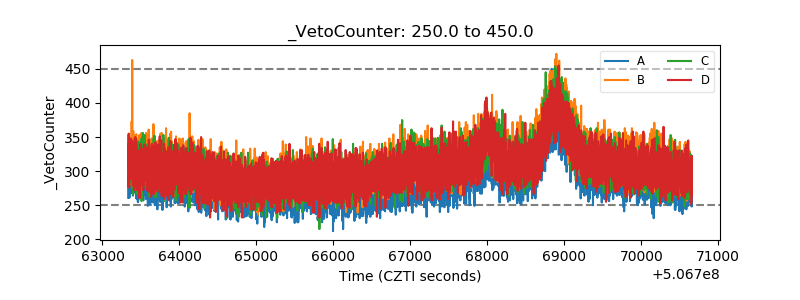 |