| Param | Original file | Final file |
|---|---|---|
| Filename | modeM0/AS1A14_127T10_9000006542_55832cztM0_level2.fits | modeM0/AS1A14_127T10_9000006542_55832cztM0_level2_quad_clean.evt |
| Size (bytes) | 1,221,632,640 | 271,333,440 |
| Size | 1.1 GB | 258.8 MB |
| Events in quadrant A | 12,840,556 | 1,683,792 |
| Events in quadrant B | 9,379,318 | 1,897,659 |
| Events in quadrant C | 9,942,539 | 1,706,219 |
| Events in quadrant D | 11,541,080 | 1,578,548 |
| Mode M0 | |||
|---|---|---|---|
| Quadrant | BADHDUFLAG | Total packets | Discarded packets |
| A | 0 | 51834 | 2 |
| B | 0 | 42812 | 2 |
| C | 0 | 45187 | 2 |
| D | 0 | 49078 | 2 |
| Mode M9 | |||
|---|---|---|---|
| Quadrant | BADHDUFLAG | Total packets | Discarded packets |
| A | 0 | 6 | 0 |
| B | 0 | 6 | 0 |
| C | 0 | 6 | 0 |
| D | 0 | 6 | 0 |
| Mode SS | |||
|---|---|---|---|
| Quadrant | BADHDUFLAG | Total packets | Discarded packets |
| A | 0 | 396 | 0 |
| B | 0 | 396 | 0 |
| C | 0 | 396 | 0 |
| D | 0 | 396 | 0 |
| Quadrant | Total seconds | Saturated seconds | Saturation percentage |
|---|---|---|---|
| A | 19581 | 1294 | 6.608447% |
| B | 19581 | 419 | 2.139829% |
| C | 19581 | 471 | 2.405393% |
| D | 19581 | 770 | 3.932383% |
Noise dominated data is calculated using 1-second bins in cleaned event files. If a bin has >2000 counts, and if more than 50% of those come from <1% of pixels, then it is considered to be noise-dominated and hence unusable.
| Quadrant | # 1 sec bins | Bins with >0 counts | Bins with >2000 counts | High rate bins dominated by noise | Noise dominated (total time) | Noise dominated (detector-on time) | Marked lightcurve |
|---|---|---|---|---|---|---|---|
| A | 20246 | 19582 | 916 | 916 | 4.52% | 4.68% | 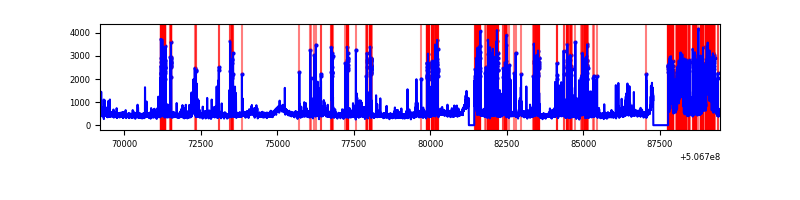 |
| B | 20246 | 19583 | 186 | 186 | 0.92% | 0.95% | 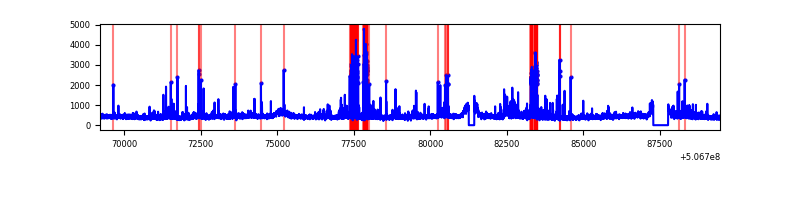 |
| C | 20246 | 19582 | 352 | 352 | 1.74% | 1.80% | 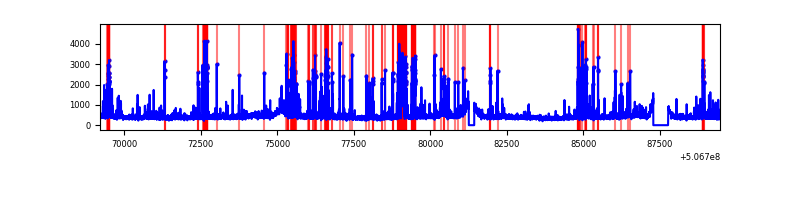 |
| D | 20246 | 19582 | 523 | 523 | 2.58% | 2.67% | 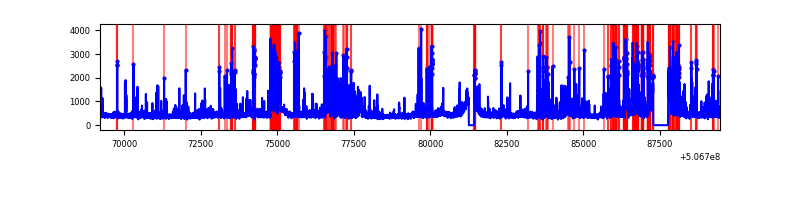 |
Top three noisy pixels from each quadrant. If the there are fewer than three noisy pixels in the level2.evt file, extra rows are filled as -1
| Pixel properties | Quadrant properties | ||||||
|---|---|---|---|---|---|---|---|
| Quadrant | DetID | PixID | Counts | Sigma | Mean | Median | Sigma |
| A | 0 | 8 | 1191818 | 2406.5 | 1985 | 1936 | 494.4 |
| A | 15 | 32 | 1071322 | 2162.8 | 1985 | 1936 | 494.4 |
| A | 12 | 115 | 859645 | 1734.69 | 1985 | 1936 | 494.4 |
| B | 5 | 185 | 661005 | 1537.8 | 2003 | 1925 | 428.6 |
| B | 0 | 213 | 297792 | 690.33 | 2003 | 1925 | 428.6 |
| B | 7 | 252 | 135583 | 311.86 | 2003 | 1925 | 428.6 |
| C | 13 | 3 | 1268576 | 2335.23 | 1975 | 1954 | 542.4 |
| C | 6 | 223 | 296967 | 543.91 | 1975 | 1954 | 542.4 |
| C | 12 | 252 | 266108 | 487.01 | 1975 | 1954 | 542.4 |
| D | 11 | 129 | 1333267 | 2413.92 | 1952 | 1866 | 551.6 |
| D | 5 | 38 | 633216 | 1144.68 | 1952 | 1866 | 551.6 |
| D | 3 | 12 | 513552 | 927.72 | 1952 | 1866 | 551.6 |
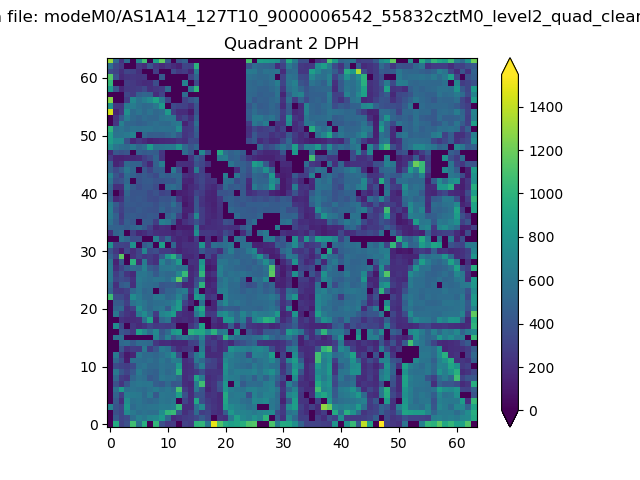
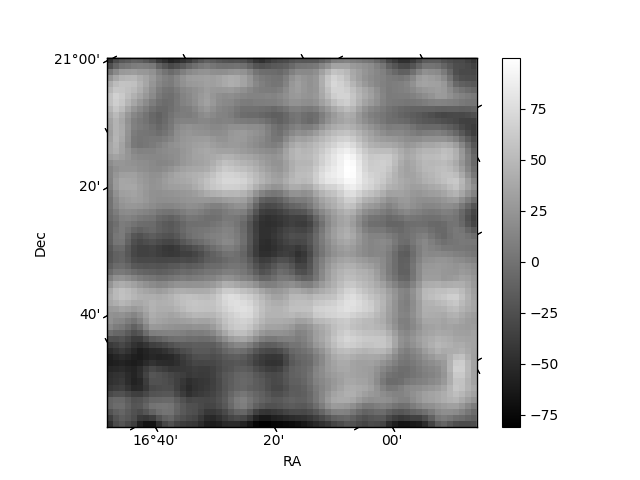
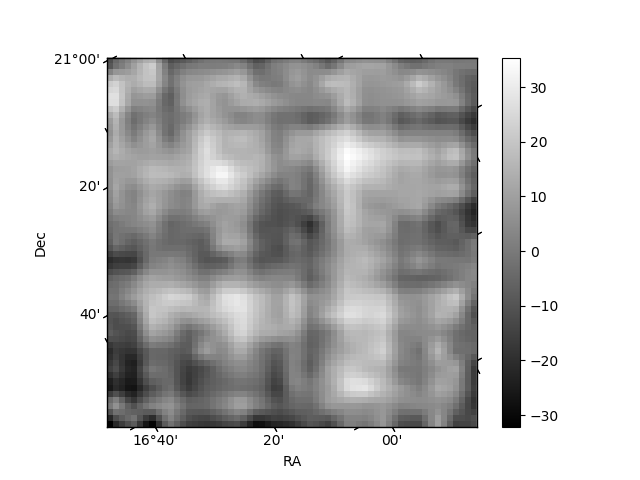
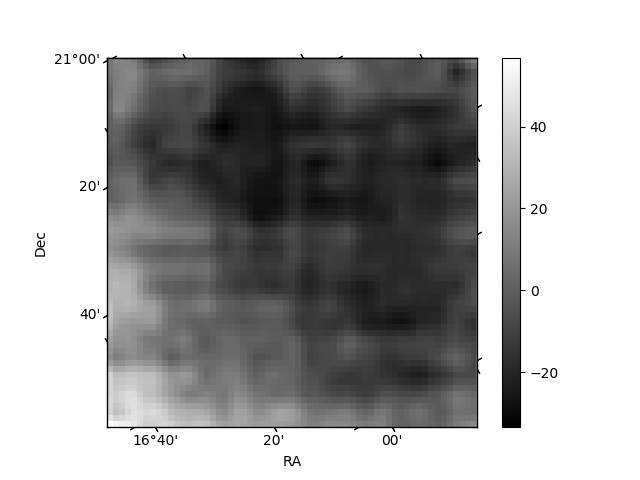
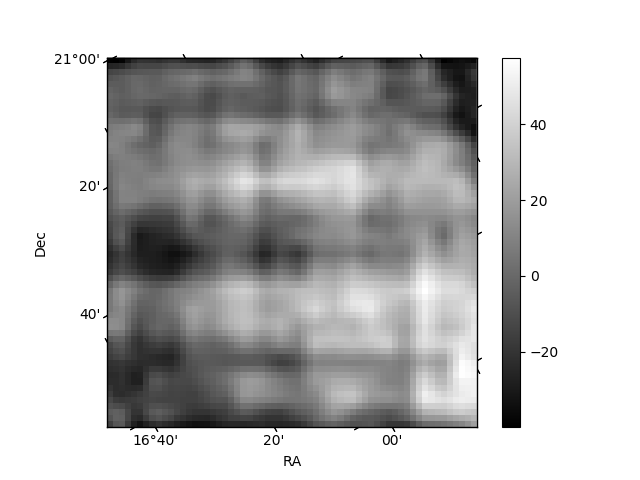
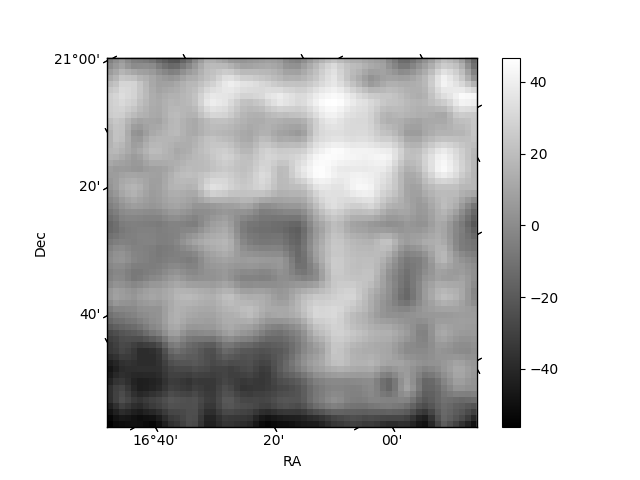
Histogram calculated using DETX and DETY for each event in the final _common_clean file
| Quadrant A | 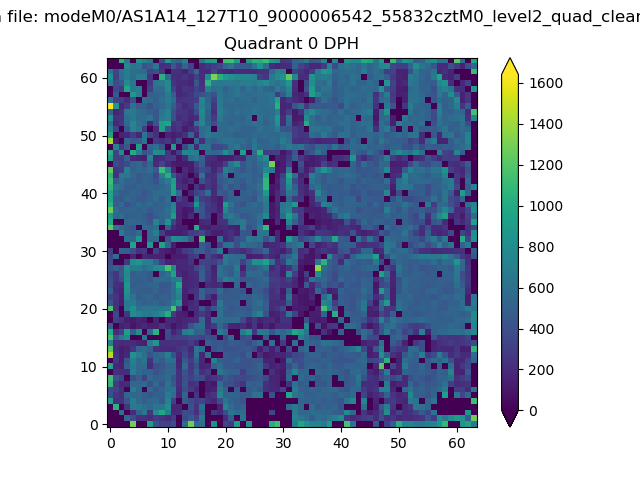 |
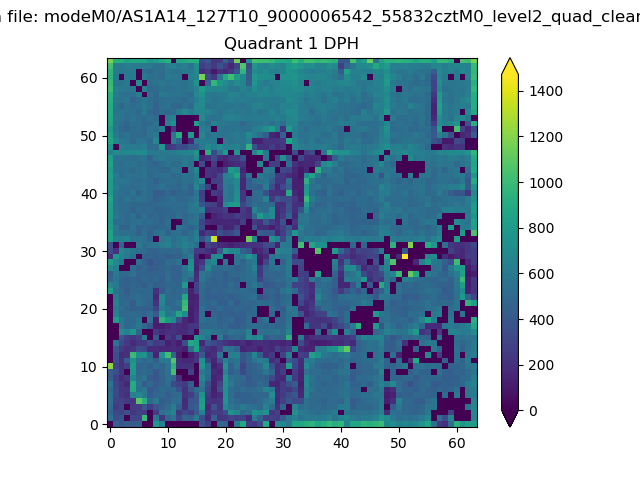 |
Quadrant B |
|---|---|---|---|
| Quadrant D | 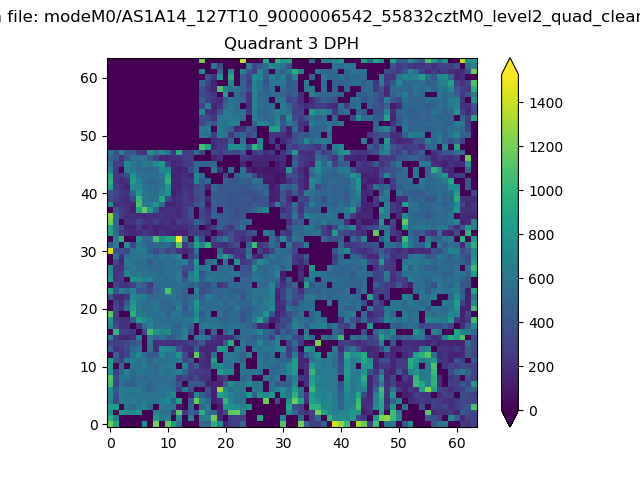 |
 |
Quadrant C |
| Plot type | Count rate plots | Images |
|---|---|---|
| Comparison with Poisson distribution Blue bars denote a histogram of data divided into 1 sec bins. Red curve is a Poisson curve with rate = median count rate of data. |
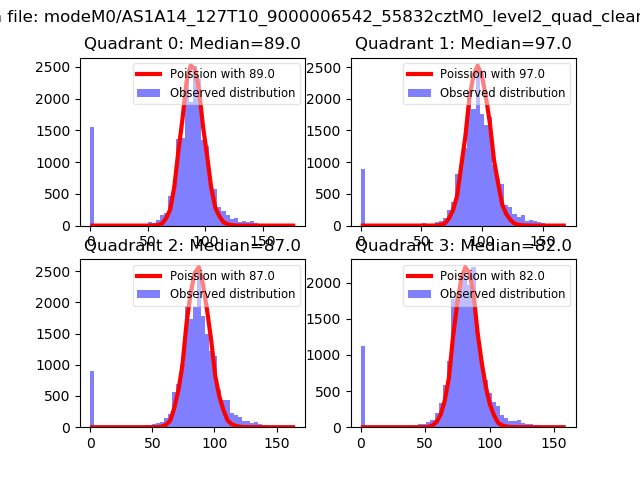 |
 |
| Quadrant-wise count rates Data is divided into 100 sec bins |
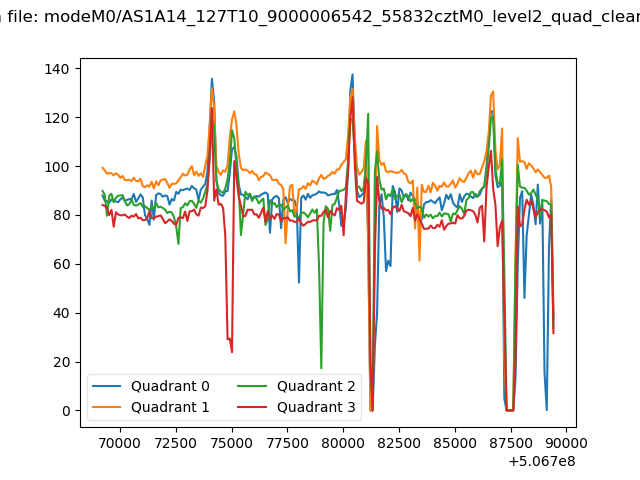 |
|
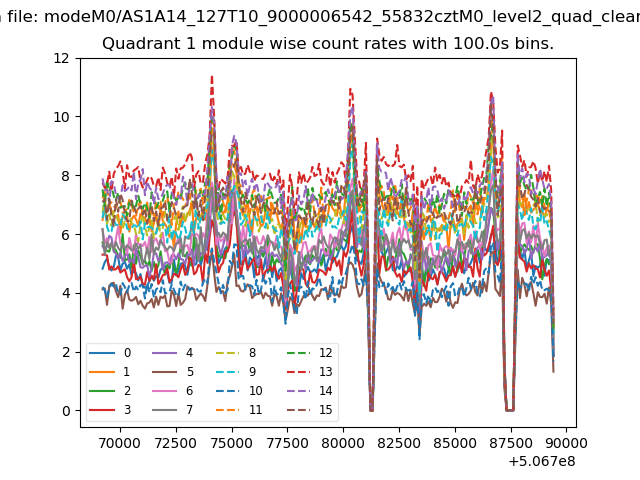
| Module-wise count rates for Quadrant A Data is divided into 100 sec bins |
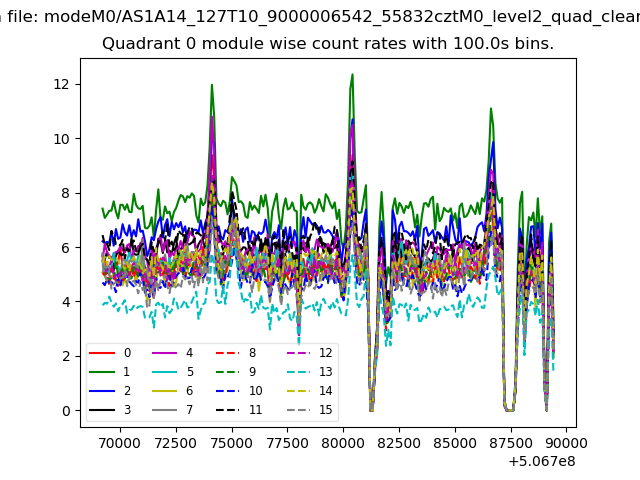 |
 |
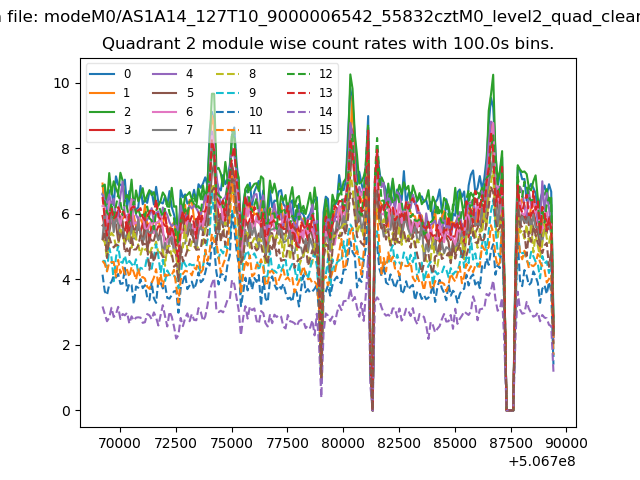
| Module-wise count rates for Quadrant B Data is divided into 100 sec bins |
 |
 |
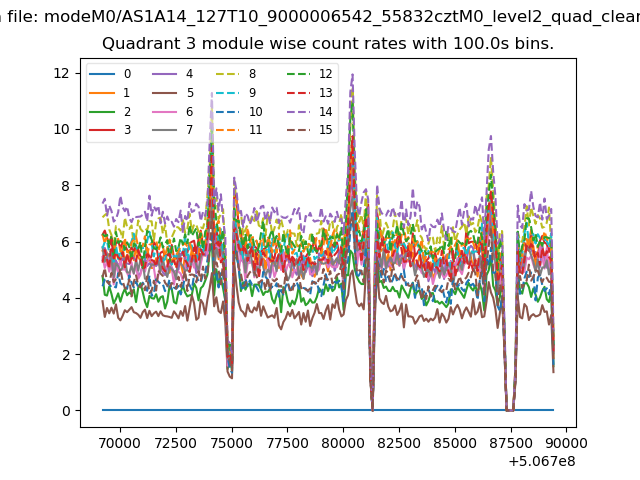
| Module-wise count rates for Quadrant C Data is divided into 100 sec bins |
 |
 |
| Module-wise count rates for Quadrant D Data is divided into 100 sec bins |
 |
 |
| Parameter | Plot |
|---|---|
| CZT HV Monitor | 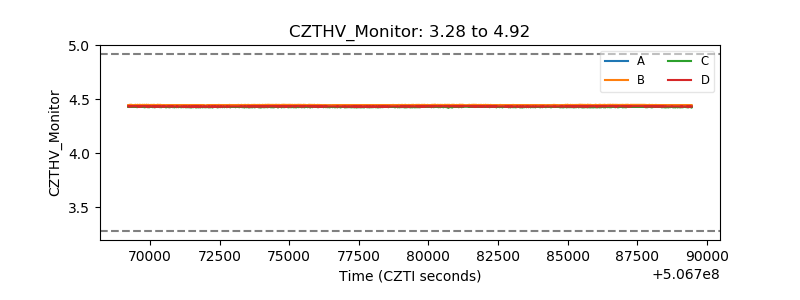 |
| D_VDD | 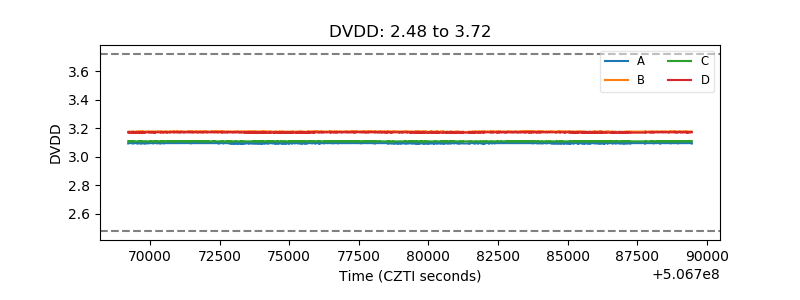 |
| Temperature 1 | 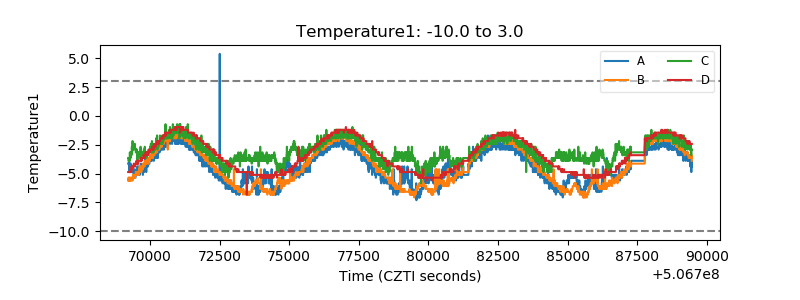 |
| Veto HV Monitor | 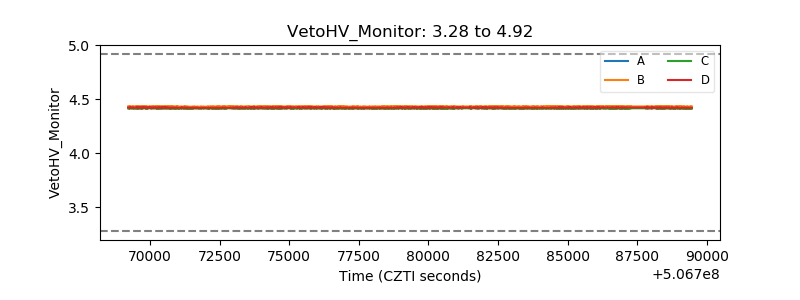 |
| Veto LLD | 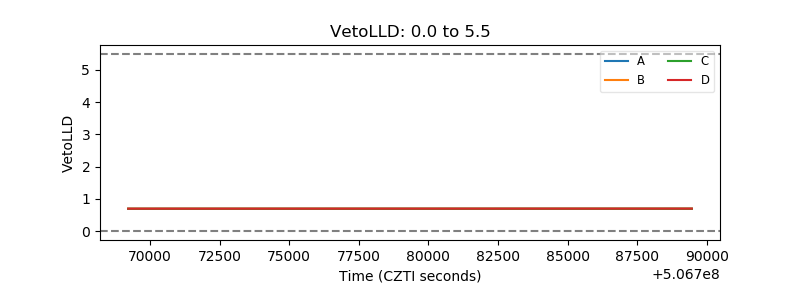 |
| Alpha Counter | 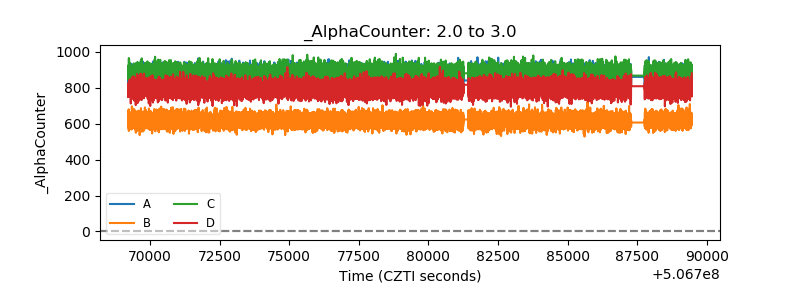 |
| _CPM_Rate | 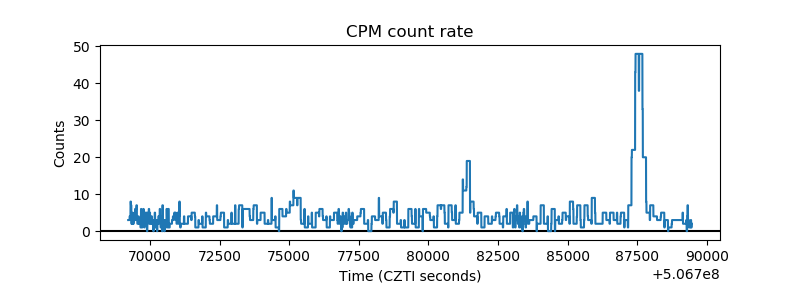 |
| CZT Counter | 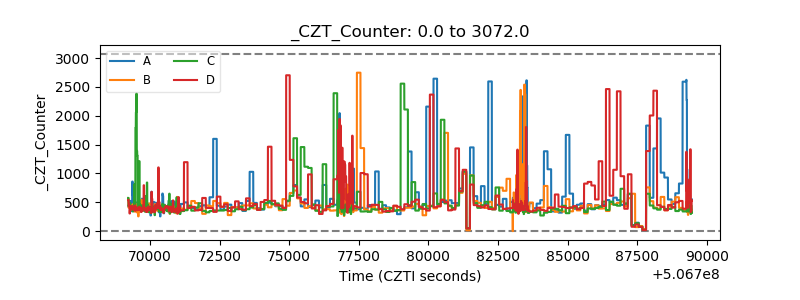 |
| +2.5 Volts monitor | 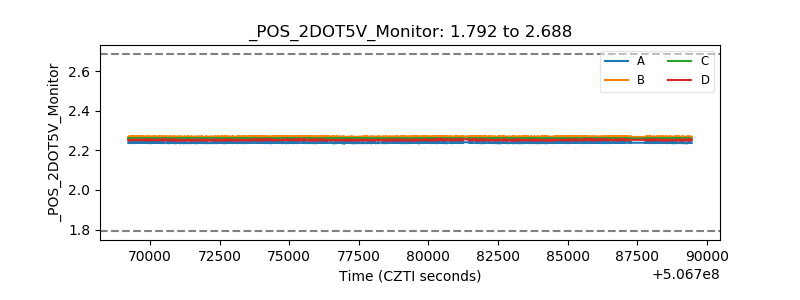 |
| +5 Volts monitor | 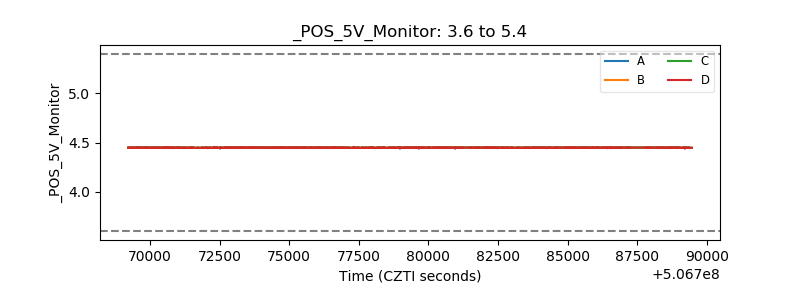 |
| _ROLL_ROT | 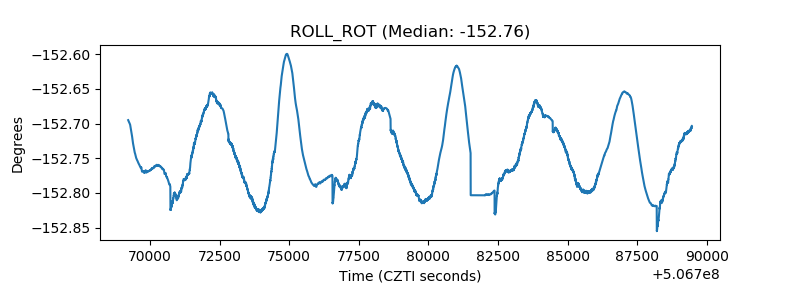 |
| _Roll_DEC | 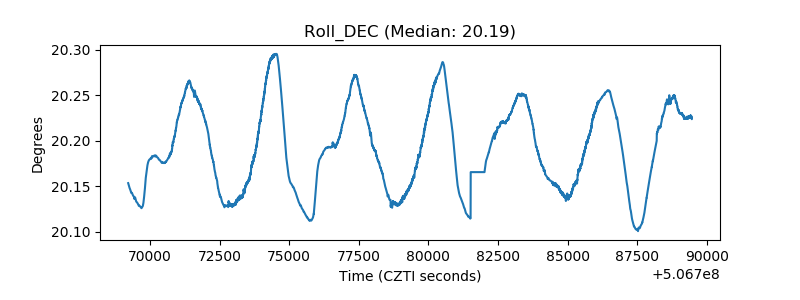 |
| _Roll_RA | 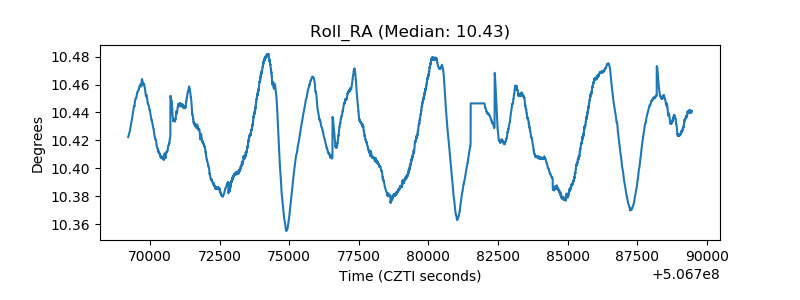 |
| Veto Counter | 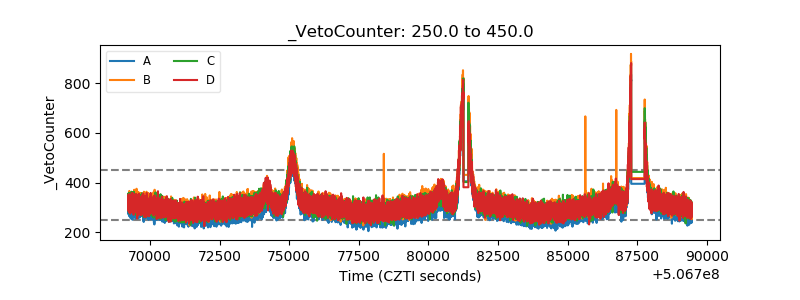 |