| Param | Original file | Final file |
|---|---|---|
| Filename | modeM0/AS1A14_127T10_9000006542_55833cztM0_level2.fits | modeM0/AS1A14_127T10_9000006542_55833cztM0_level2_quad_clean.evt |
| Size (bytes) | 1,559,462,400 | 335,125,440 |
| Size | 1.5 GB | 319.6 MB |
| Events in quadrant A | 16,377,485 | 2,098,345 |
| Events in quadrant B | 11,356,198 | 2,347,654 |
| Events in quadrant C | 12,124,590 | 2,109,668 |
| Events in quadrant D | 16,013,583 | 1,942,475 |
| Mode M0 | |||
|---|---|---|---|
| Quadrant | BADHDUFLAG | Total packets | Discarded packets |
| A | 0 | 65274 | 4 |
| B | 0 | 52243 | 3 |
| C | 0 | 55079 | 3 |
| D | 0 | 65390 | 3 |
| Mode M9 | |||
|---|---|---|---|
| Quadrant | BADHDUFLAG | Total packets | Discarded packets |
| A | 0 | 14 | 0 |
| B | 0 | 14 | 0 |
| C | 0 | 14 | 0 |
| D | 0 | 14 | 0 |
| Mode SS | |||
|---|---|---|---|
| Quadrant | BADHDUFLAG | Total packets | Discarded packets |
| A | 0 | 486 | 0 |
| B | 0 | 486 | 0 |
| C | 0 | 486 | 0 |
| D | 0 | 486 | 0 |
| Quadrant | Total seconds | Saturated seconds | Saturation percentage |
|---|---|---|---|
| A | 23954 | 1557 | 6.499958% |
| B | 23955 | 481 | 2.007932% |
| C | 23955 | 536 | 2.237529% |
| D | 23955 | 1299 | 5.422668% |
Noise dominated data is calculated using 1-second bins in cleaned event files. If a bin has >2000 counts, and if more than 50% of those come from <1% of pixels, then it is considered to be noise-dominated and hence unusable.
| Quadrant | # 1 sec bins | Bins with >0 counts | Bins with >2000 counts | High rate bins dominated by noise | Noise dominated (total time) | Noise dominated (detector-on time) | Marked lightcurve |
|---|---|---|---|---|---|---|---|
| A | 25394 | 23956 | 1195 | 1195 | 4.71% | 4.99% | 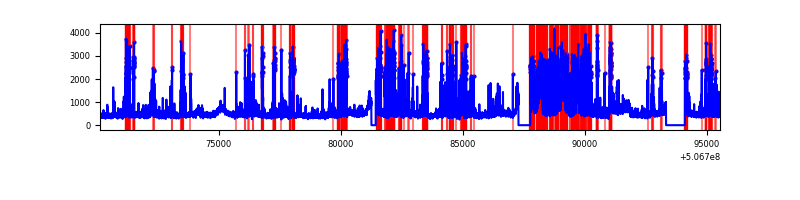 |
| B | 25395 | 23958 | 219 | 219 | 0.86% | 0.91% | 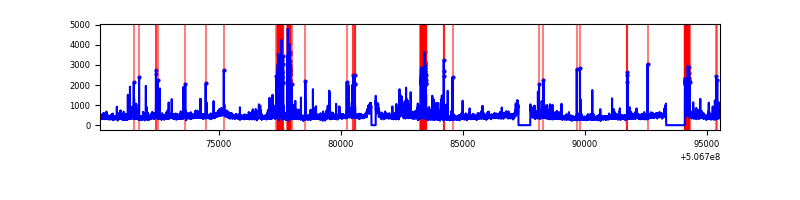 |
| C | 25395 | 23957 | 424 | 424 | 1.67% | 1.77% | 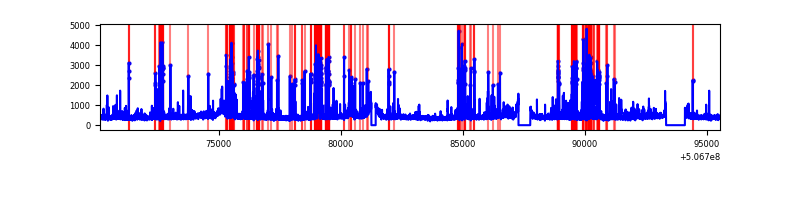 |
| D | 25395 | 23957 | 1046 | 1046 | 4.12% | 4.37% | 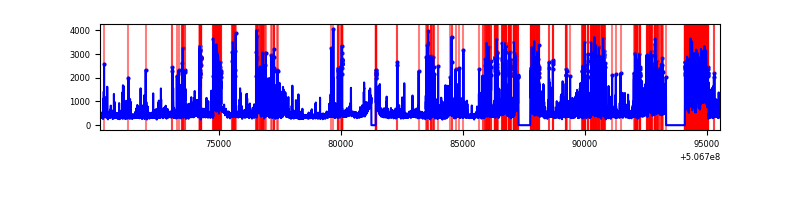 |
Top three noisy pixels from each quadrant. If the there are fewer than three noisy pixels in the level2.evt file, extra rows are filled as -1
| Pixel properties | Quadrant properties | ||||||
|---|---|---|---|---|---|---|---|
| Quadrant | DetID | PixID | Counts | Sigma | Mean | Median | Sigma |
| A | 15 | 32 | 2069760 | 3441.39 | 2413 | 2352 | 600.7 |
| A | 0 | 8 | 1325761 | 2202.94 | 2413 | 2352 | 600.7 |
| A | 12 | 115 | 1322878 | 2198.14 | 2413 | 2352 | 600.7 |
| B | 5 | 185 | 814907 | 1563.11 | 2435 | 2336 | 519.8 |
| B | 0 | 213 | 333375 | 636.81 | 2435 | 2336 | 519.8 |
| B | 10 | 247 | 142129 | 268.91 | 2435 | 2336 | 519.8 |
| C | 13 | 3 | 1637692 | 2488.57 | 2405 | 2383 | 657.1 |
| C | 6 | 223 | 346385 | 523.49 | 2405 | 2383 | 657.1 |
| C | 12 | 252 | 274587 | 414.23 | 2405 | 2383 | 657.1 |
| D | 11 | 129 | 2997795 | 4503.19 | 2360 | 2256 | 665.2 |
| D | 2 | 62 | 1325030 | 1988.53 | 2360 | 2256 | 665.2 |
| D | 3 | 12 | 722624 | 1082.93 | 2360 | 2256 | 665.2 |
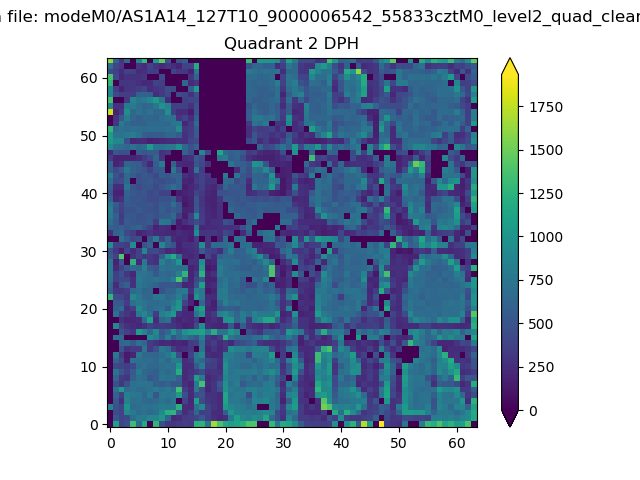
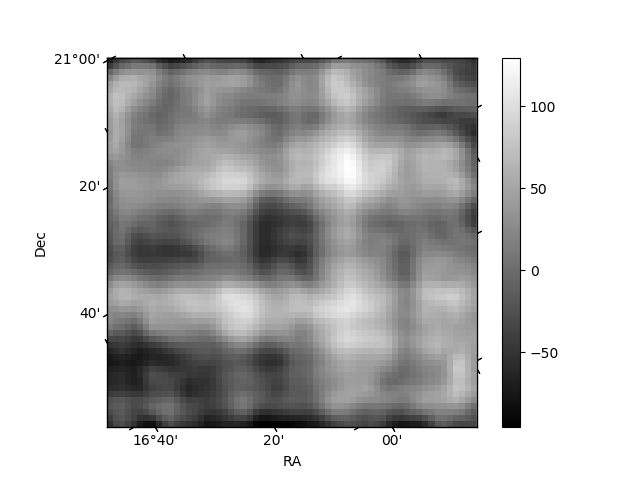
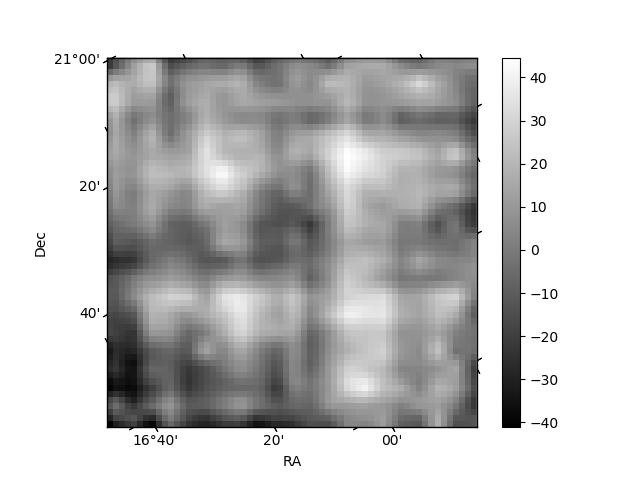
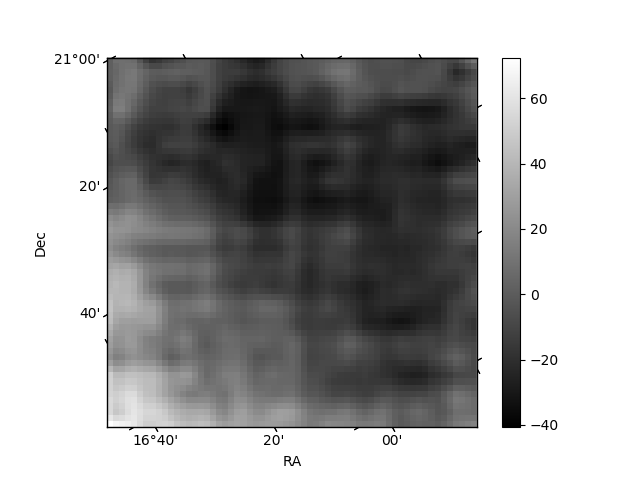
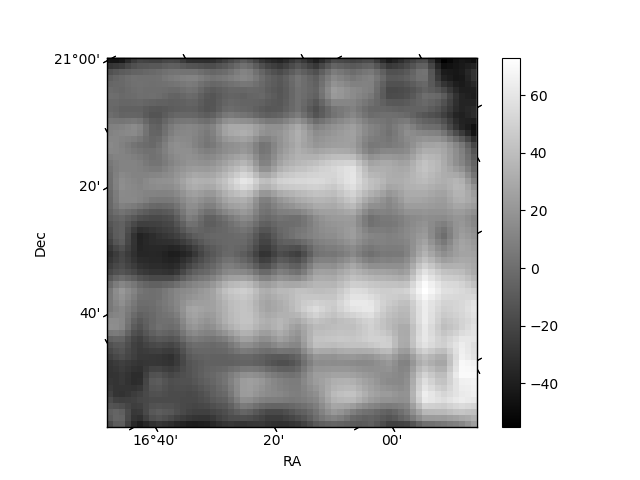
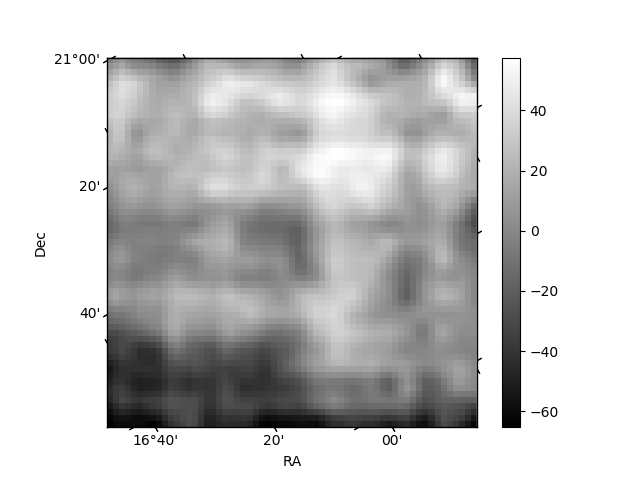
Histogram calculated using DETX and DETY for each event in the final _common_clean file
| Quadrant A | 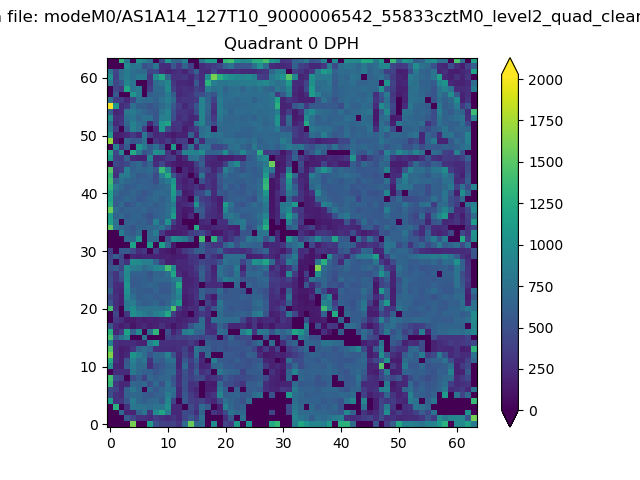 |
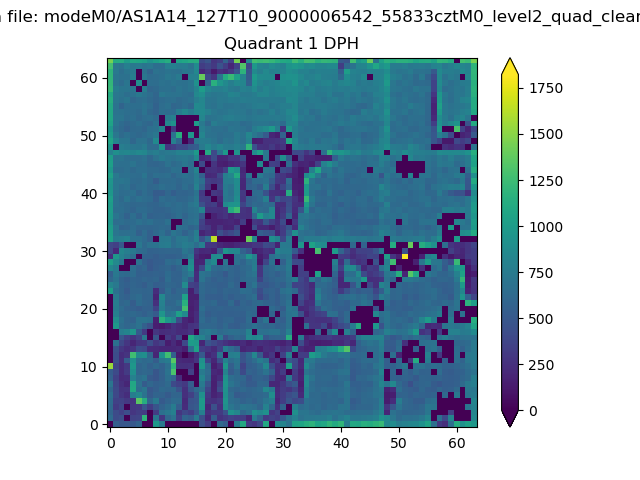 |
Quadrant B |
|---|---|---|---|
| Quadrant D | 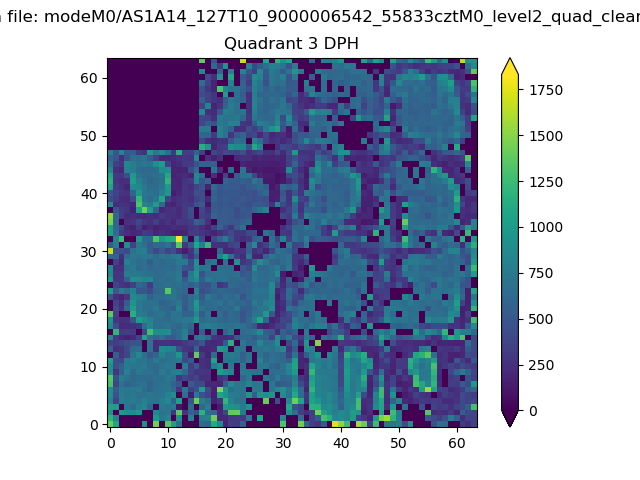 |
 |
Quadrant C |
| Plot type | Count rate plots | Images |
|---|---|---|
| Comparison with Poisson distribution Blue bars denote a histogram of data divided into 1 sec bins. Red curve is a Poisson curve with rate = median count rate of data. |
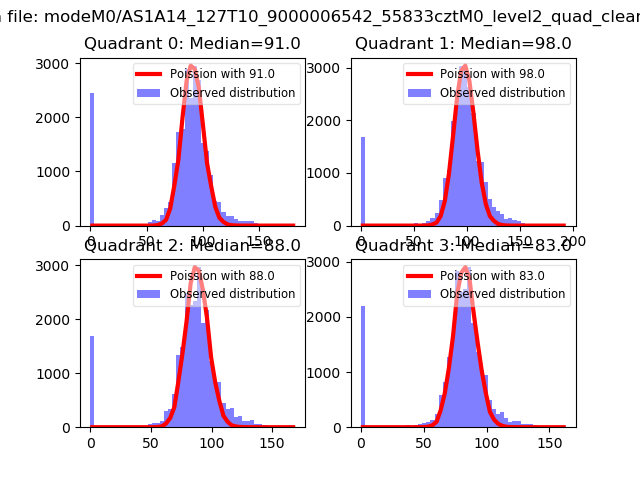 |
 |
| Quadrant-wise count rates Data is divided into 100 sec bins |
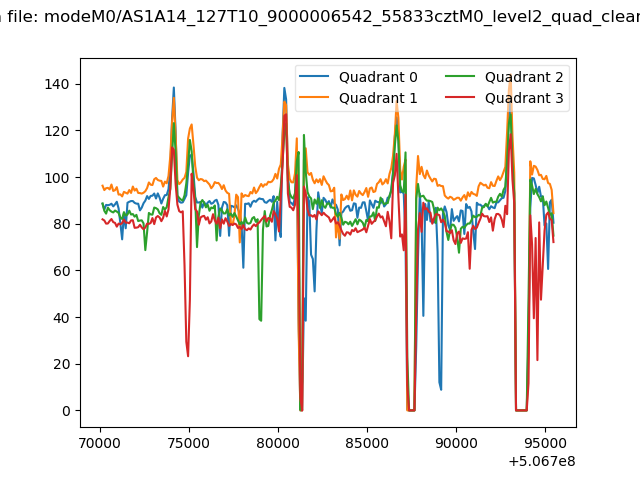 |
|
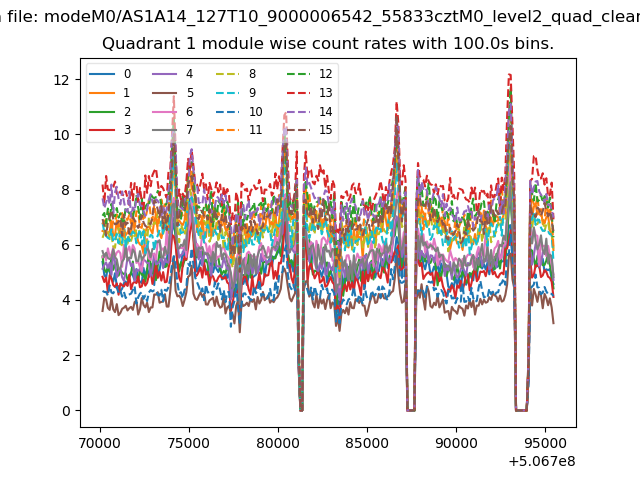
| Module-wise count rates for Quadrant A Data is divided into 100 sec bins |
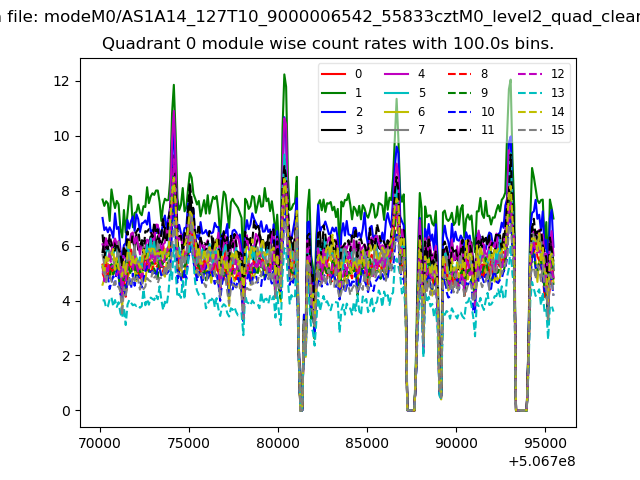 |
 |
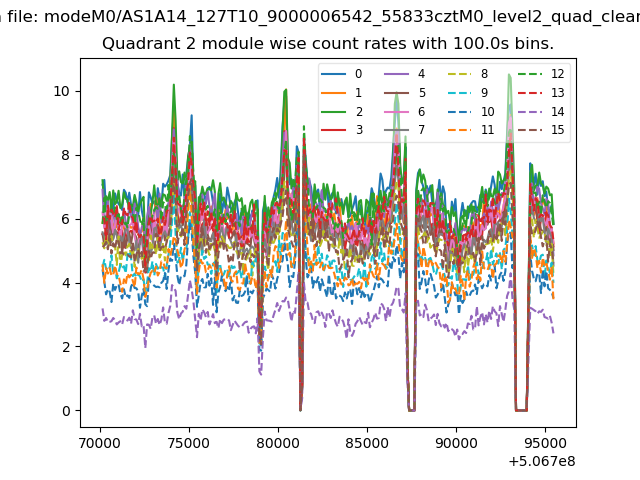
| Module-wise count rates for Quadrant B Data is divided into 100 sec bins |
 |
 |
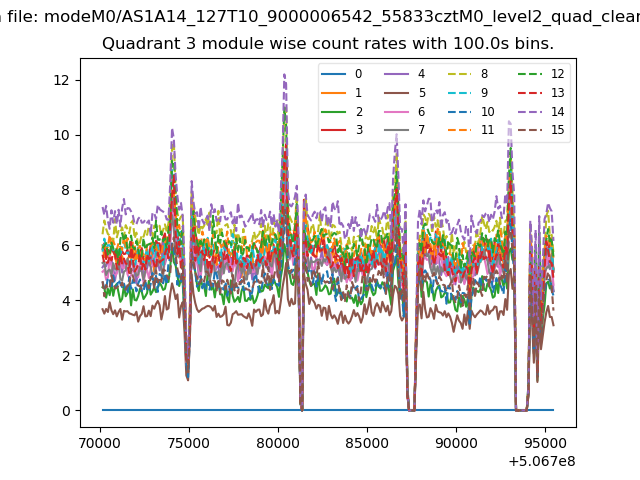
| Module-wise count rates for Quadrant C Data is divided into 100 sec bins |
 |
 |
| Module-wise count rates for Quadrant D Data is divided into 100 sec bins |
 |
 |
| Parameter | Plot |
|---|---|
| CZT HV Monitor | 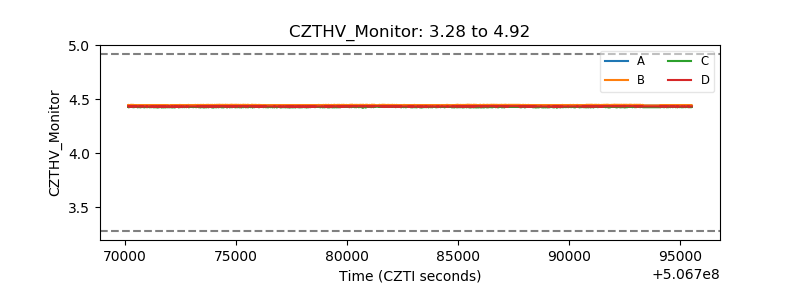 |
| D_VDD | 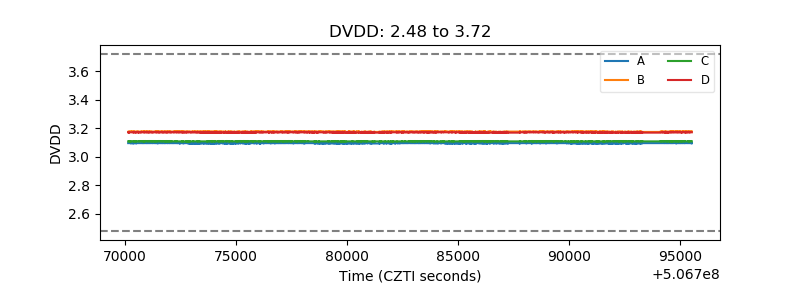 |
| Temperature 1 | 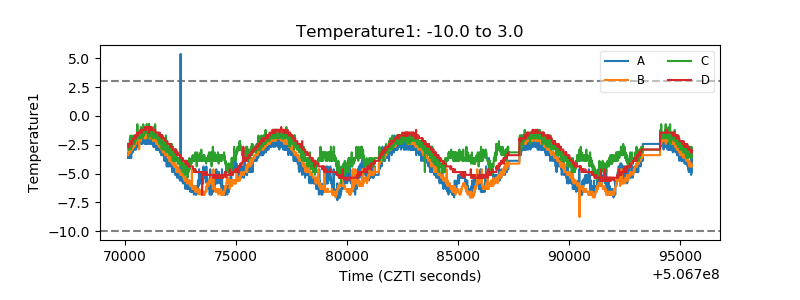 |
| Veto HV Monitor |  |
| Veto LLD | 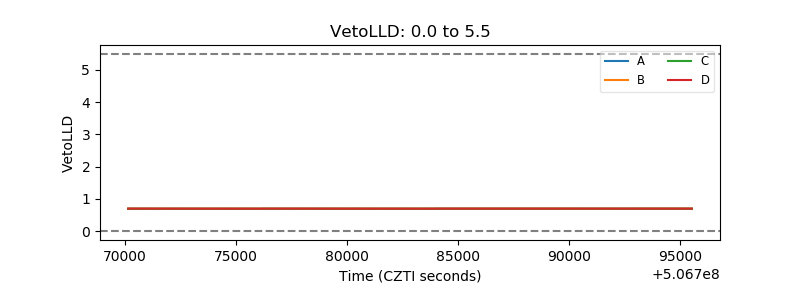 |
| Alpha Counter | 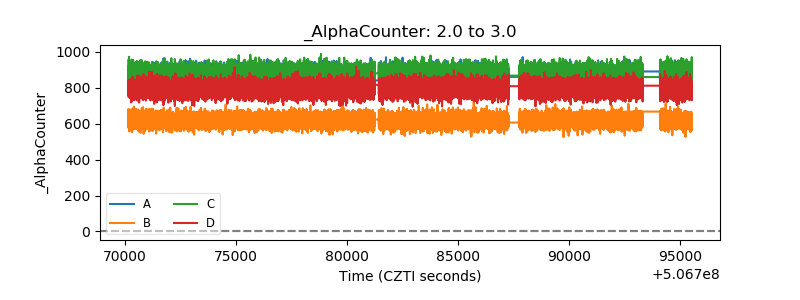 |
| _CPM_Rate | 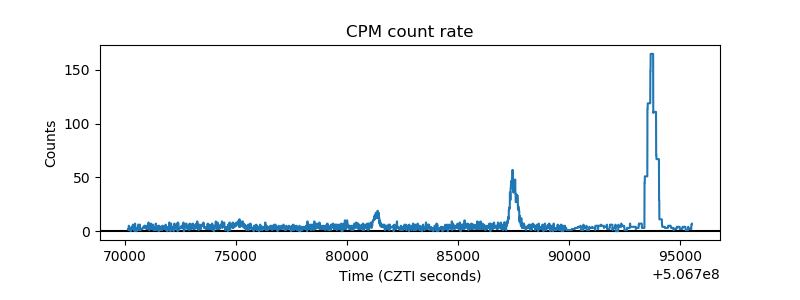 |
| CZT Counter | 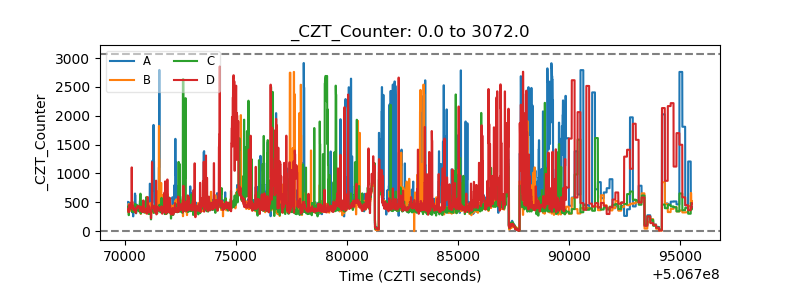 |
| +2.5 Volts monitor | 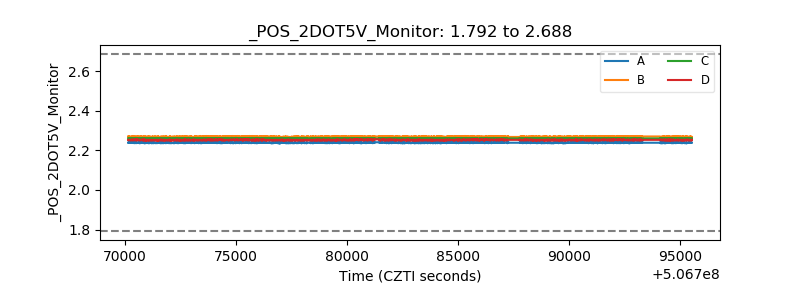 |
| +5 Volts monitor | 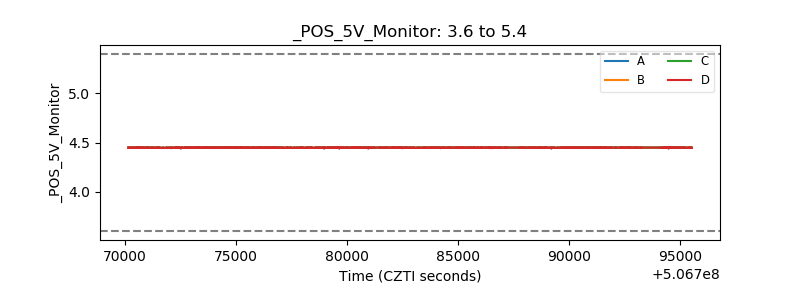 |
| _ROLL_ROT | 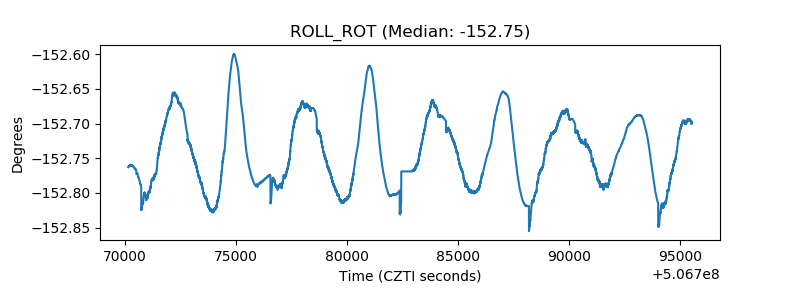 |
| _Roll_DEC | 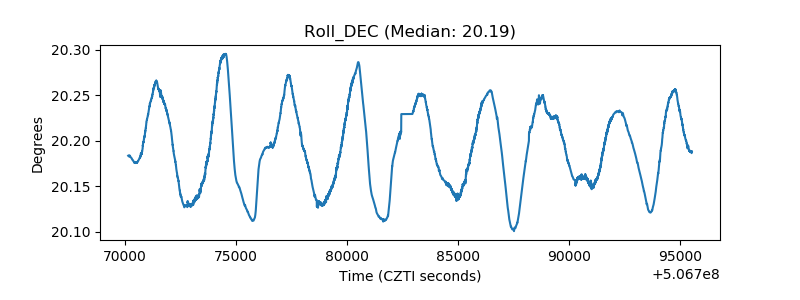 |
| _Roll_RA | 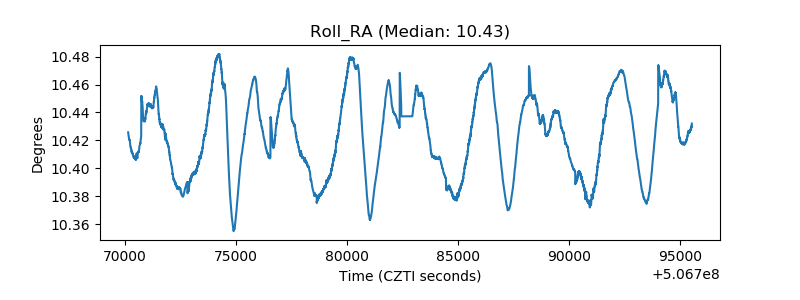 |
| Veto Counter | 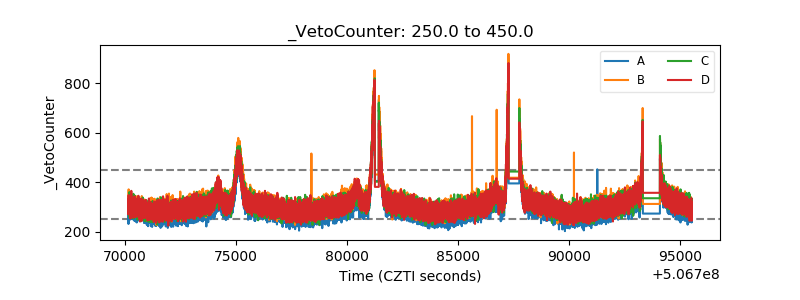 |