| Param | Original file | Final file |
|---|---|---|
| Filename | modeM0/AS1A14_127T10_9000006542_55834cztM0_level2.fits | modeM0/AS1A14_127T10_9000006542_55834cztM0_level2_quad_clean.evt |
| Size (bytes) | 441,866,880 | 97,845,120 |
| Size | 421.4 MB | 93.3 MB |
| Events in quadrant A | 3,731,880 | 635,758 |
| Events in quadrant B | 3,015,727 | 690,361 |
| Events in quadrant C | 3,012,033 | 618,138 |
| Events in quadrant D | 6,064,740 | 541,961 |
| Mode M0 | |||
|---|---|---|---|
| Quadrant | BADHDUFLAG | Total packets | Discarded packets |
| A | 0 | 15892 | 2 |
| B | 0 | 14448 | 2 |
| C | 0 | 14432 | 2 |
| D | 0 | 22925 | 2 |
| Mode M9 | |||
|---|---|---|---|
| Quadrant | BADHDUFLAG | Total packets | Discarded packets |
| A | 0 | 10 | 0 |
| B | 0 | 10 | 0 |
| C | 0 | 10 | 0 |
| D | 0 | 10 | 0 |
| Mode SS | |||
|---|---|---|---|
| Quadrant | BADHDUFLAG | Total packets | Discarded packets |
| A | 0 | 138 | 0 |
| B | 0 | 138 | 0 |
| C | 0 | 138 | 0 |
| D | 0 | 138 | 0 |
| Quadrant | Total seconds | Saturated seconds | Saturation percentage |
|---|---|---|---|
| A | 6840 | 169 | 2.470760% |
| B | 6840 | 61 | 0.891813% |
| C | 6840 | 32 | 0.467836% |
| D | 6840 | 688 | 10.058480% |
Noise dominated data is calculated using 1-second bins in cleaned event files. If a bin has >2000 counts, and if more than 50% of those come from <1% of pixels, then it is considered to be noise-dominated and hence unusable.
| Quadrant | # 1 sec bins | Bins with >0 counts | Bins with >2000 counts | High rate bins dominated by noise | Noise dominated (total time) | Noise dominated (detector-on time) | Marked lightcurve |
|---|---|---|---|---|---|---|---|
| A | 7795 | 6841 | 135 | 135 | 1.73% | 1.97% | 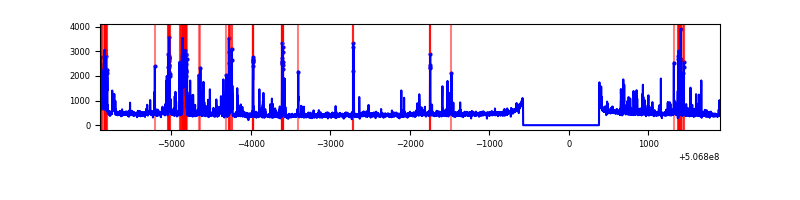 |
| B | 7795 | 6841 | 29 | 29 | 0.37% | 0.42% | 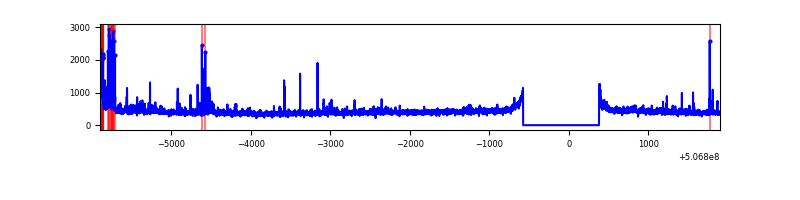 |
| C | 7795 | 6841 | 24 | 24 | 0.31% | 0.35% | 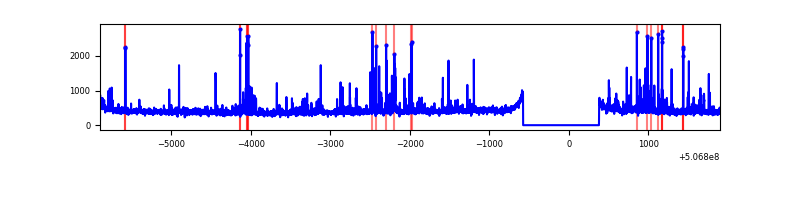 |
| D | 7795 | 6840 | 658 | 658 | 8.44% | 9.62% | 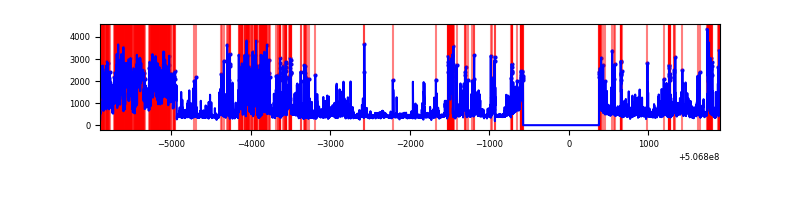 |
Top three noisy pixels from each quadrant. If the there are fewer than three noisy pixels in the level2.evt file, extra rows are filled as -1
| Pixel properties | Quadrant properties | ||||||
|---|---|---|---|---|---|---|---|
| Quadrant | DetID | PixID | Counts | Sigma | Mean | Median | Sigma |
| A | 15 | 32 | 495308 | 2854.2 | 688 | 671 | 173.3 |
| A | 8 | 192 | 209709 | 1206.21 | 688 | 671 | 173.3 |
| A | 0 | 8 | 132820 | 762.54 | 688 | 671 | 173.3 |
| B | 5 | 185 | 155681 | 1045.64 | 686 | 661 | 148.3 |
| B | 0 | 213 | 68333 | 456.46 | 686 | 661 | 148.3 |
| B | 10 | 247 | 44223 | 293.83 | 686 | 661 | 148.3 |
| C | 13 | 3 | 130765 | 686.98 | 681 | 677 | 189.4 |
| C | 12 | 250 | 72813 | 380.94 | 681 | 677 | 189.4 |
| C | 6 | 223 | 70703 | 369.8 | 681 | 677 | 189.4 |
| D | 11 | 129 | 2113415 | 11428.13 | 650 | 623 | 184.9 |
| D | 2 | 62 | 825982 | 4464.38 | 650 | 623 | 184.9 |
| D | 2 | 249 | 192855 | 1039.79 | 650 | 623 | 184.9 |
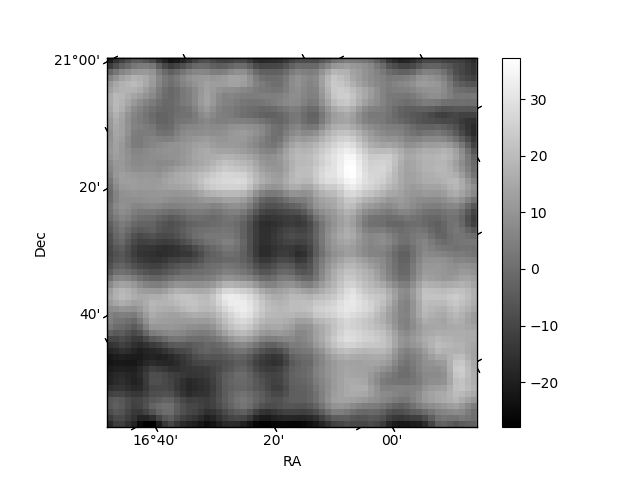
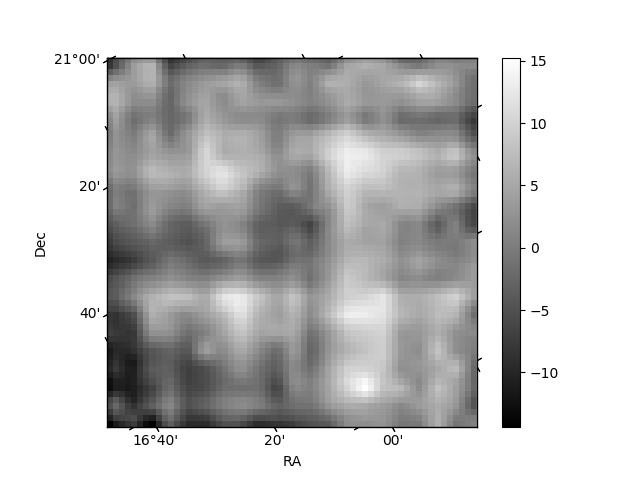
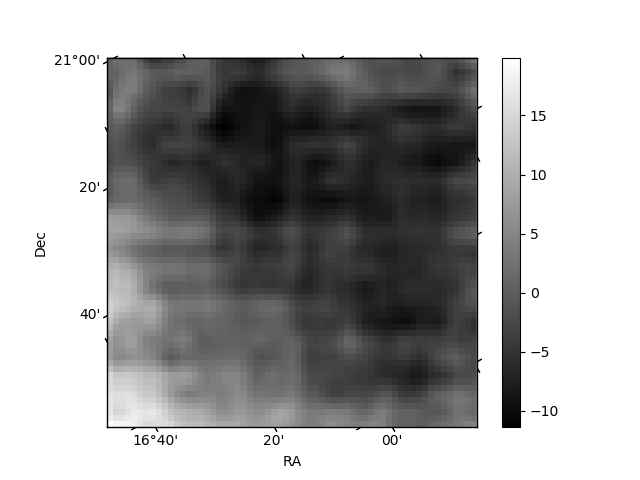
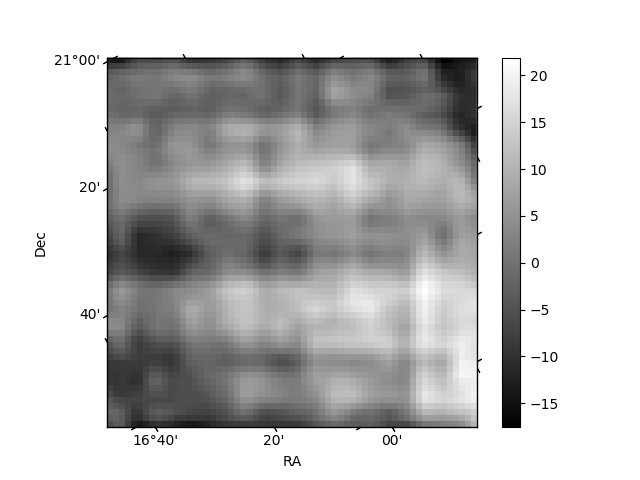
Histogram calculated using DETX and DETY for each event in the final _common_clean file
| Quadrant A | 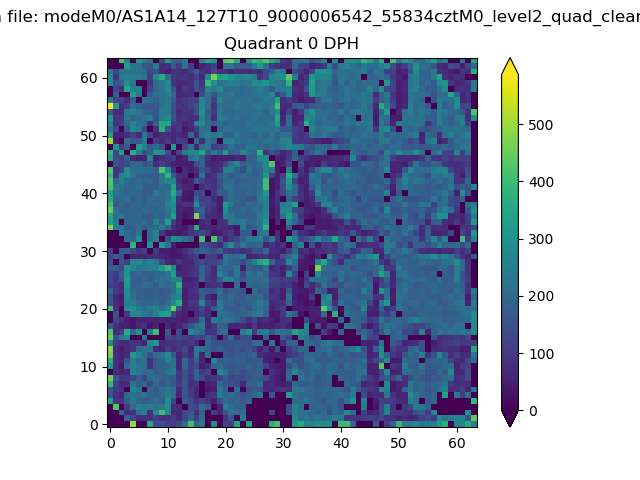 |
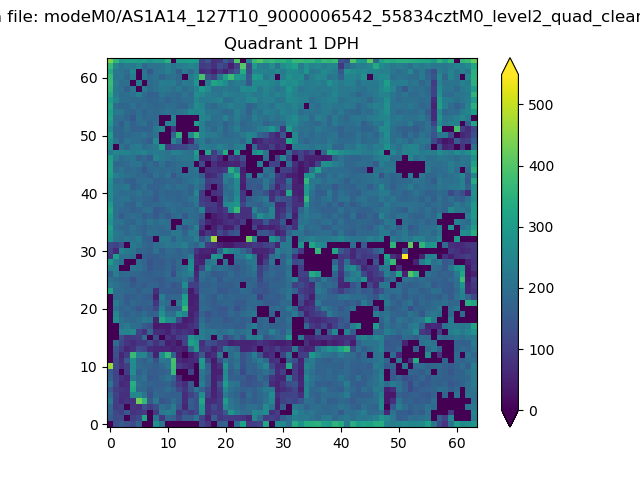 |
Quadrant B |
|---|---|---|---|
| Quadrant D | 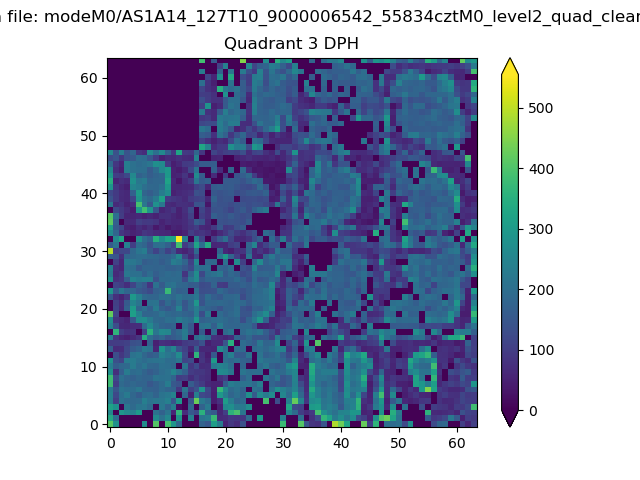 |
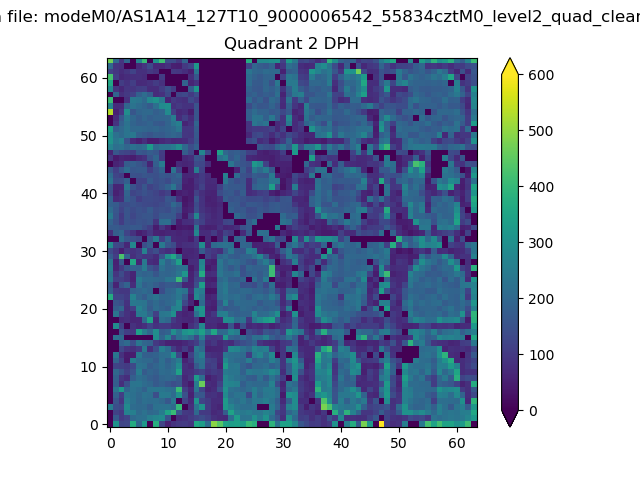 |
Quadrant C |
| Plot type | Count rate plots | Images |
|---|---|---|
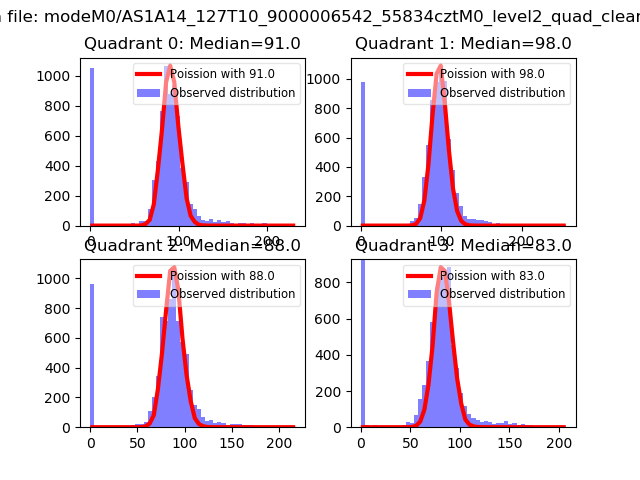
| Comparison with Poisson distribution Blue bars denote a histogram of data divided into 1 sec bins. Red curve is a Poisson curve with rate = median count rate of data. |
 |
 |
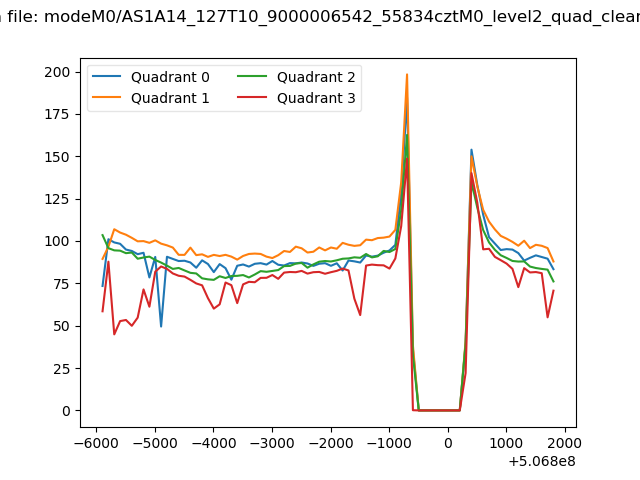
| Quadrant-wise count rates Data is divided into 100 sec bins |
 |
|
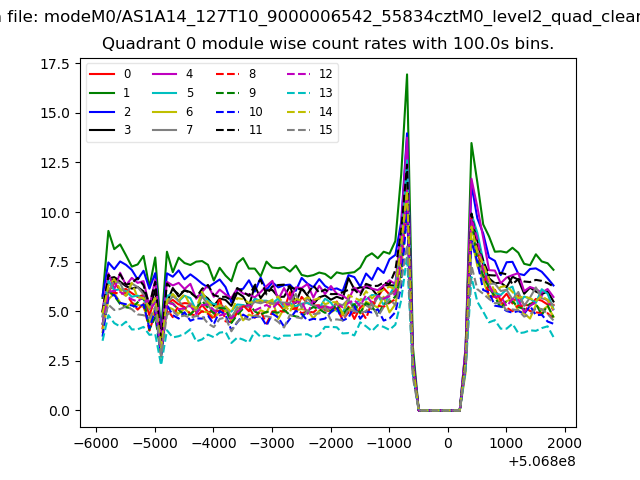
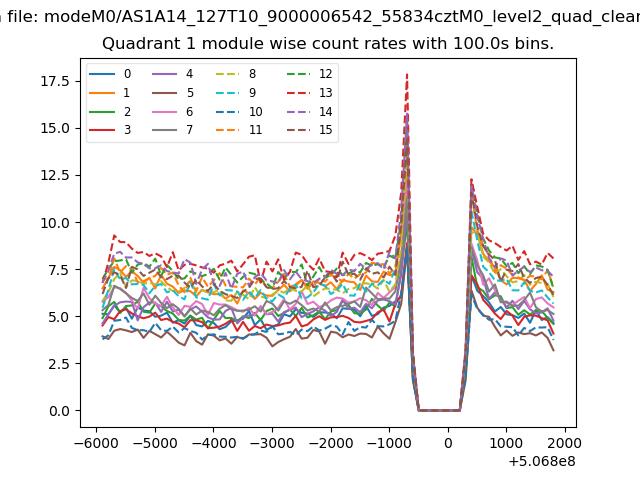
| Module-wise count rates for Quadrant A Data is divided into 100 sec bins |
 |
 |
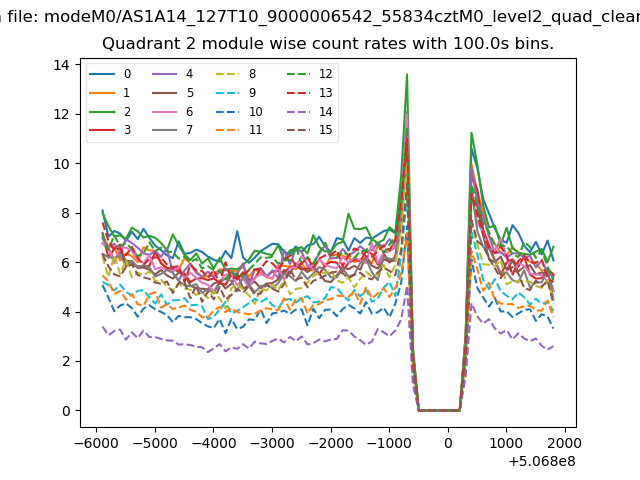
| Module-wise count rates for Quadrant B Data is divided into 100 sec bins |
 |
 |
| Module-wise count rates for Quadrant C Data is divided into 100 sec bins |
 |
 |
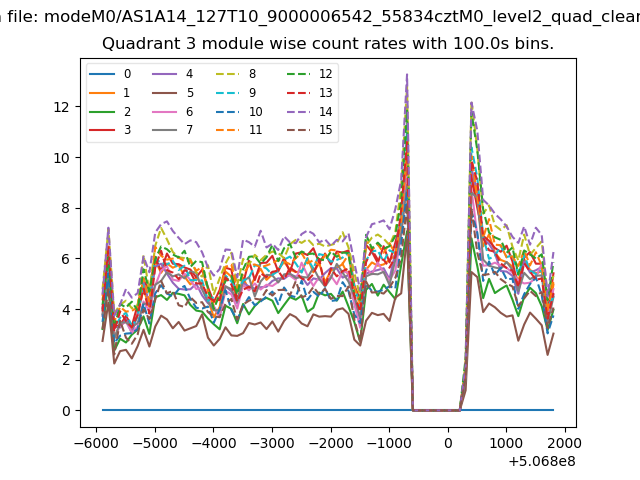
| Module-wise count rates for Quadrant D Data is divided into 100 sec bins |
 |
 |
| Parameter | Plot |
|---|---|
| CZT HV Monitor | 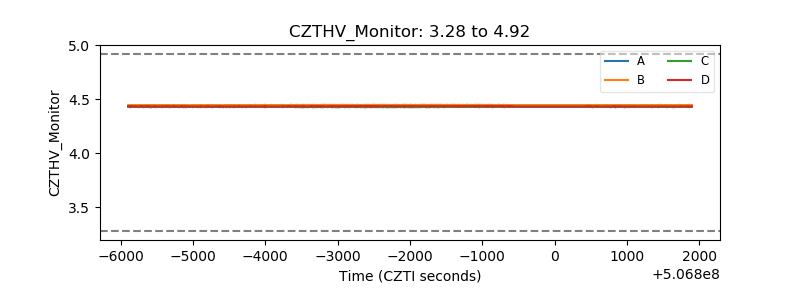 |
| D_VDD | 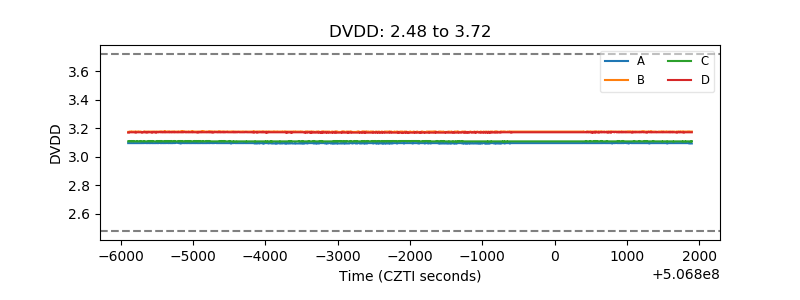 |
| Temperature 1 | 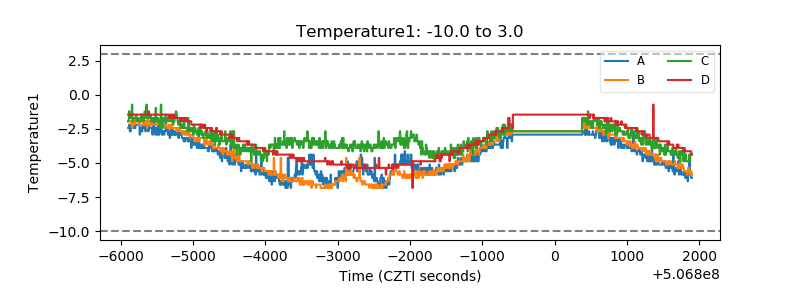 |
| Veto HV Monitor | 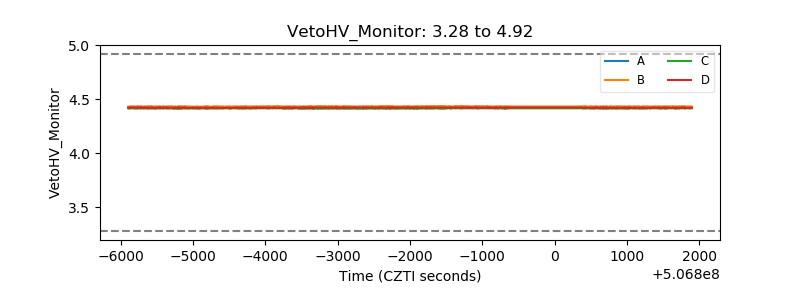 |
| Veto LLD | 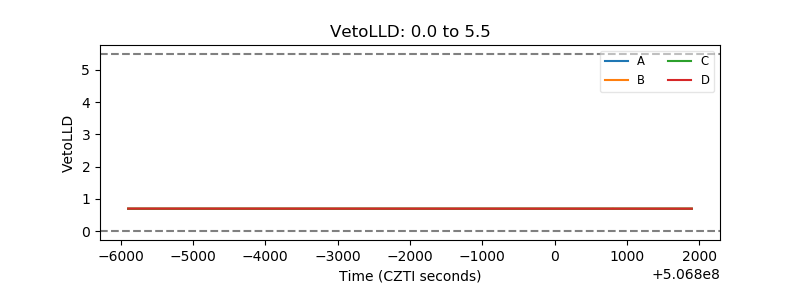 |
| Alpha Counter | 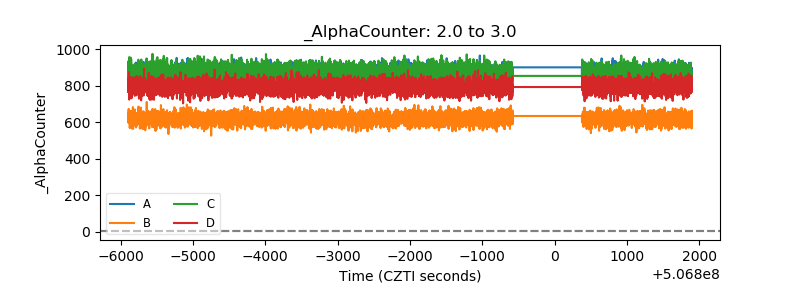 |
| _CPM_Rate | 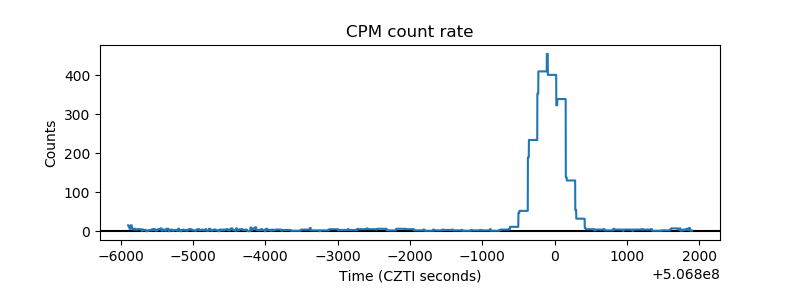 |
| CZT Counter | 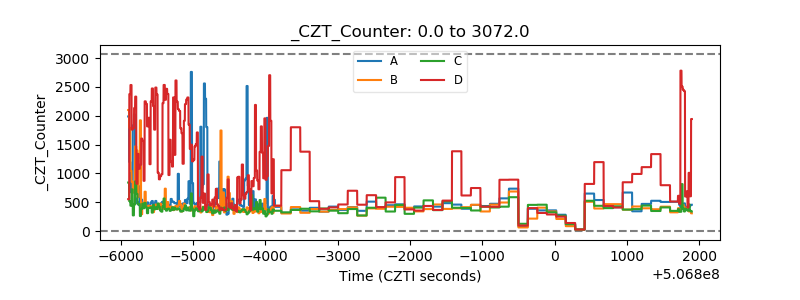 |
| +2.5 Volts monitor | 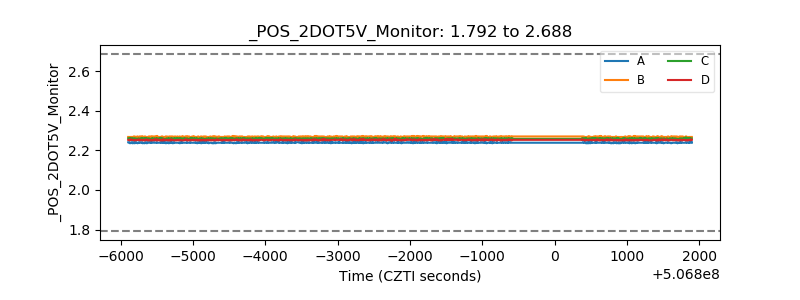 |
| +5 Volts monitor | 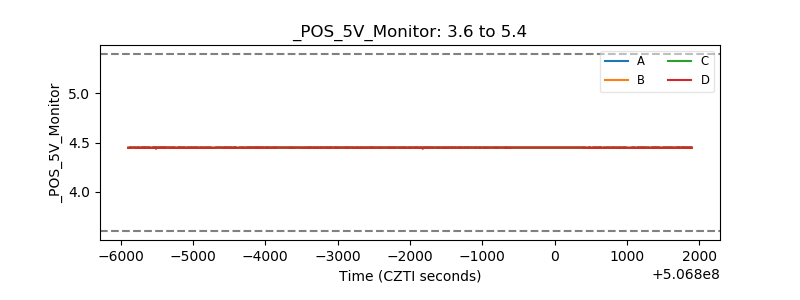 |
| _ROLL_ROT | 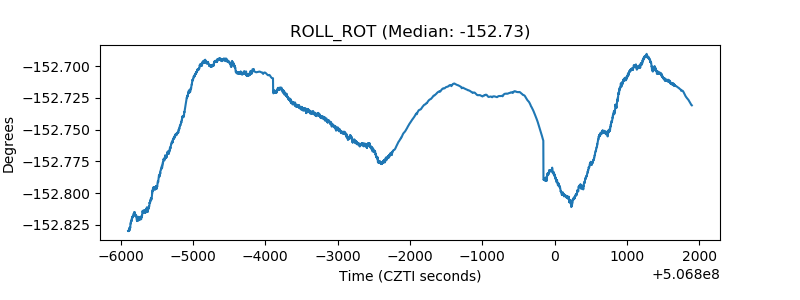 |
| _Roll_DEC | 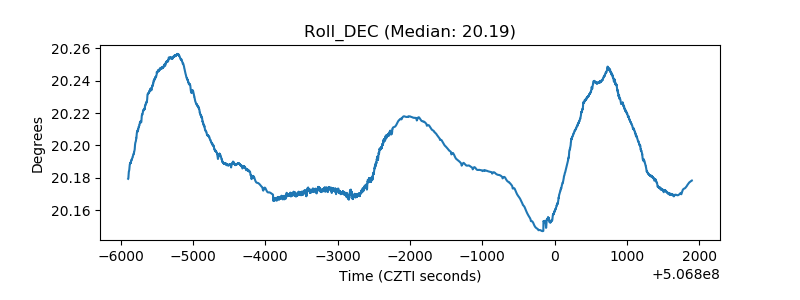 |
| _Roll_RA | 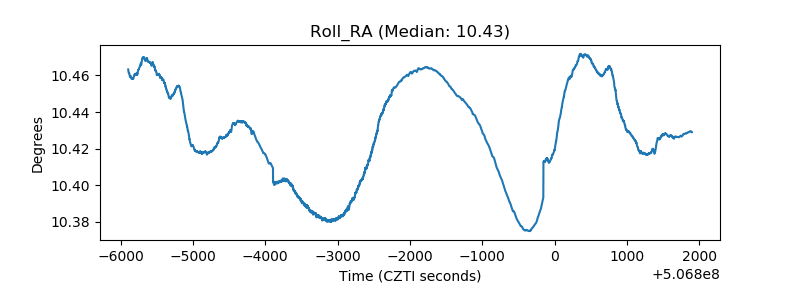 |
| Veto Counter | 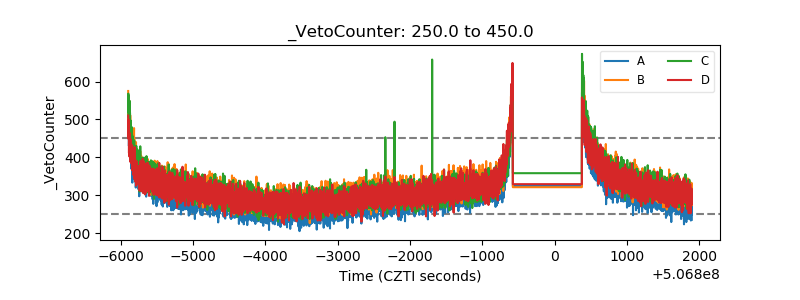 |