| Param | Original file | Final file |
|---|---|---|
| Filename | modeM0/AS1A14_127T10_9000006542_55838cztM0_level2.fits | modeM0/AS1A14_127T10_9000006542_55838cztM0_level2_quad_clean.evt |
| Size (bytes) | 592,384,320 | 94,176,000 |
| Size | 564.9 MB | 89.8 MB |
| Events in quadrant A | 8,273,182 | 561,591 |
| Events in quadrant B | 3,029,315 | 697,984 |
| Events in quadrant C | 2,825,286 | 622,476 |
| Events in quadrant D | 7,285,572 | 506,387 |
| Mode M0 | |||
|---|---|---|---|
| Quadrant | BADHDUFLAG | Total packets | Discarded packets |
| A | 0 | 29117 | 2 |
| B | 0 | 13919 | 2 |
| C | 0 | 13616 | 2 |
| D | 0 | 26291 | 3 |
| Mode M9 | |||
|---|---|---|---|
| Quadrant | BADHDUFLAG | Total packets | Discarded packets |
| A | 0 | 15 | 0 |
| B | 0 | 16 | 0 |
| C | 0 | 16 | 0 |
| D | 0 | 16 | 0 |
| Mode SS | |||
|---|---|---|---|
| Quadrant | BADHDUFLAG | Total packets | Discarded packets |
| A | 0 | 136 | 0 |
| B | 0 | 136 | 0 |
| C | 0 | 136 | 0 |
| D | 0 | 136 | 0 |
| Quadrant | Total seconds | Saturated seconds | Saturation percentage |
|---|---|---|---|
| A | 6639 | 1143 | 17.216448% |
| B | 6639 | 30 | 0.451875% |
| C | 6639 | 29 | 0.436813% |
| D | 6638 | 1050 | 15.818017% |
Noise dominated data is calculated using 1-second bins in cleaned event files. If a bin has >2000 counts, and if more than 50% of those come from <1% of pixels, then it is considered to be noise-dominated and hence unusable.
| Quadrant | # 1 sec bins | Bins with >0 counts | Bins with >2000 counts | High rate bins dominated by noise | Noise dominated (total time) | Noise dominated (detector-on time) | Marked lightcurve |
|---|---|---|---|---|---|---|---|
| A | 7859 | 6640 | 1213 | 1213 | 15.43% | 18.27% | 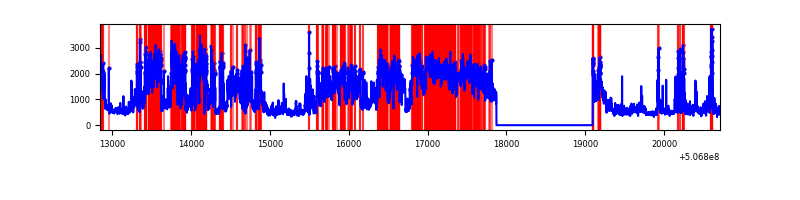 |
| B | 7859 | 6640 | 1 | 1 | 0.01% | 0.02% | 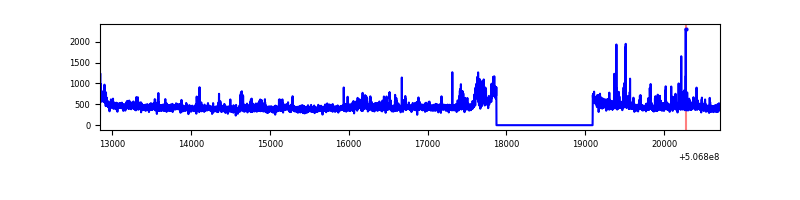 |
| C | 7859 | 6640 | 14 | 14 | 0.18% | 0.21% | 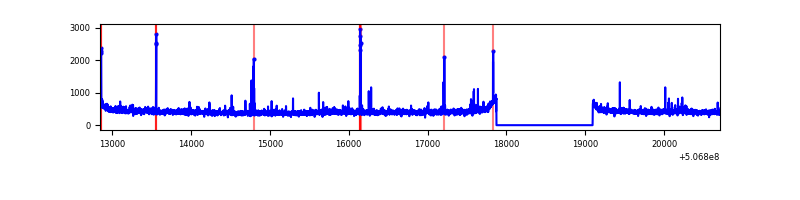 |
| D | 7858 | 6638 | 1009 | 1009 | 12.84% | 15.20% | 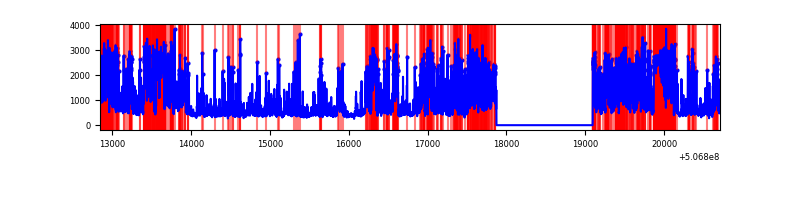 |
Top three noisy pixels from each quadrant. If the there are fewer than three noisy pixels in the level2.evt file, extra rows are filled as -1
| Pixel properties | Quadrant properties | ||||||
|---|---|---|---|---|---|---|---|
| Quadrant | DetID | PixID | Counts | Sigma | Mean | Median | Sigma |
| A | 12 | 115 | 4712594 | 28313.93 | 670 | 655 | 166.4 |
| A | 3 | 14 | 332150 | 1991.95 | 670 | 655 | 166.4 |
| A | 8 | 192 | 226510 | 1357.16 | 670 | 655 | 166.4 |
| B | 0 | 213 | 198230 | 1311.4 | 700 | 673 | 150.6 |
| B | 7 | 252 | 27461 | 177.82 | 700 | 673 | 150.6 |
| B | 12 | 111 | 17504 | 111.73 | 700 | 673 | 150.6 |
| C | 12 | 250 | 53603 | 277.4 | 691 | 685 | 190.8 |
| C | 13 | 3 | 24177 | 123.15 | 691 | 685 | 190.8 |
| C | 12 | 252 | 9254 | 44.92 | 691 | 685 | 190.8 |
| D | 11 | 129 | 3492557 | 19318.71 | 636 | 607 | 180.8 |
| D | 3 | 12 | 882239 | 4877.5 | 636 | 607 | 180.8 |
| D | 15 | 125 | 215079 | 1186.54 | 636 | 607 | 180.8 |
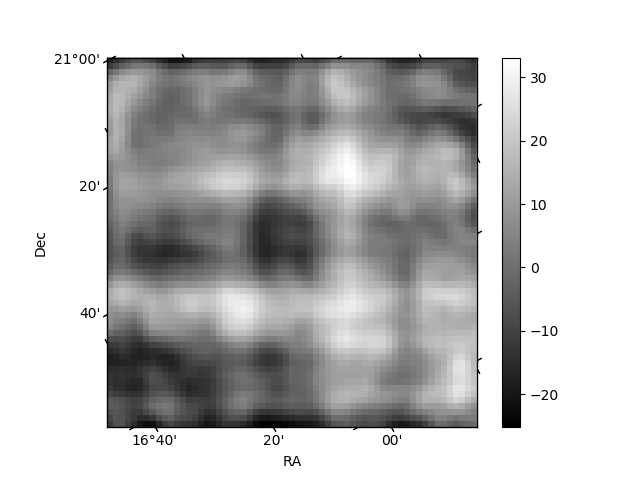
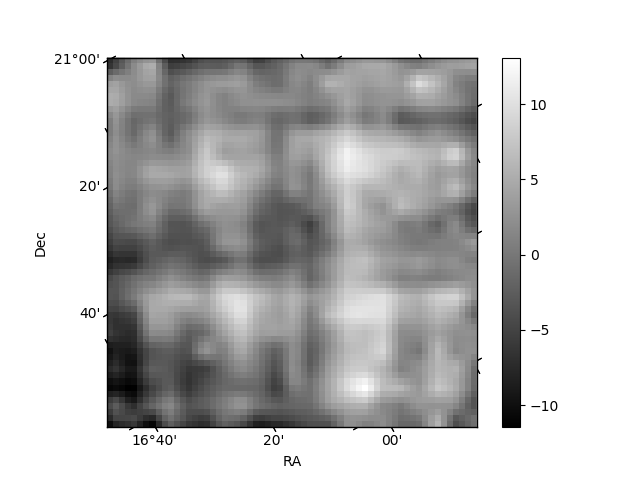
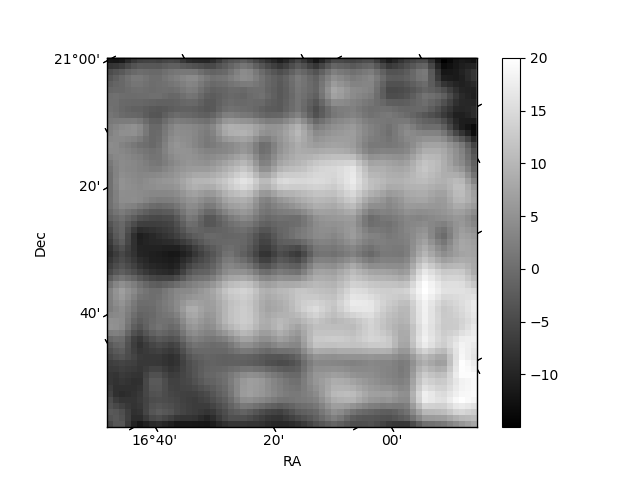
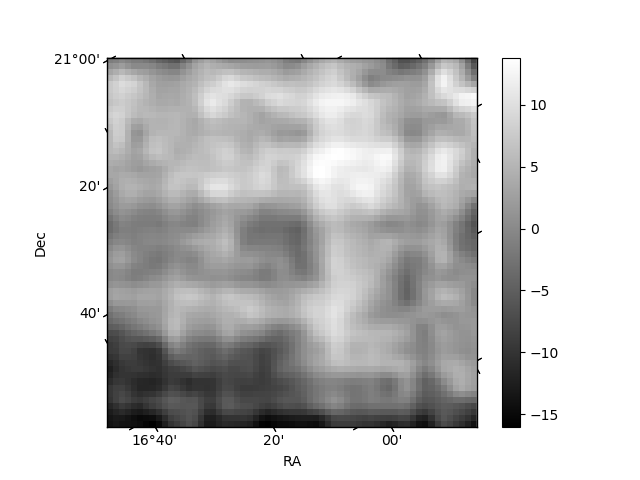
Histogram calculated using DETX and DETY for each event in the final _common_clean file
| Quadrant A | 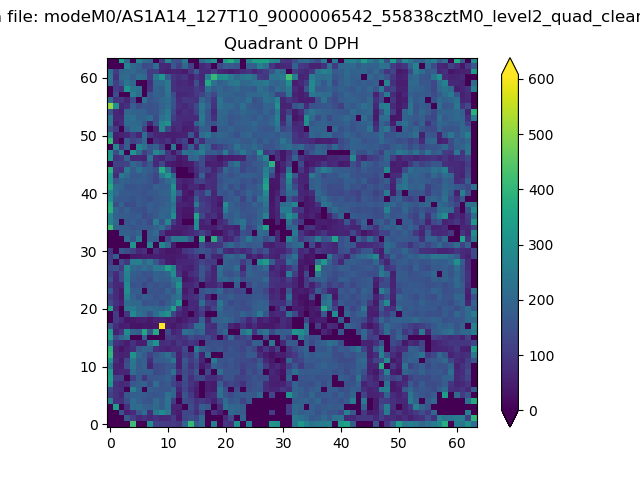 |
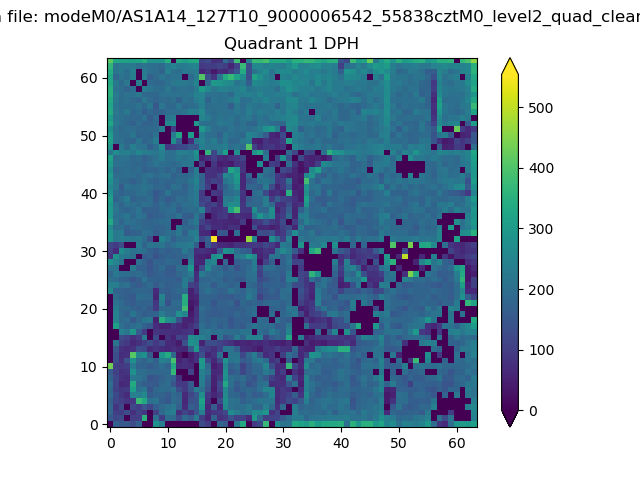 |
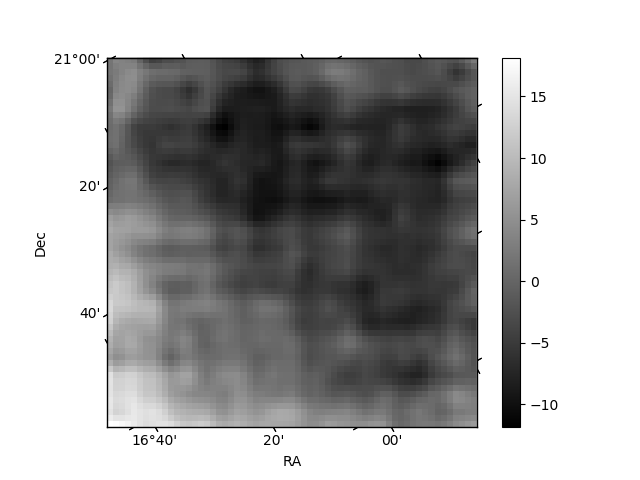
Quadrant B |
|---|---|---|---|
| Quadrant D | 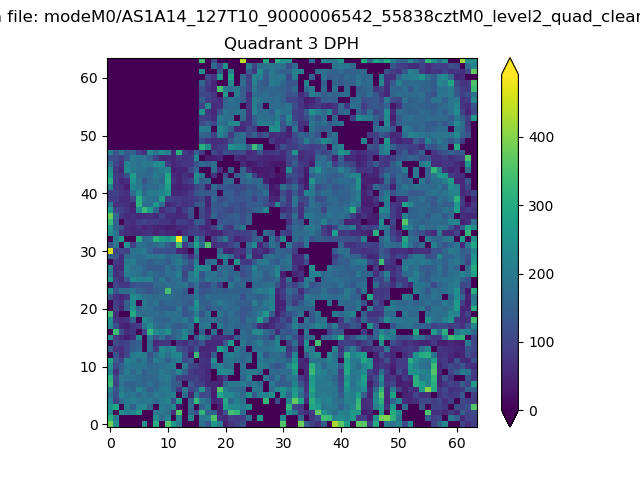 |
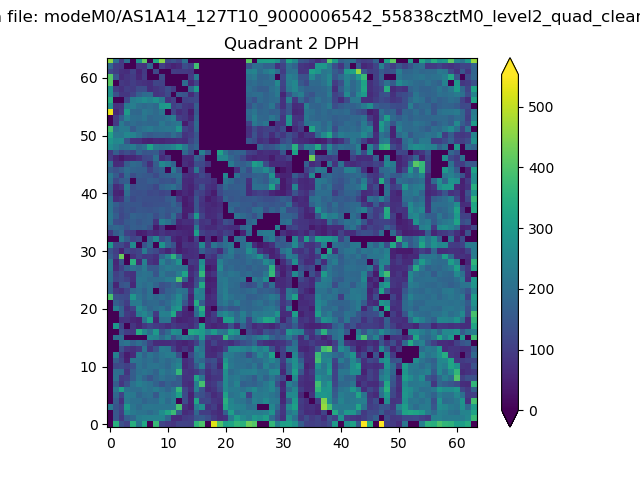 |
Quadrant C |
| Plot type | Count rate plots | Images |
|---|---|---|
| Comparison with Poisson distribution Blue bars denote a histogram of data divided into 1 sec bins. Red curve is a Poisson curve with rate = median count rate of data. |
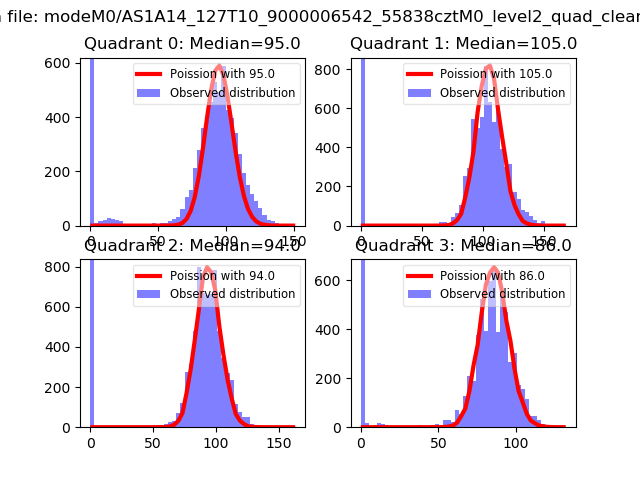 |
 |
| Quadrant-wise count rates Data is divided into 100 sec bins |
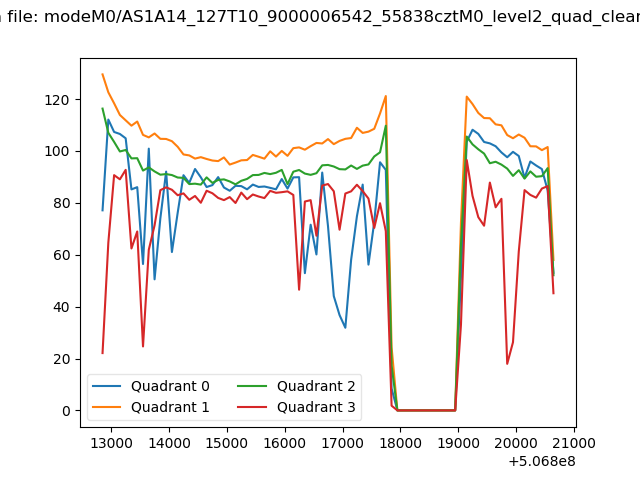 |
|
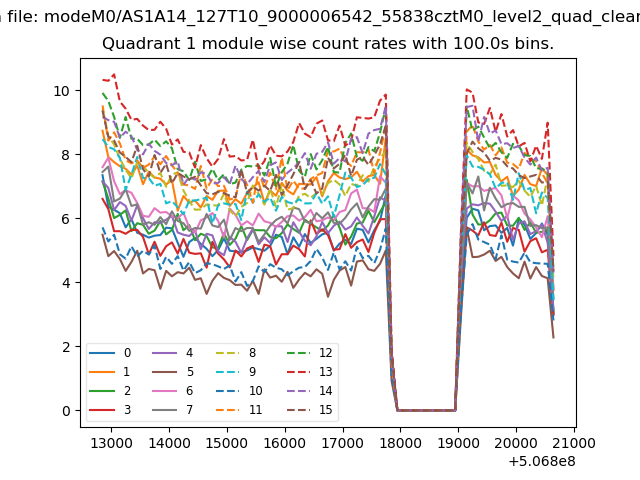
| Module-wise count rates for Quadrant A Data is divided into 100 sec bins |
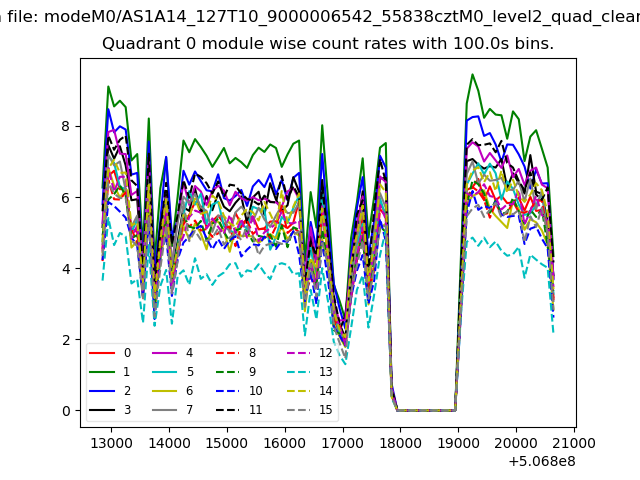 |
 |
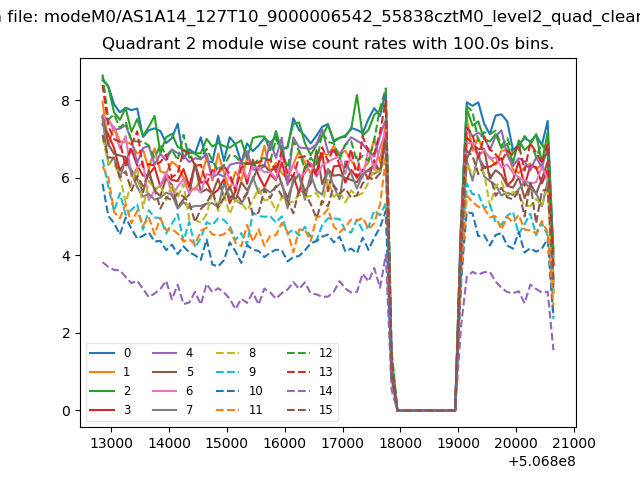
| Module-wise count rates for Quadrant B Data is divided into 100 sec bins |
 |
 |
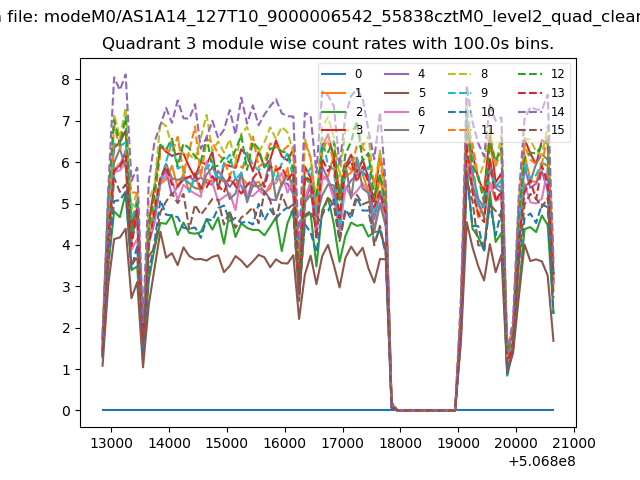
| Module-wise count rates for Quadrant C Data is divided into 100 sec bins |
 |
 |
| Module-wise count rates for Quadrant D Data is divided into 100 sec bins |
 |
 |
| Parameter | Plot |
|---|---|
| CZT HV Monitor | 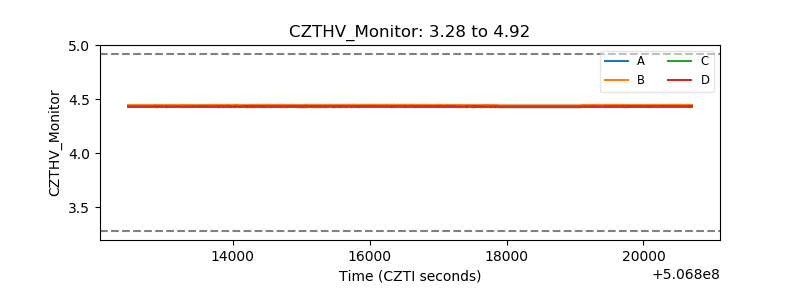 |
| D_VDD | 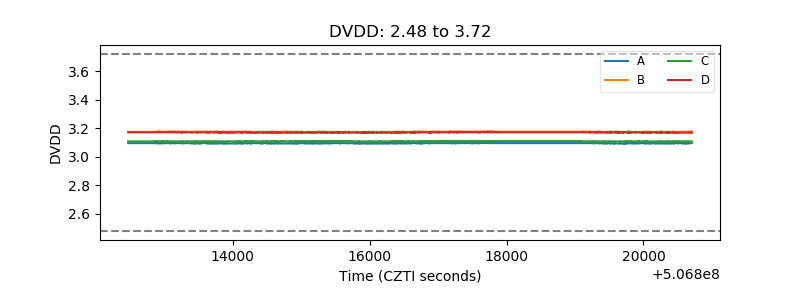 |
| Temperature 1 | 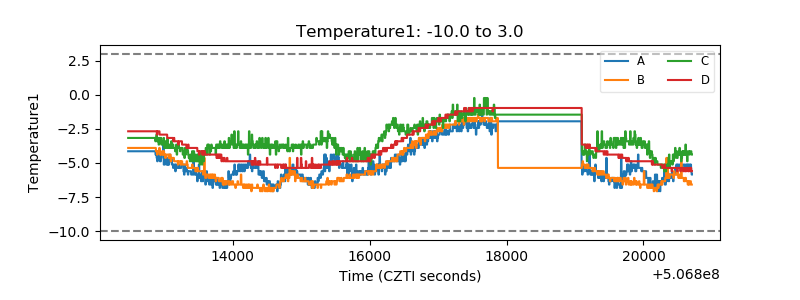 |
| Veto HV Monitor | 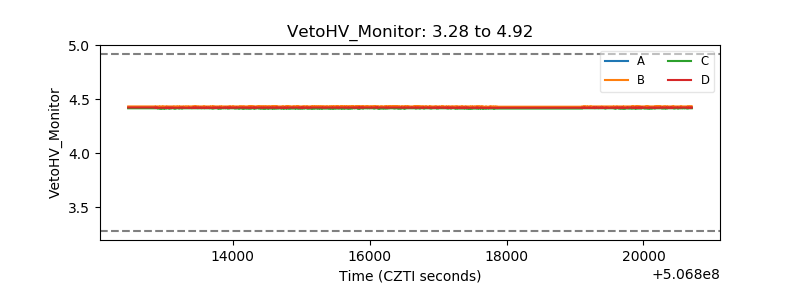 |
| Veto LLD | 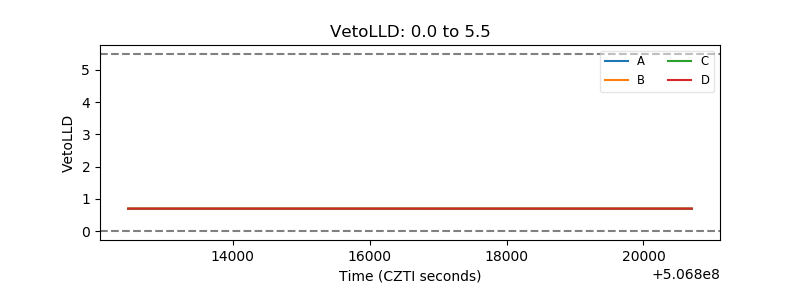 |
| Alpha Counter | 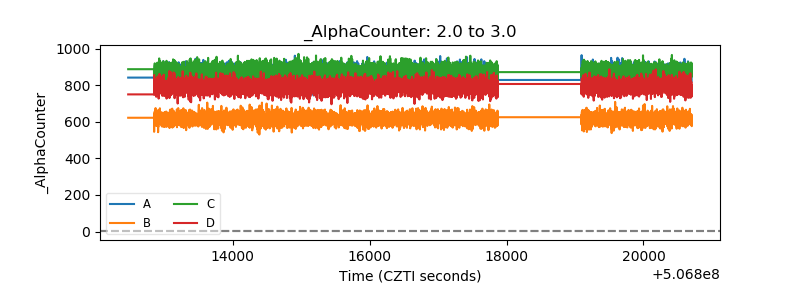 |
| _CPM_Rate | 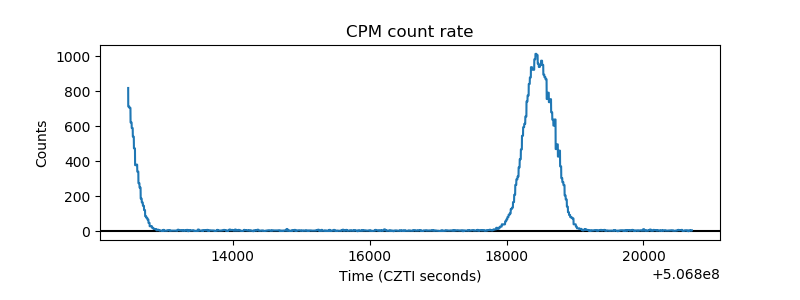 |
| CZT Counter | 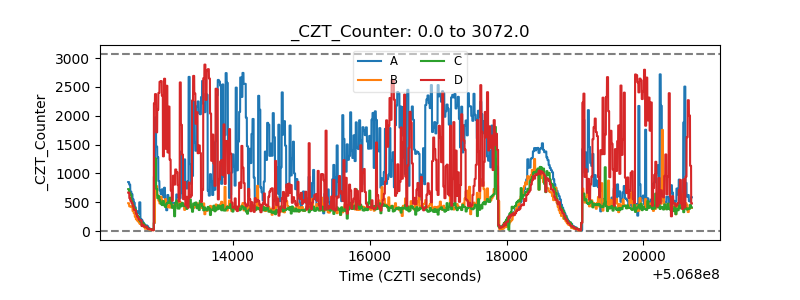 |
| +2.5 Volts monitor |  |
| +5 Volts monitor | 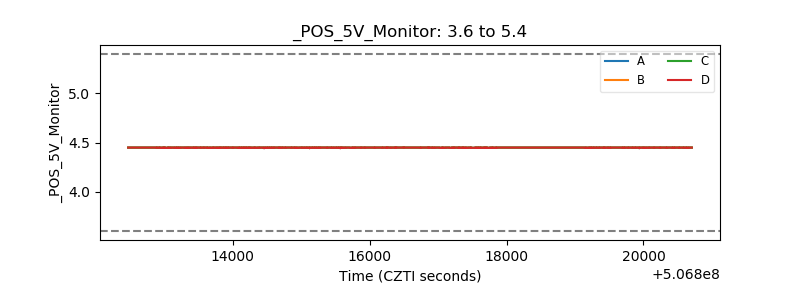 |
| _ROLL_ROT | 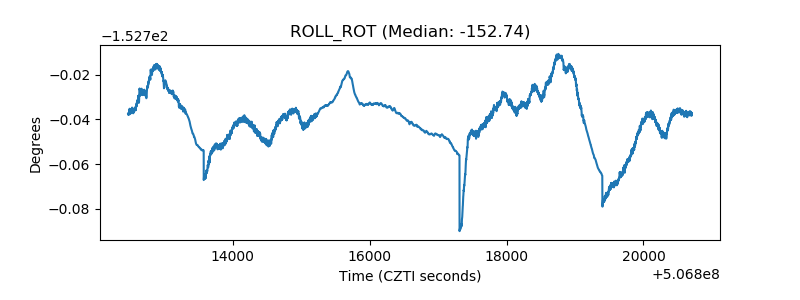 |
| _Roll_DEC | 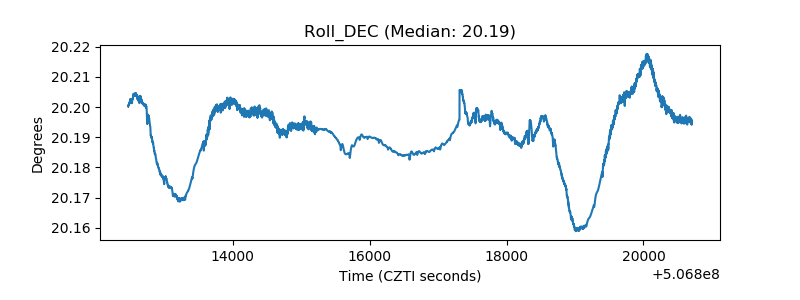 |
| _Roll_RA | 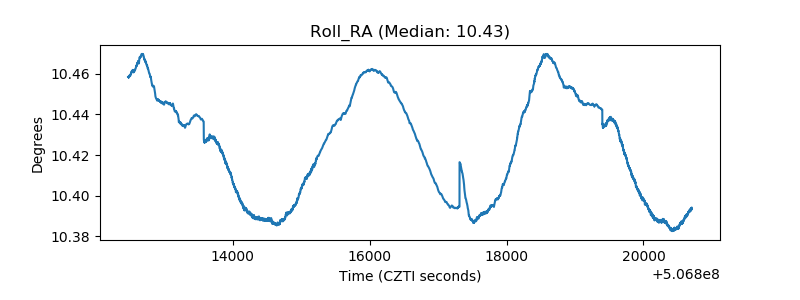 |
| Veto Counter | 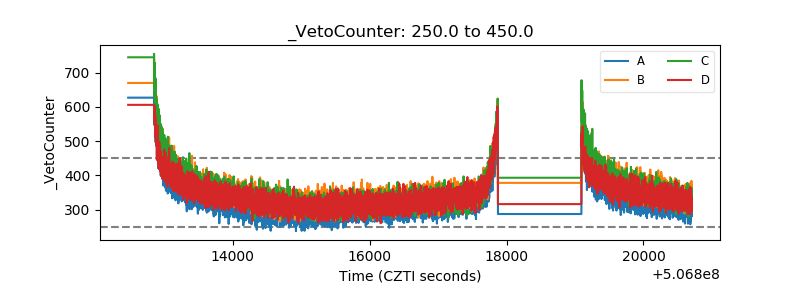 |