| Param | Original file | Final file |
|---|---|---|
| Filename | modeM0/AS1A14_127T10_9000006542_55839cztM0_level2.fits | modeM0/AS1A14_127T10_9000006542_55839cztM0_level2_quad_clean.evt |
| Size (bytes) | 549,898,560 | 95,382,720 |
| Size | 524.4 MB | 91.0 MB |
| Events in quadrant A | 6,034,508 | 575,453 |
| Events in quadrant B | 3,389,031 | 704,422 |
| Events in quadrant C | 2,874,757 | 633,508 |
| Events in quadrant D | 7,533,565 | 504,208 |
| Mode M0 | |||
|---|---|---|---|
| Quadrant | BADHDUFLAG | Total packets | Discarded packets |
| A | 0 | 22461 | 2 |
| B | 0 | 15006 | 2 |
| C | 0 | 13919 | 2 |
| D | 0 | 27065 | 2 |
| Mode M9 | |||
|---|---|---|---|
| Quadrant | BADHDUFLAG | Total packets | Discarded packets |
| A | 0 | 23 | 0 |
| B | 0 | 23 | 0 |
| C | 0 | 23 | 0 |
| D | 0 | 23 | 0 |
| Mode SS | |||
|---|---|---|---|
| Quadrant | BADHDUFLAG | Total packets | Discarded packets |
| A | 0 | 142 | 0 |
| B | 0 | 142 | 0 |
| C | 0 | 142 | 0 |
| D | 0 | 142 | 0 |
| Quadrant | Total seconds | Saturated seconds | Saturation percentage |
|---|---|---|---|
| A | 6741 | 878 | 13.024774% |
| B | 6742 | 117 | 1.735390% |
| C | 6742 | 34 | 0.504301% |
| D | 6742 | 1177 | 17.457728% |
Noise dominated data is calculated using 1-second bins in cleaned event files. If a bin has >2000 counts, and if more than 50% of those come from <1% of pixels, then it is considered to be noise-dominated and hence unusable.
| Quadrant | # 1 sec bins | Bins with >0 counts | Bins with >2000 counts | High rate bins dominated by noise | Noise dominated (total time) | Noise dominated (detector-on time) | Marked lightcurve |
|---|---|---|---|---|---|---|---|
| A | 9141 | 6742 | 739 | 739 | 8.08% | 10.96% | 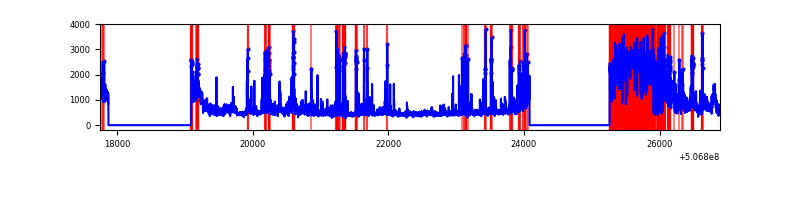 |
| B | 9142 | 6744 | 53 | 53 | 0.58% | 0.79% | 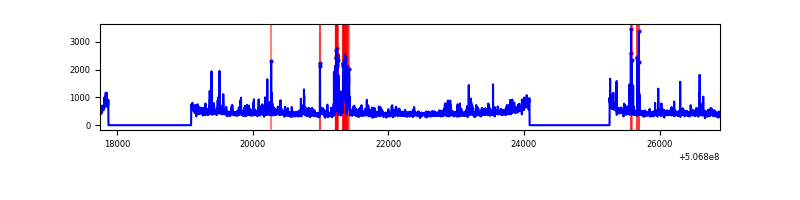 |
| C | 9142 | 6744 | 7 | 7 | 0.08% | 0.10% | 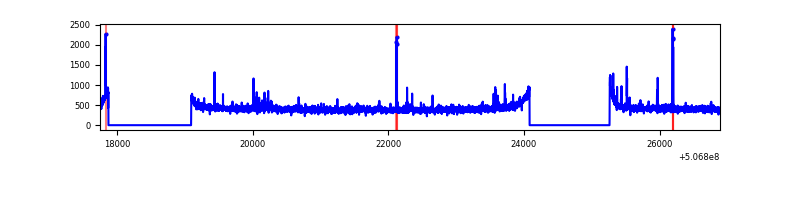 |
| D | 9142 | 6742 | 1035 | 1035 | 11.32% | 15.35% | 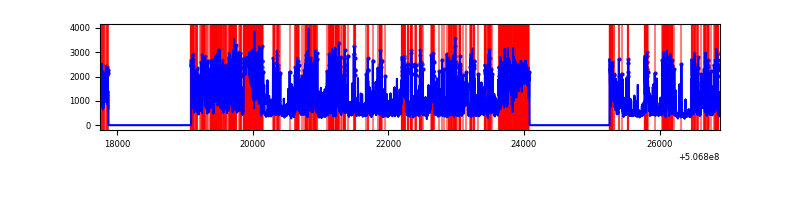 |
Top three noisy pixels from each quadrant. If the there are fewer than three noisy pixels in the level2.evt file, extra rows are filled as -1
| Pixel properties | Quadrant properties | ||||||
|---|---|---|---|---|---|---|---|
| Quadrant | DetID | PixID | Counts | Sigma | Mean | Median | Sigma |
| A | 12 | 115 | 2051520 | 12207.15 | 683 | 667 | 168.0 |
| A | 0 | 8 | 441593 | 2624.49 | 683 | 667 | 168.0 |
| A | 8 | 249 | 345750 | 2054.01 | 683 | 667 | 168.0 |
| B | 7 | 252 | 325782 | 2099.12 | 720 | 696 | 154.9 |
| B | 0 | 213 | 168735 | 1085.05 | 720 | 696 | 154.9 |
| B | 0 | 197 | 18760 | 116.64 | 720 | 696 | 154.9 |
| C | 15 | 131 | 21930 | 108.5 | 712 | 706 | 195.6 |
| C | 12 | 250 | 19927 | 98.26 | 712 | 706 | 195.6 |
| C | 1 | 16 | 17567 | 86.19 | 712 | 706 | 195.6 |
| D | 11 | 129 | 3960080 | 21588.73 | 640 | 611 | 183.4 |
| D | 3 | 12 | 612204 | 3334.67 | 640 | 611 | 183.4 |
| D | 15 | 125 | 270118 | 1469.47 | 640 | 611 | 183.4 |
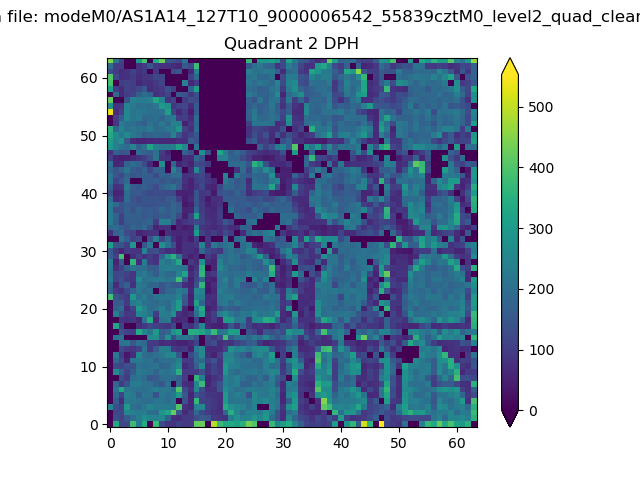
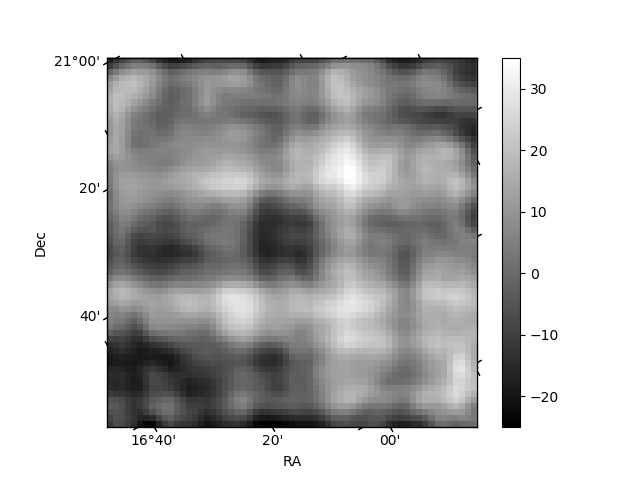
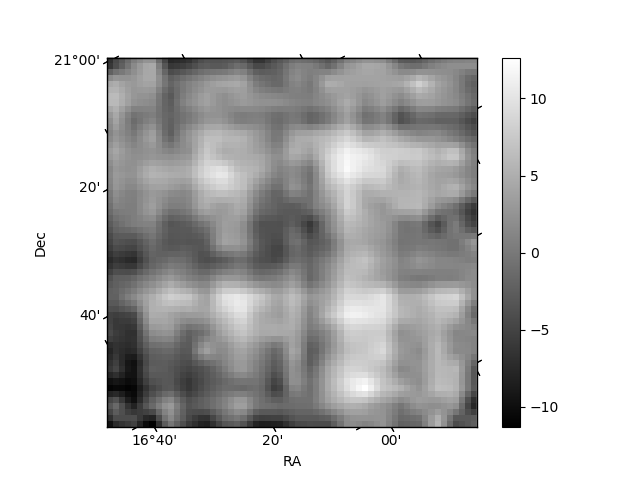
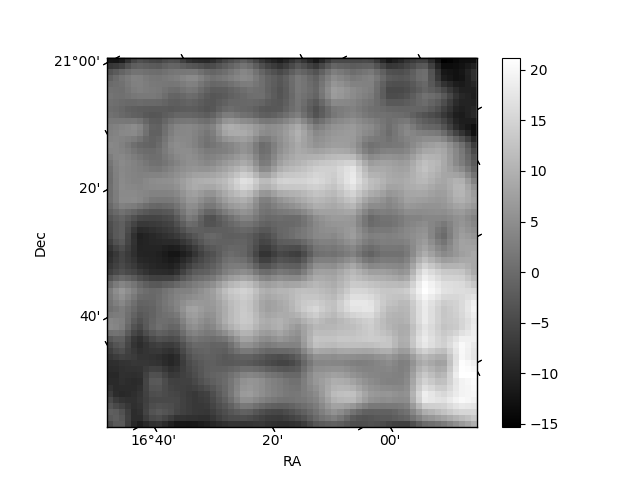
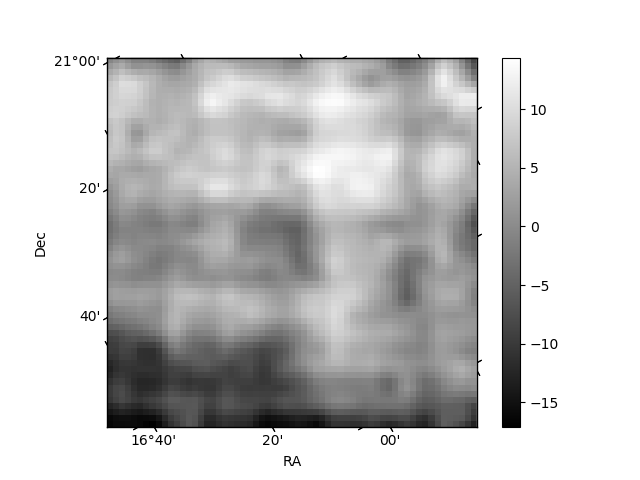
Histogram calculated using DETX and DETY for each event in the final _common_clean file
| Quadrant A | 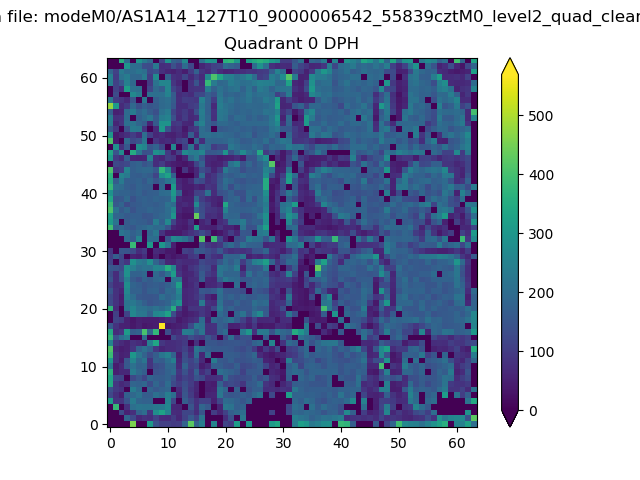 |
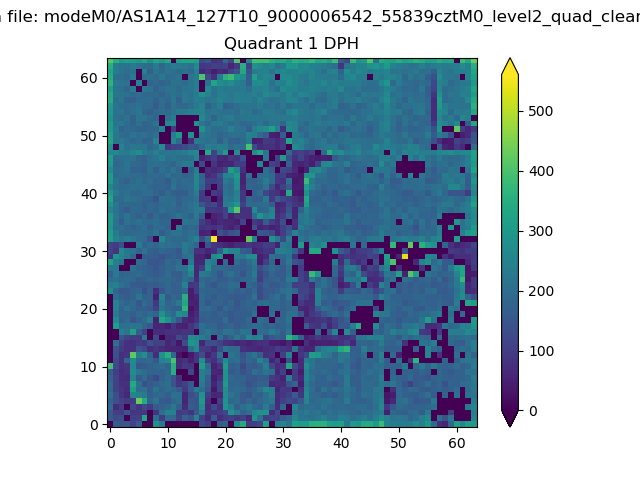 |
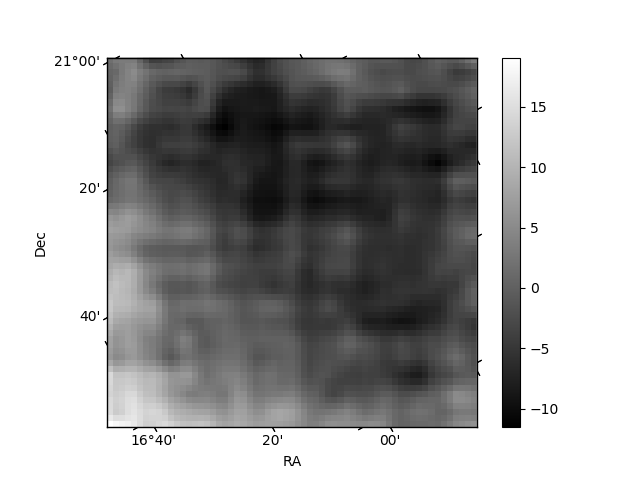
Quadrant B |
|---|---|---|---|
| Quadrant D | 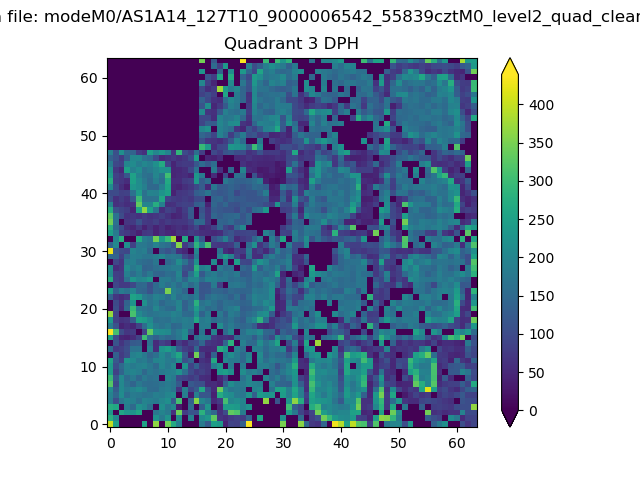 |
 |
Quadrant C |
| Plot type | Count rate plots | Images |
|---|---|---|
| Comparison with Poisson distribution Blue bars denote a histogram of data divided into 1 sec bins. Red curve is a Poisson curve with rate = median count rate of data. |
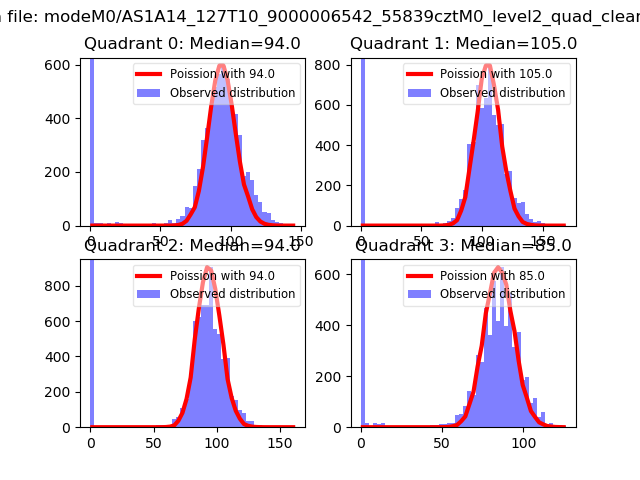 |
 |
| Quadrant-wise count rates Data is divided into 100 sec bins |
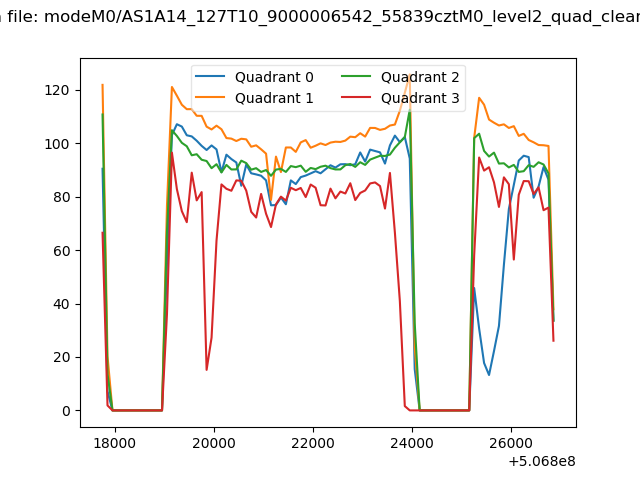 |
|
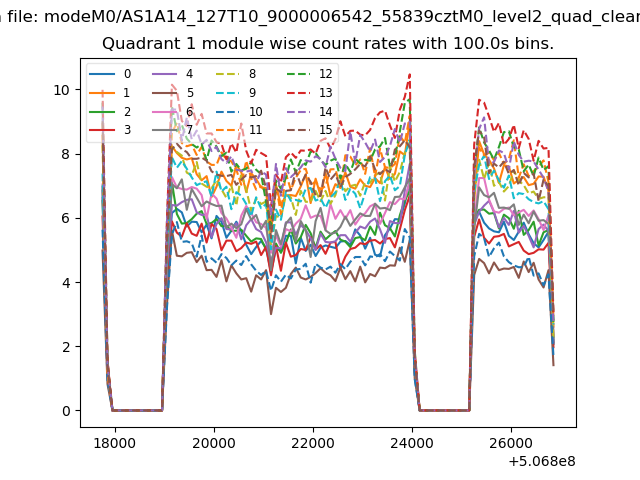
| Module-wise count rates for Quadrant A Data is divided into 100 sec bins |
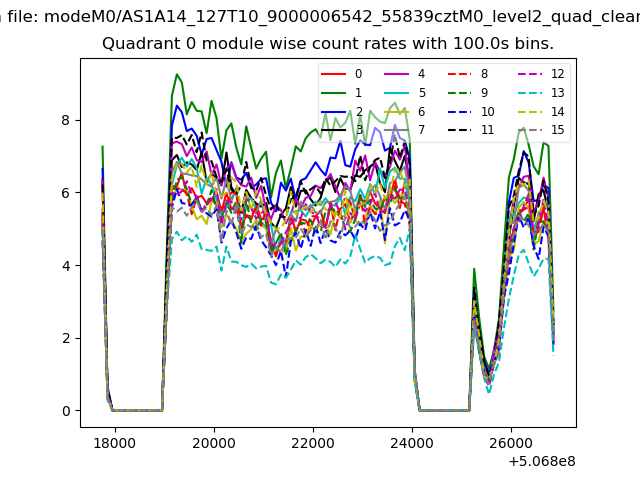 |
 |
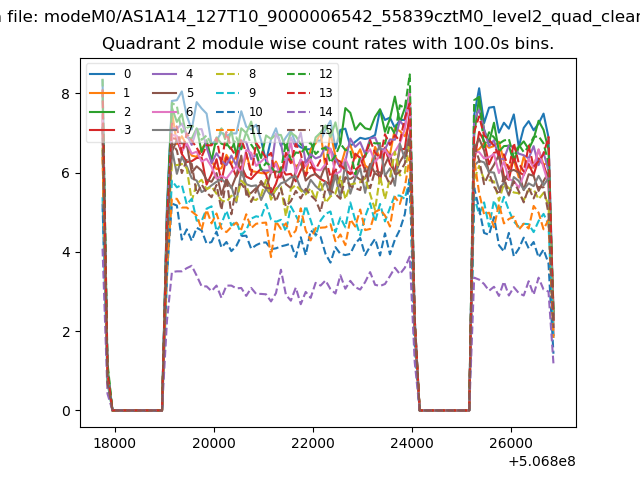
| Module-wise count rates for Quadrant B Data is divided into 100 sec bins |
 |
 |
| Module-wise count rates for Quadrant C Data is divided into 100 sec bins |
 |
 |
| Module-wise count rates for Quadrant D Data is divided into 100 sec bins |
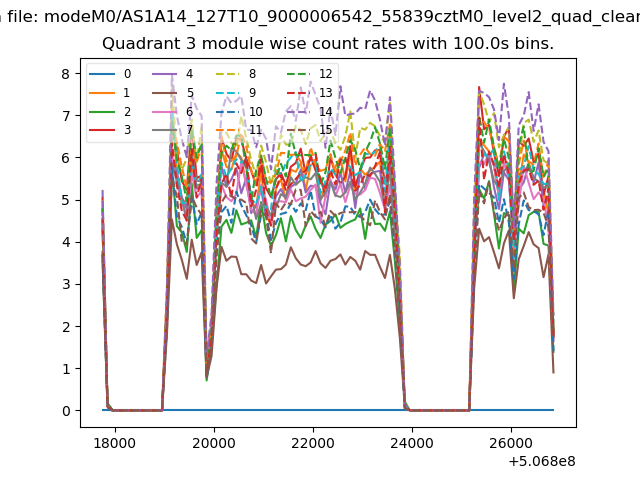 |
 |
| Parameter | Plot |
|---|---|
| CZT HV Monitor | 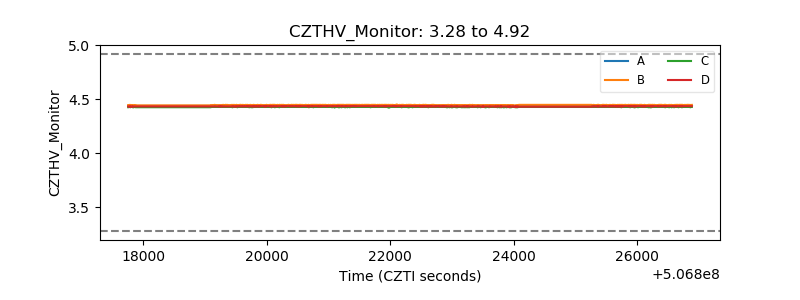 |
| D_VDD | 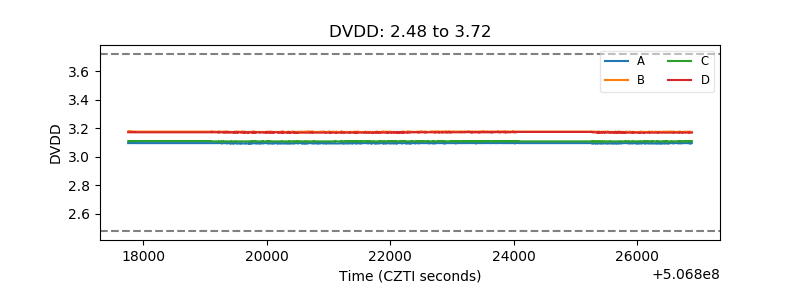 |
| Temperature 1 | 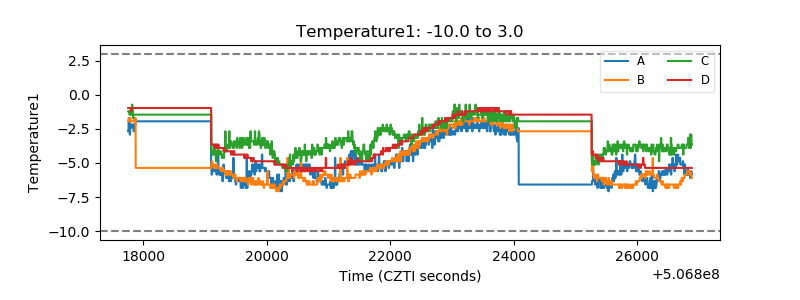 |
| Veto HV Monitor | 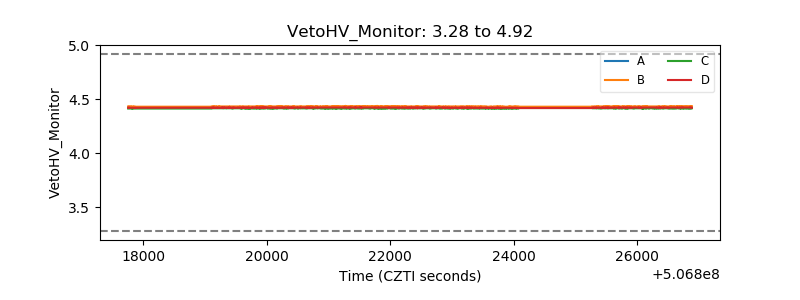 |
| Veto LLD | 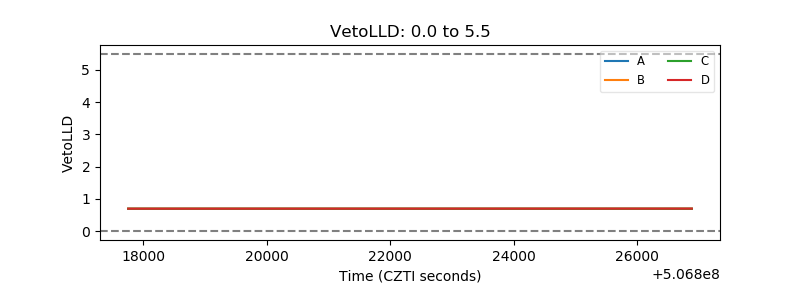 |
| Alpha Counter | 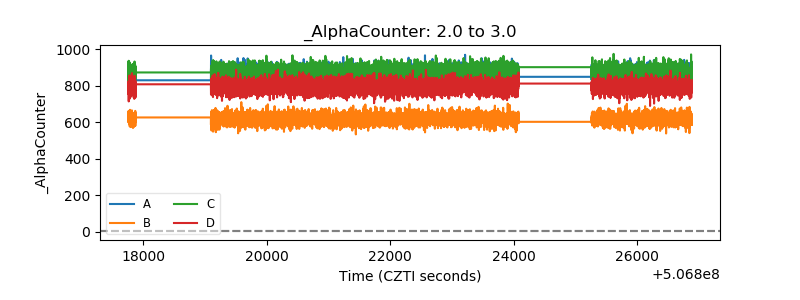 |
| _CPM_Rate | 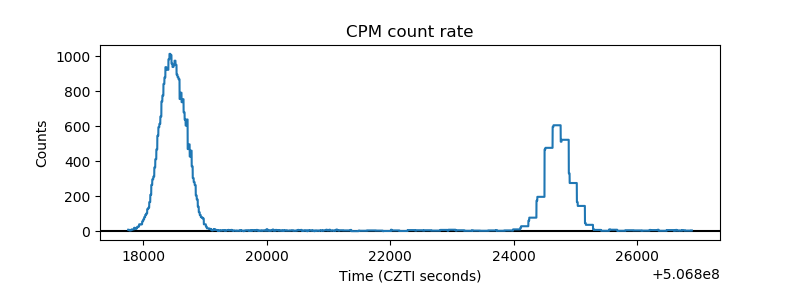 |
| CZT Counter | 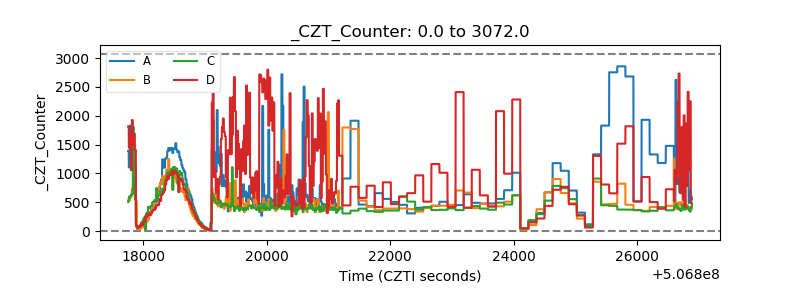 |
| +2.5 Volts monitor | 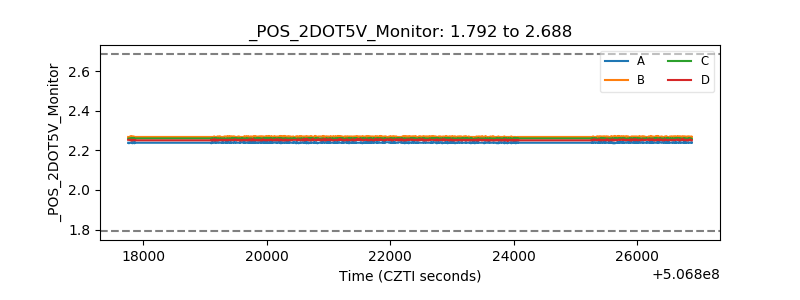 |
| +5 Volts monitor | 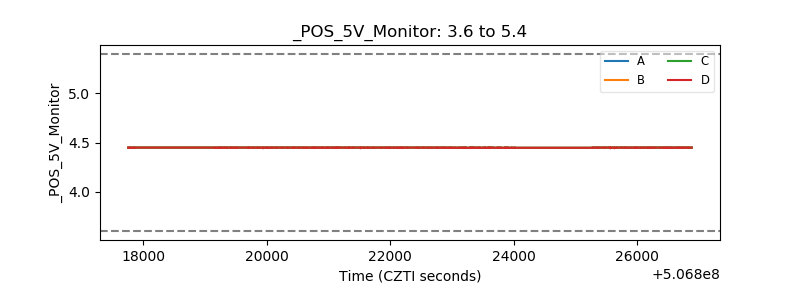 |
| _ROLL_ROT | 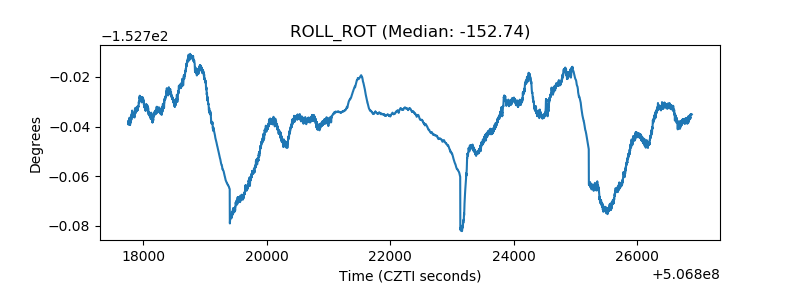 |
| _Roll_DEC | 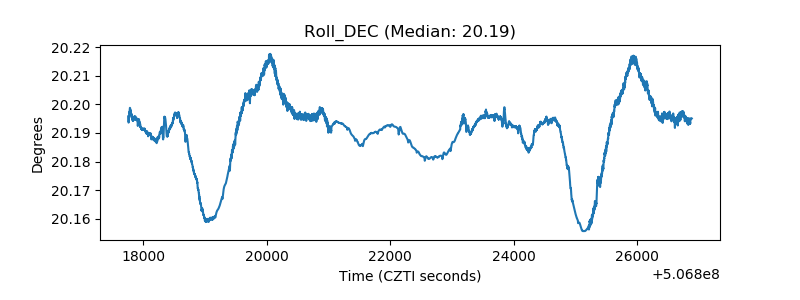 |
| _Roll_RA | 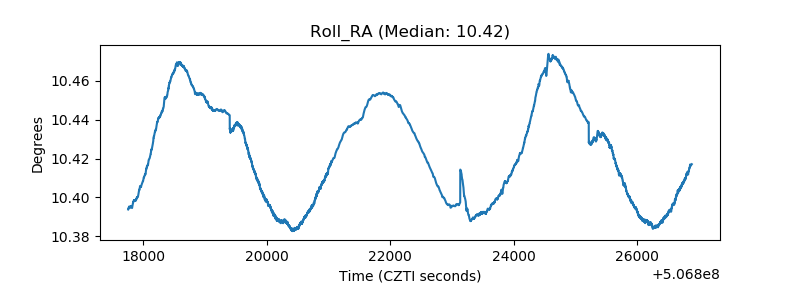 |
| Veto Counter | 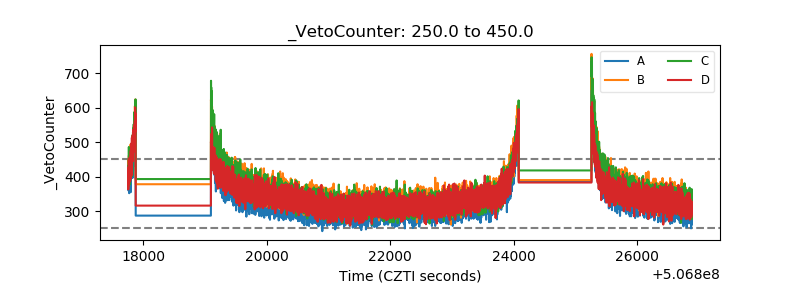 |