| Param | Original file | Final file |
|---|---|---|
| Filename | modeM0/AS1A14_127T10_9000006542_55840cztM0_level2.fits | modeM0/AS1A14_127T10_9000006542_55840cztM0_level2_quad_clean.evt |
| Size (bytes) | 518,768,640 | 95,808,960 |
| Size | 494.7 MB | 91.4 MB |
| Events in quadrant A | 7,063,355 | 565,118 |
| Events in quadrant B | 3,161,114 | 685,698 |
| Events in quadrant C | 3,018,106 | 622,256 |
| Events in quadrant D | 5,435,098 | 556,174 |
| Mode M0 | |||
|---|---|---|---|
| Quadrant | BADHDUFLAG | Total packets | Discarded packets |
| A | 0 | 25672 | 2 |
| B | 0 | 14381 | 2 |
| C | 0 | 14389 | 2 |
| D | 0 | 20906 | 2 |
| Mode M9 | |||
|---|---|---|---|
| Quadrant | BADHDUFLAG | Total packets | Discarded packets |
| A | 0 | 12 | 0 |
| B | 0 | 13 | 0 |
| C | 0 | 13 | 0 |
| D | 0 | 13 | 0 |
| Mode SS | |||
|---|---|---|---|
| Quadrant | BADHDUFLAG | Total packets | Discarded packets |
| A | 0 | 138 | 0 |
| B | 0 | 138 | 0 |
| C | 0 | 138 | 0 |
| D | 0 | 138 | 0 |
| Quadrant | Total seconds | Saturated seconds | Saturation percentage |
|---|---|---|---|
| A | 6768 | 855 | 12.632979% |
| B | 6768 | 150 | 2.216312% |
| C | 6768 | 87 | 1.285461% |
| D | 6768 | 439 | 6.486407% |
Noise dominated data is calculated using 1-second bins in cleaned event files. If a bin has >2000 counts, and if more than 50% of those come from <1% of pixels, then it is considered to be noise-dominated and hence unusable.
| Quadrant | # 1 sec bins | Bins with >0 counts | Bins with >2000 counts | High rate bins dominated by noise | Noise dominated (total time) | Noise dominated (detector-on time) | Marked lightcurve |
|---|---|---|---|---|---|---|---|
| A | 7763 | 6768 | 740 | 740 | 9.53% | 10.93% | 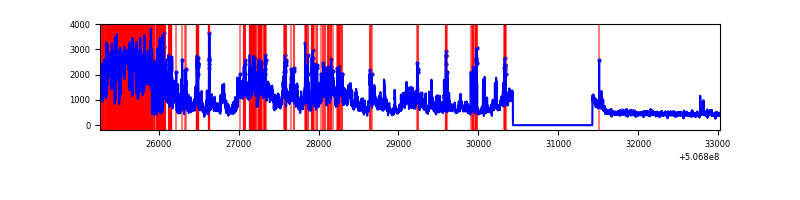 |
| B | 7763 | 6768 | 14 | 14 | 0.18% | 0.21% | 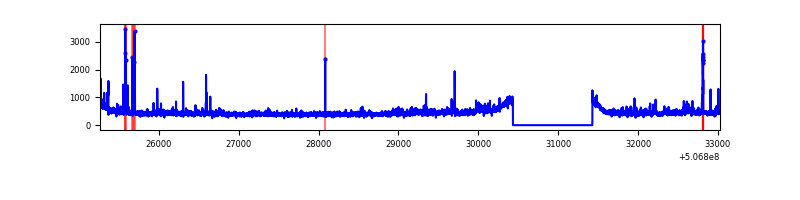 |
| C | 7763 | 6768 | 17 | 17 | 0.22% | 0.25% | 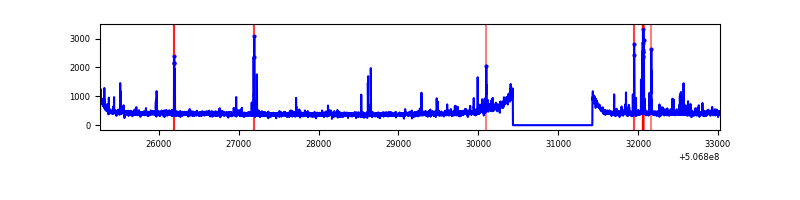 |
| D | 7763 | 6769 | 384 | 384 | 4.95% | 5.67% | 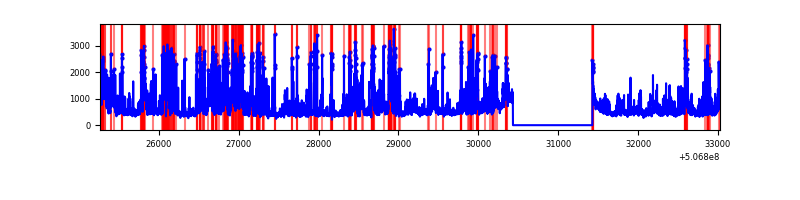 |
Top three noisy pixels from each quadrant. If the there are fewer than three noisy pixels in the level2.evt file, extra rows are filled as -1
| Pixel properties | Quadrant properties | ||||||
|---|---|---|---|---|---|---|---|
| Quadrant | DetID | PixID | Counts | Sigma | Mean | Median | Sigma |
| A | 12 | 115 | 3163758 | 18636.83 | 696 | 678 | 169.7 |
| A | 3 | 14 | 490133 | 2883.86 | 696 | 678 | 169.7 |
| A | 8 | 192 | 244198 | 1434.82 | 696 | 678 | 169.7 |
| B | 7 | 252 | 105659 | 663.33 | 725 | 698 | 158.2 |
| B | 0 | 213 | 77221 | 483.61 | 725 | 698 | 158.2 |
| B | 0 | 197 | 62842 | 392.73 | 725 | 698 | 158.2 |
| C | 6 | 223 | 50979 | 255.09 | 719 | 713 | 197.1 |
| C | 12 | 250 | 28929 | 143.19 | 719 | 713 | 197.1 |
| C | 12 | 252 | 27867 | 137.8 | 719 | 713 | 197.1 |
| D | 11 | 129 | 2065006 | 10431.02 | 694 | 662 | 197.9 |
| D | 3 | 12 | 263545 | 1328.33 | 694 | 662 | 197.9 |
| D | 15 | 125 | 99867 | 501.28 | 694 | 662 | 197.9 |
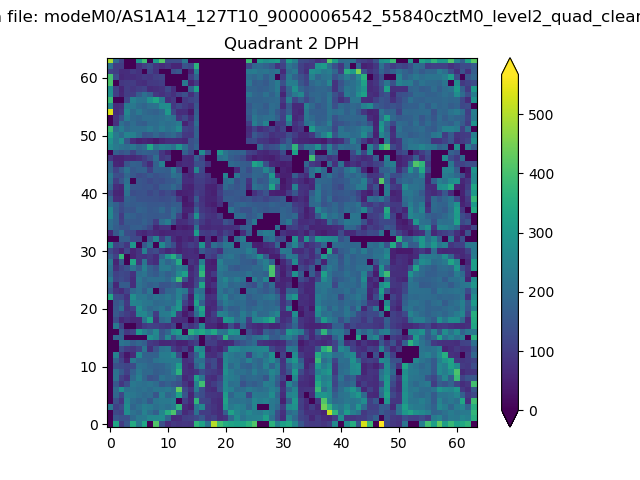
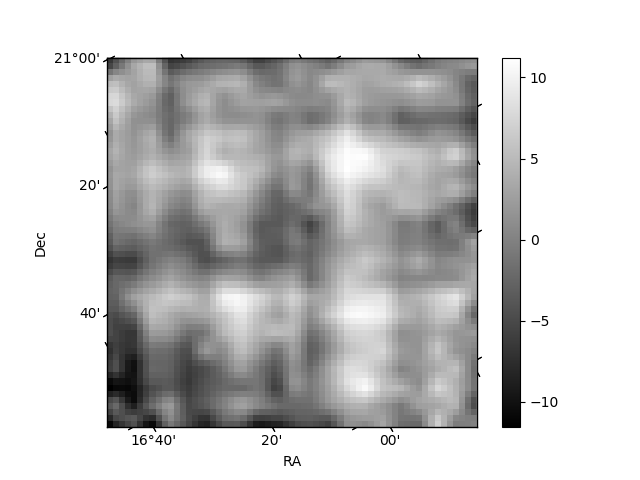
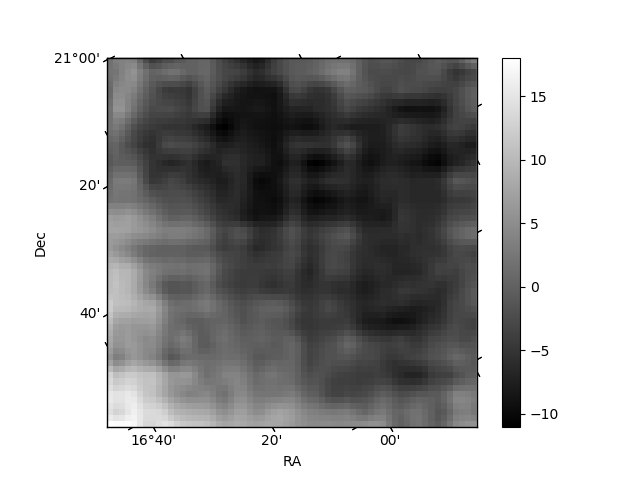
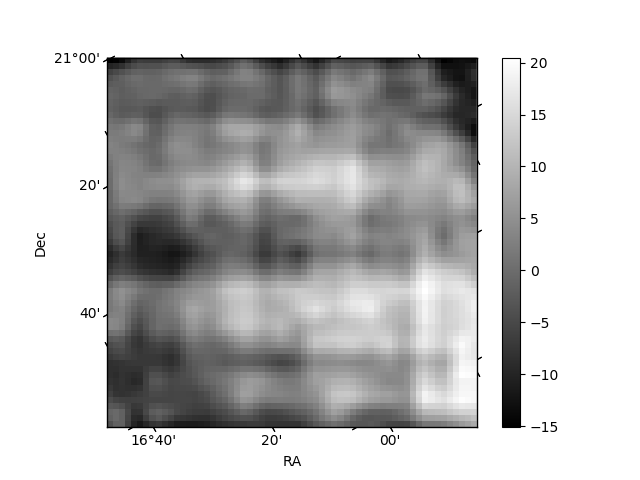
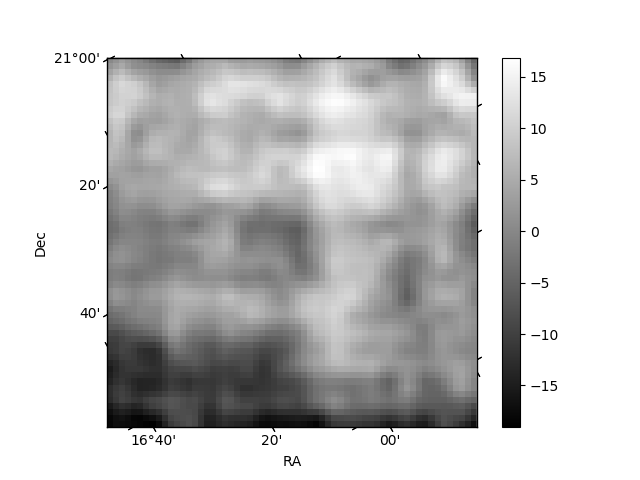
Histogram calculated using DETX and DETY for each event in the final _common_clean file
| Quadrant A | 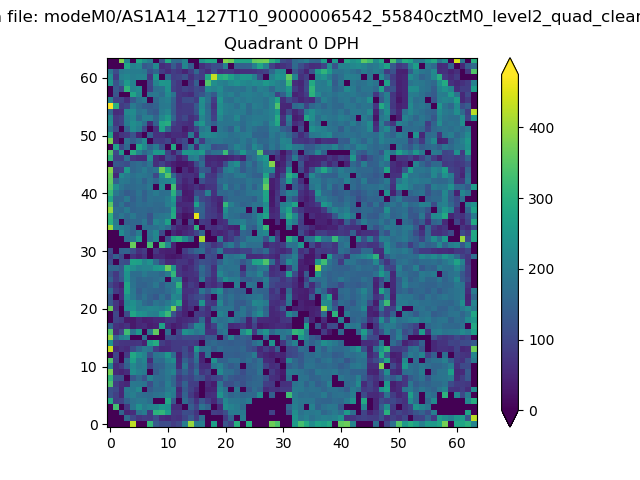 |
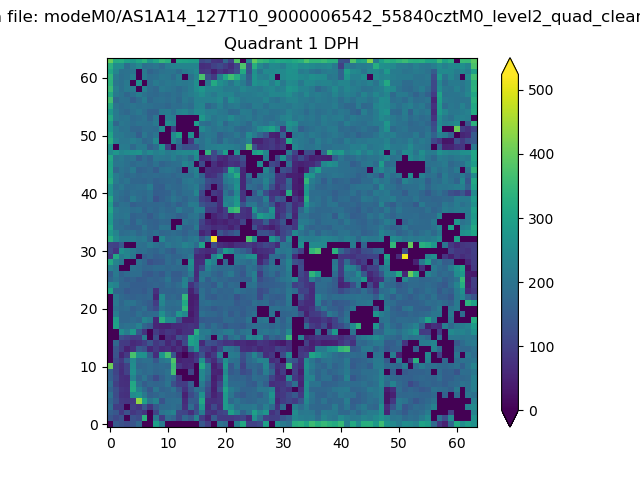 |
Quadrant B |
|---|---|---|---|
| Quadrant D | 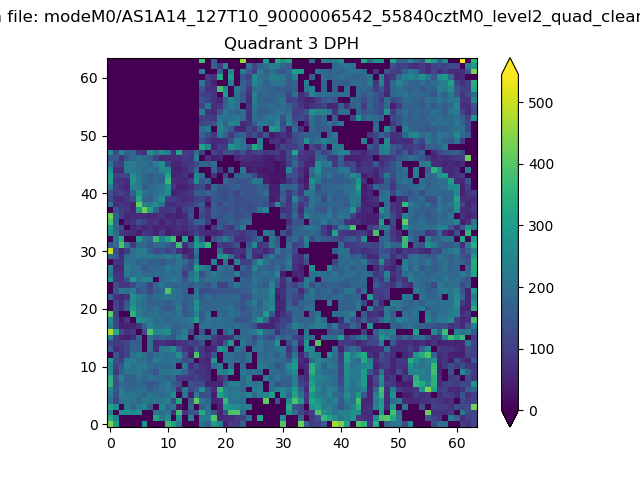 |
 |
Quadrant C |
| Plot type | Count rate plots | Images |
|---|---|---|
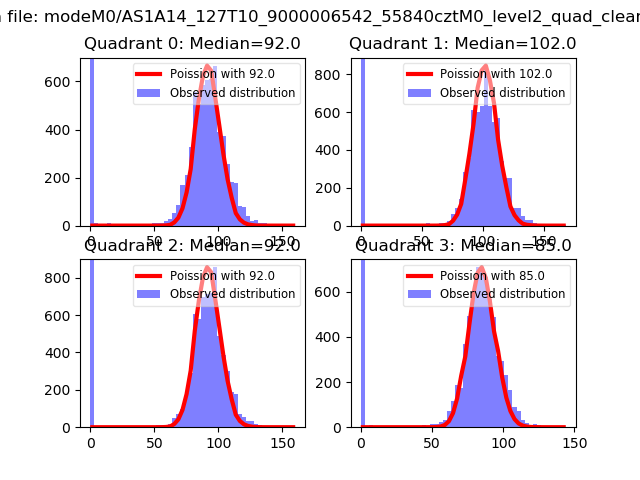
| Comparison with Poisson distribution Blue bars denote a histogram of data divided into 1 sec bins. Red curve is a Poisson curve with rate = median count rate of data. |
 |
 |
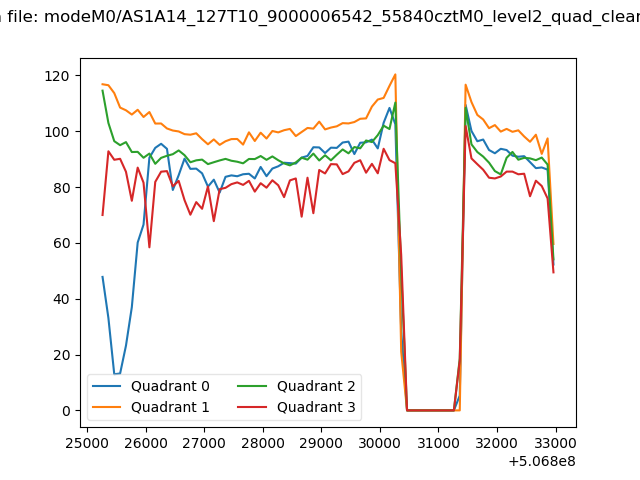
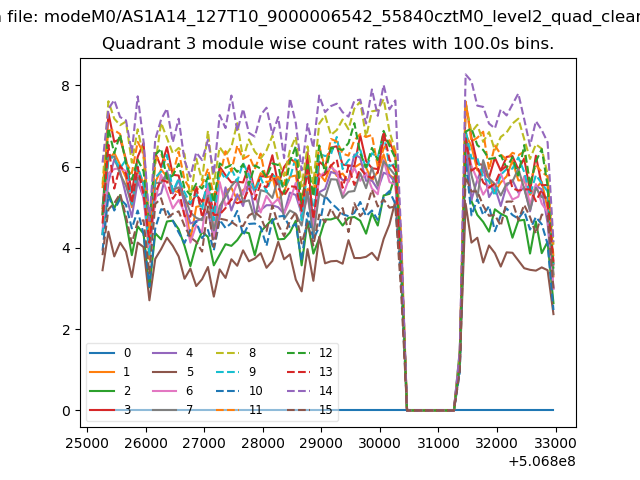
| Quadrant-wise count rates Data is divided into 100 sec bins |
 |
|
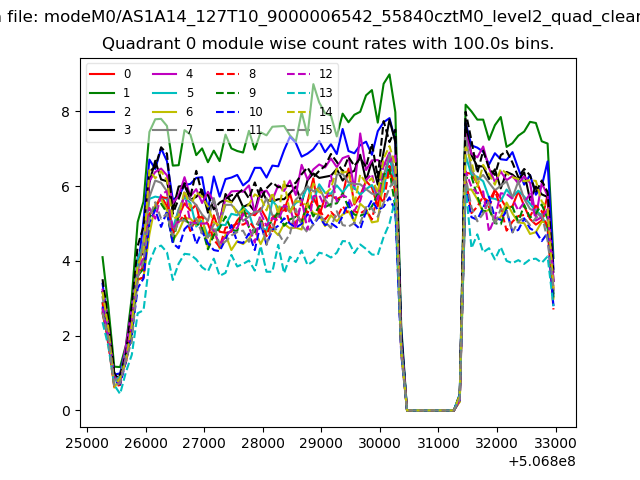
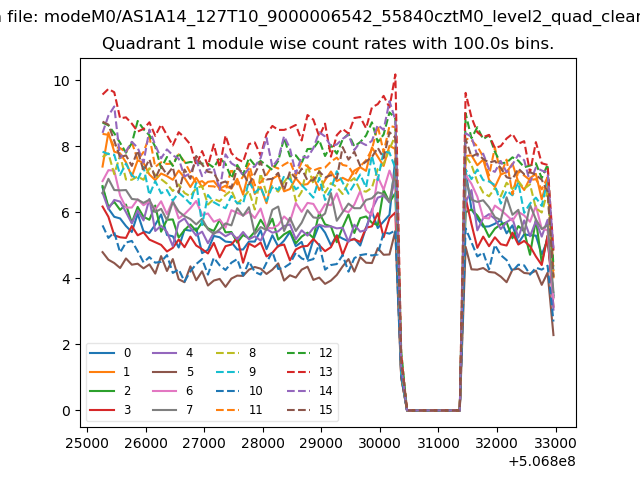
| Module-wise count rates for Quadrant A Data is divided into 100 sec bins |
 |
 |
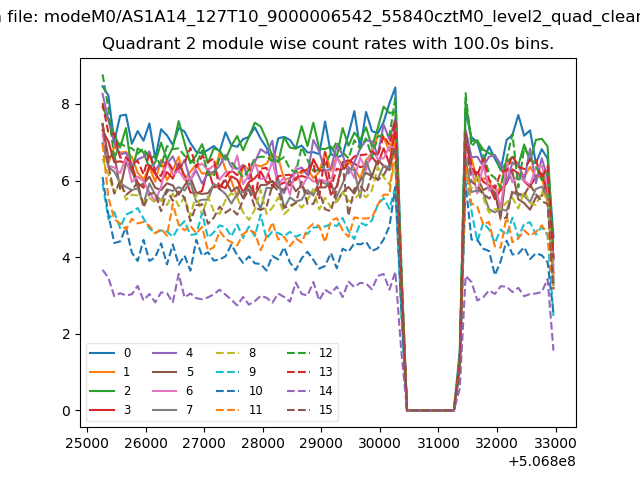
| Module-wise count rates for Quadrant B Data is divided into 100 sec bins |
 |
 |
| Module-wise count rates for Quadrant C Data is divided into 100 sec bins |
 |
 |
| Module-wise count rates for Quadrant D Data is divided into 100 sec bins |
 |
 |
| Parameter | Plot |
|---|---|
| CZT HV Monitor | 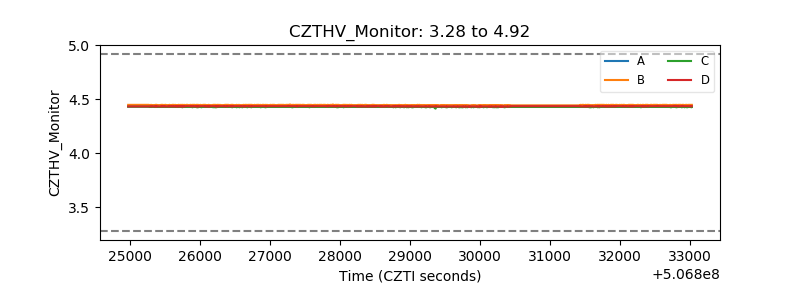 |
| D_VDD | 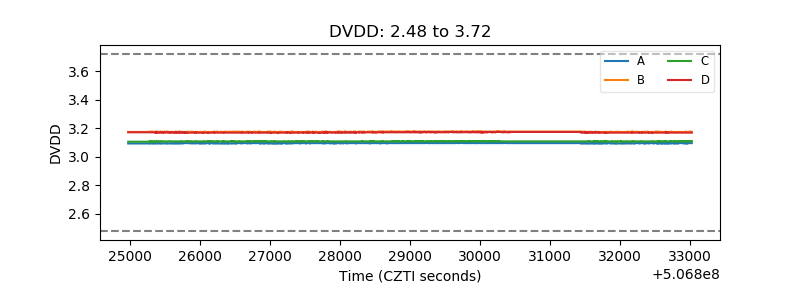 |
| Temperature 1 | 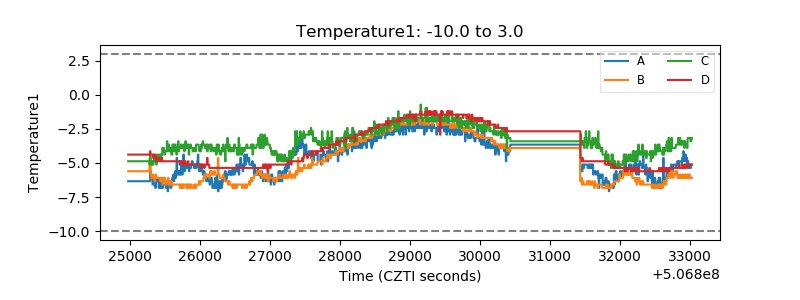 |
| Veto HV Monitor | 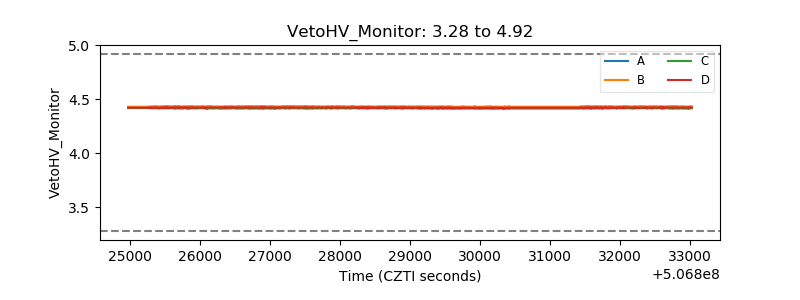 |
| Veto LLD | 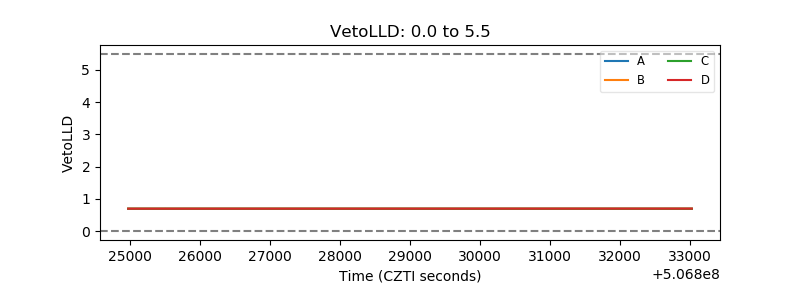 |
| Alpha Counter | 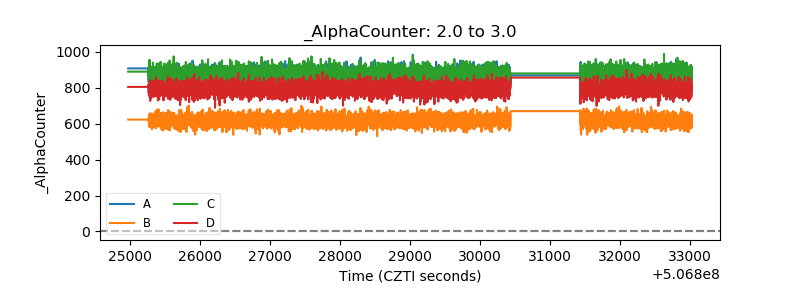 |
| _CPM_Rate | 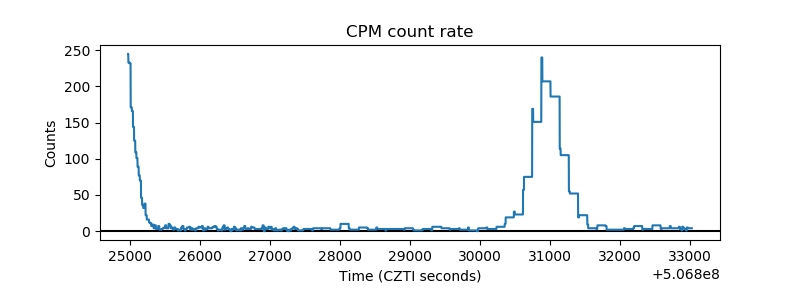 |
| CZT Counter | 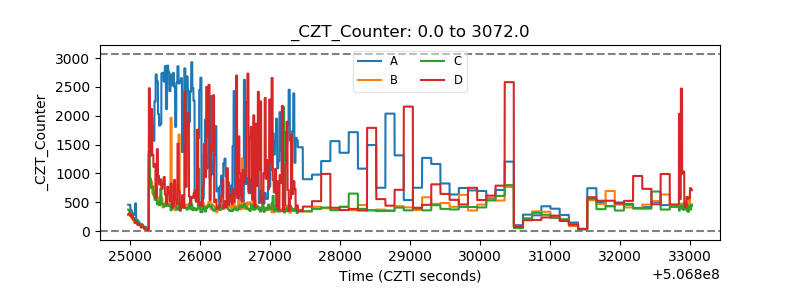 |
| +2.5 Volts monitor | 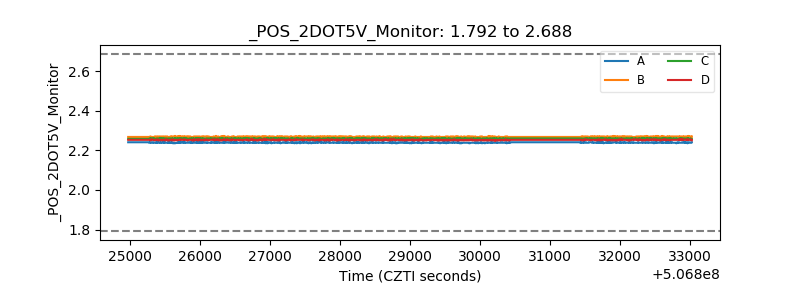 |
| +5 Volts monitor | 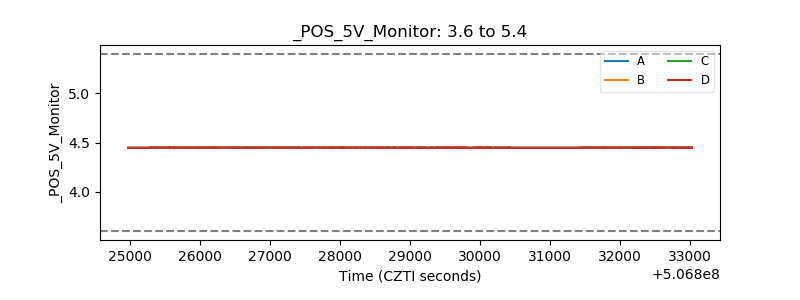 |
| _ROLL_ROT | 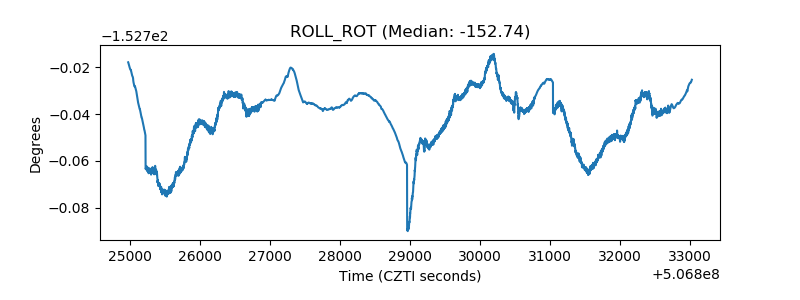 |
| _Roll_DEC | 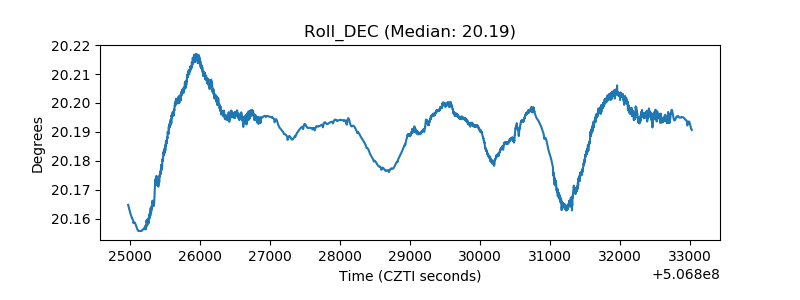 |
| _Roll_RA | 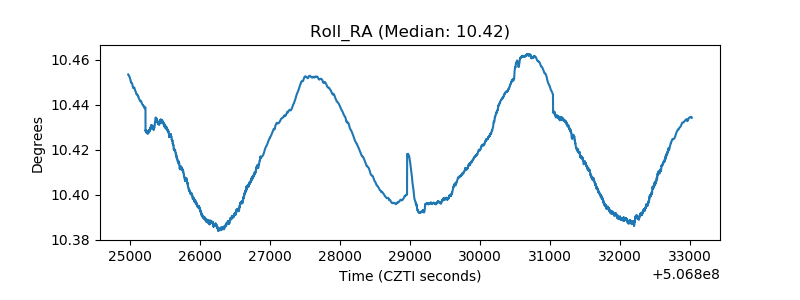 |
| Veto Counter | 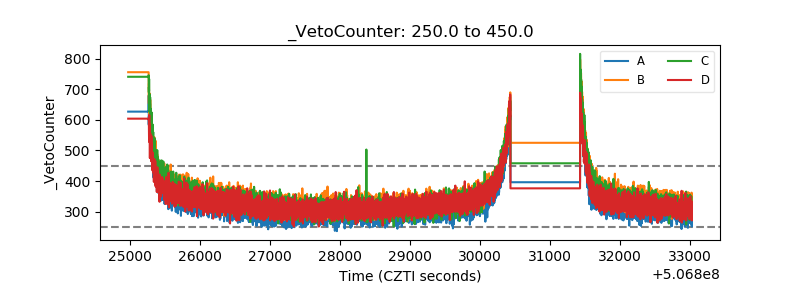 |