| Param | Original file | Final file |
|---|---|---|
| Filename | modeM0/AS1A14_127T10_9000006542_55841cztM0_level2.fits | modeM0/AS1A14_127T10_9000006542_55841cztM0_level2_quad_clean.evt |
| Size (bytes) | 448,084,800 | 98,375,040 |
| Size | 427.3 MB | 93.8 MB |
| Events in quadrant A | 3,726,240 | 641,999 |
| Events in quadrant B | 3,239,816 | 684,742 |
| Events in quadrant C | 3,204,123 | 627,711 |
| Events in quadrant D | 5,884,644 | 547,699 |
| Mode M0 | |||
|---|---|---|---|
| Quadrant | BADHDUFLAG | Total packets | Discarded packets |
| A | 0 | 15640 | 2 |
| B | 0 | 14588 | 2 |
| C | 0 | 14818 | 2 |
| D | 0 | 22336 | 2 |
| Mode M9 | |||
|---|---|---|---|
| Quadrant | BADHDUFLAG | Total packets | Discarded packets |
| A | 0 | 9 | 0 |
| B | 0 | 10 | 0 |
| C | 0 | 10 | 0 |
| D | 0 | 10 | 0 |
| Mode SS | |||
|---|---|---|---|
| Quadrant | BADHDUFLAG | Total packets | Discarded packets |
| A | 0 | 140 | 0 |
| B | 0 | 140 | 0 |
| C | 0 | 140 | 0 |
| D | 0 | 140 | 0 |
| Quadrant | Total seconds | Saturated seconds | Saturation percentage |
|---|---|---|---|
| A | 6838 | 196 | 2.866335% |
| B | 6838 | 197 | 2.880959% |
| C | 6838 | 99 | 1.447792% |
| D | 6837 | 678 | 9.916630% |
Noise dominated data is calculated using 1-second bins in cleaned event files. If a bin has >2000 counts, and if more than 50% of those come from <1% of pixels, then it is considered to be noise-dominated and hence unusable.
| Quadrant | # 1 sec bins | Bins with >0 counts | Bins with >2000 counts | High rate bins dominated by noise | Noise dominated (total time) | Noise dominated (detector-on time) | Marked lightcurve |
|---|---|---|---|---|---|---|---|
| A | 7543 | 6838 | 41 | 41 | 0.54% | 0.60% | 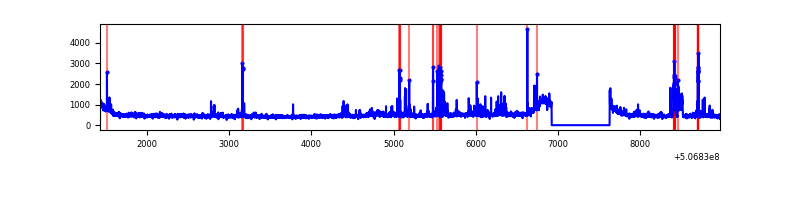 |
| B | 7543 | 6838 | 10 | 10 | 0.13% | 0.15% | 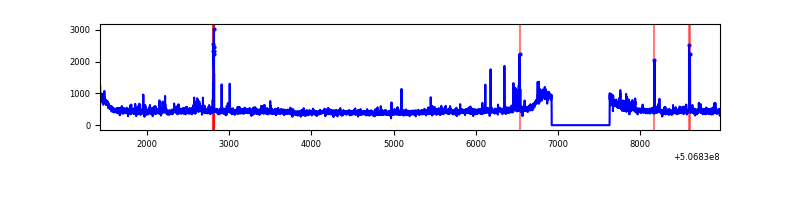 |
| C | 7543 | 6838 | 22 | 22 | 0.29% | 0.32% | 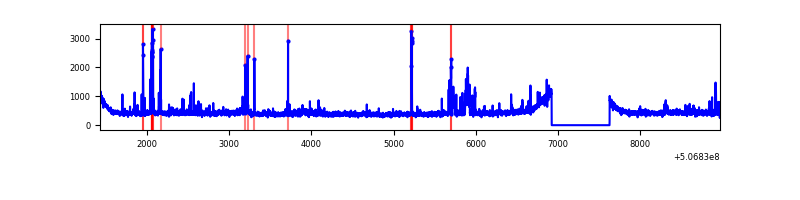 |
| D | 7542 | 6837 | 550 | 550 | 7.29% | 8.04% | 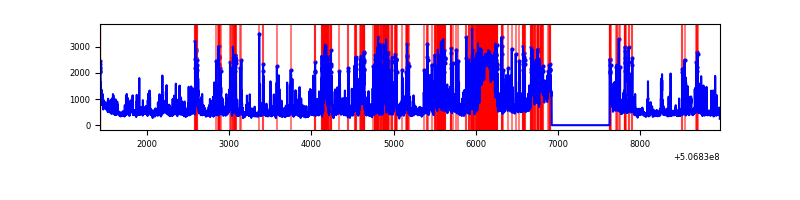 |
Top three noisy pixels from each quadrant. If the there are fewer than three noisy pixels in the level2.evt file, extra rows are filled as -1
| Pixel properties | Quadrant properties | ||||||
|---|---|---|---|---|---|---|---|
| Quadrant | DetID | PixID | Counts | Sigma | Mean | Median | Sigma |
| A | 8 | 192 | 295263 | 1598.76 | 742 | 723 | 184.2 |
| A | 3 | 14 | 257621 | 1394.44 | 742 | 723 | 184.2 |
| A | 0 | 8 | 105929 | 571.06 | 742 | 723 | 184.2 |
| B | 0 | 197 | 173303 | 1074.68 | 734 | 707 | 160.6 |
| B | 0 | 213 | 52143 | 320.27 | 734 | 707 | 160.6 |
| B | 7 | 252 | 46639 | 286.0 | 734 | 707 | 160.6 |
| C | 4 | 192 | 94843 | 473.58 | 726 | 722 | 198.7 |
| C | 12 | 252 | 73061 | 363.98 | 726 | 722 | 198.7 |
| C | 6 | 223 | 43485 | 215.17 | 726 | 722 | 198.7 |
| D | 11 | 129 | 2393546 | 12153.87 | 687 | 657 | 196.9 |
| D | 3 | 12 | 502413 | 2548.5 | 687 | 657 | 196.9 |
| D | 8 | 245 | 74560 | 375.37 | 687 | 657 | 196.9 |
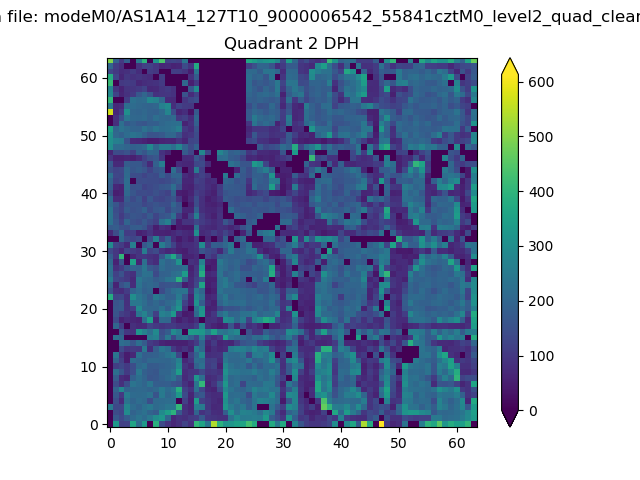
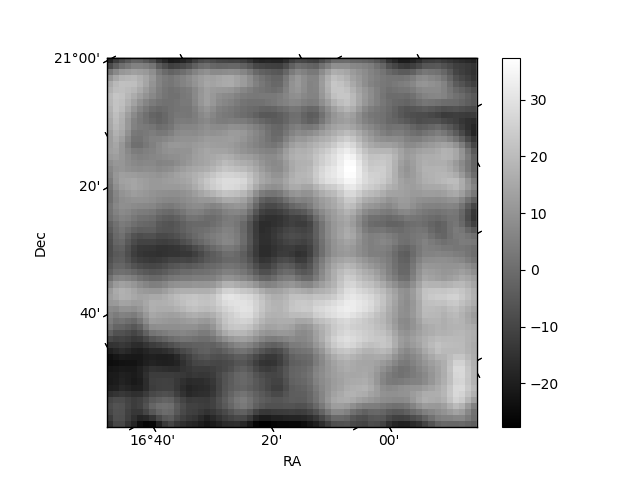
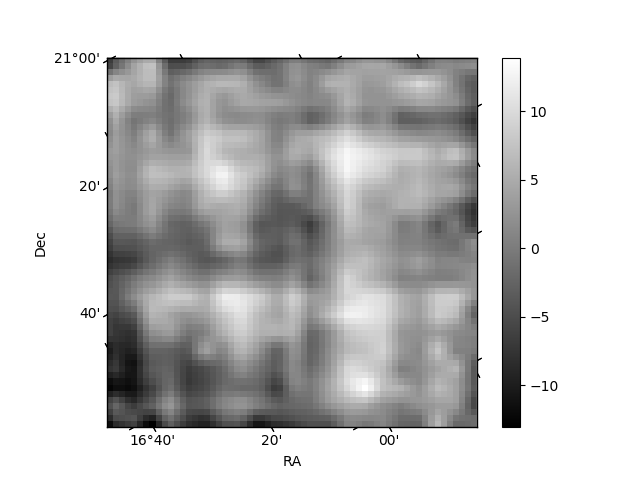
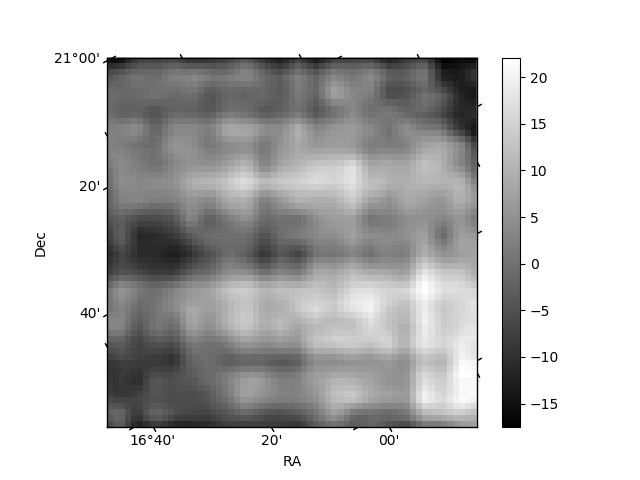
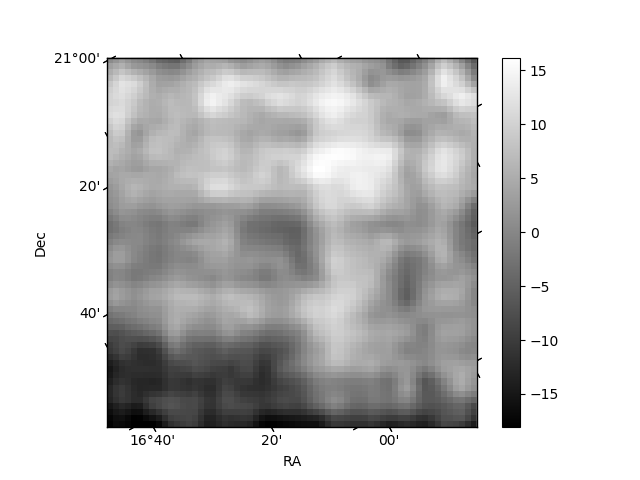
Histogram calculated using DETX and DETY for each event in the final _common_clean file
| Quadrant A | 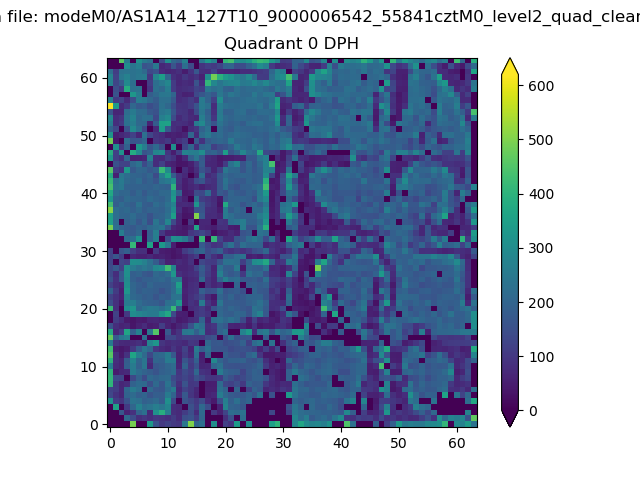 |
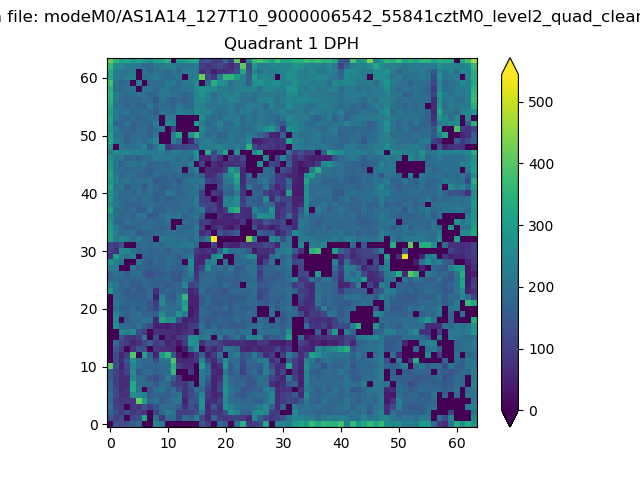 |
Quadrant B |
|---|---|---|---|
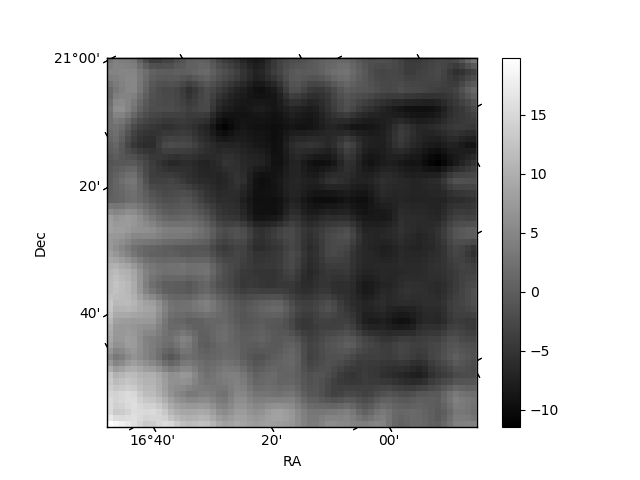
| Quadrant D | 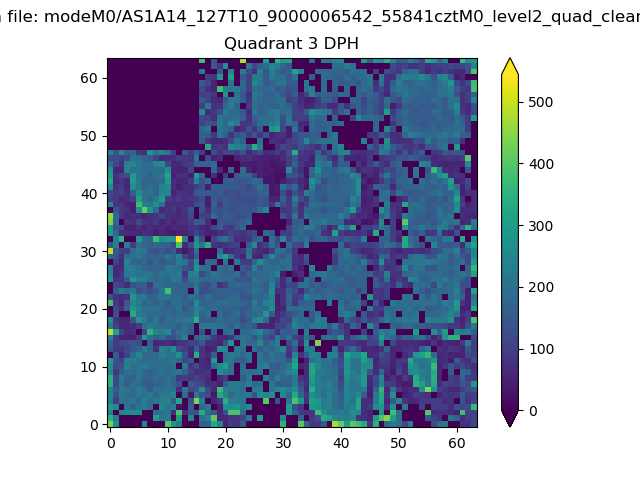 |
 |
Quadrant C |
| Plot type | Count rate plots | Images |
|---|---|---|
| Comparison with Poisson distribution Blue bars denote a histogram of data divided into 1 sec bins. Red curve is a Poisson curve with rate = median count rate of data. |
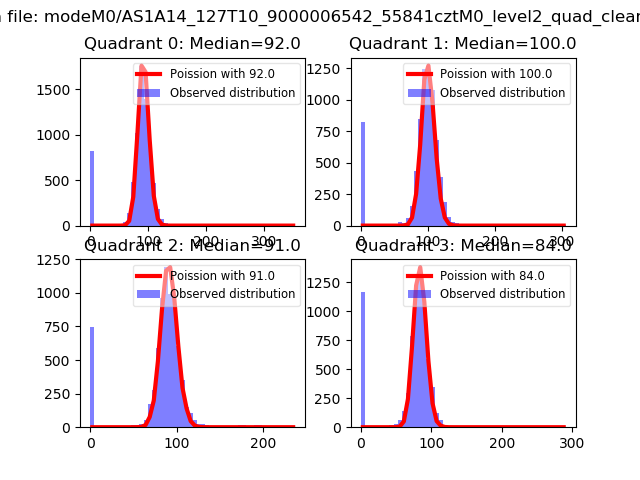 |
 |
| Quadrant-wise count rates Data is divided into 100 sec bins |
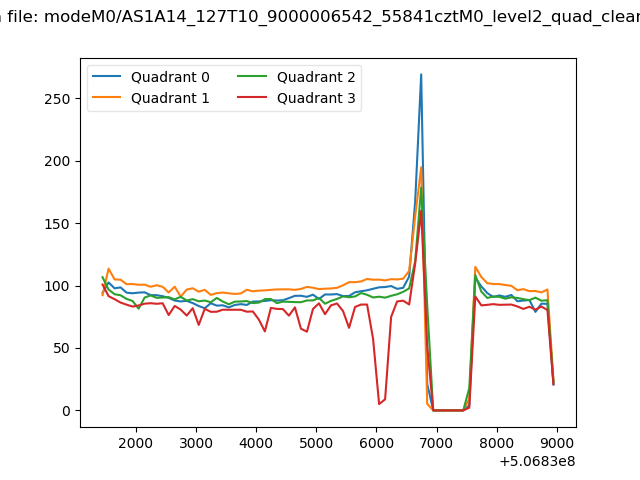 |
|
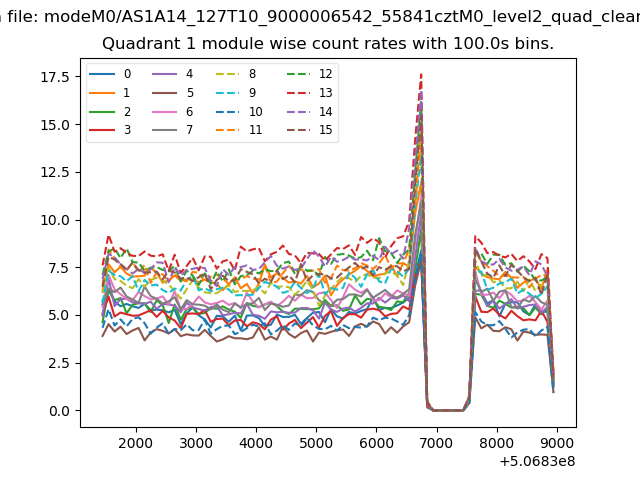
| Module-wise count rates for Quadrant A Data is divided into 100 sec bins |
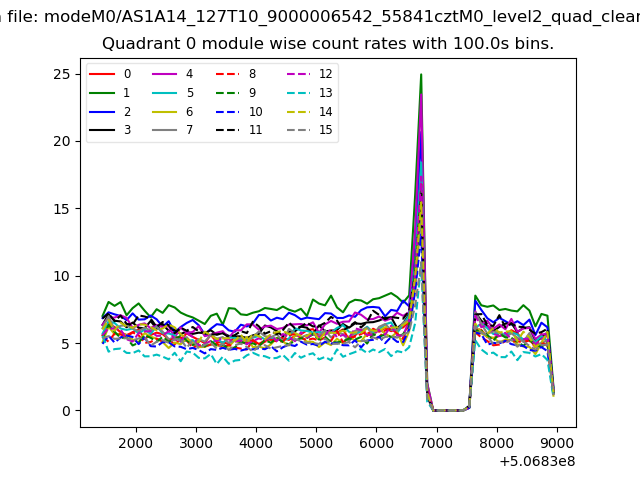 |
 |
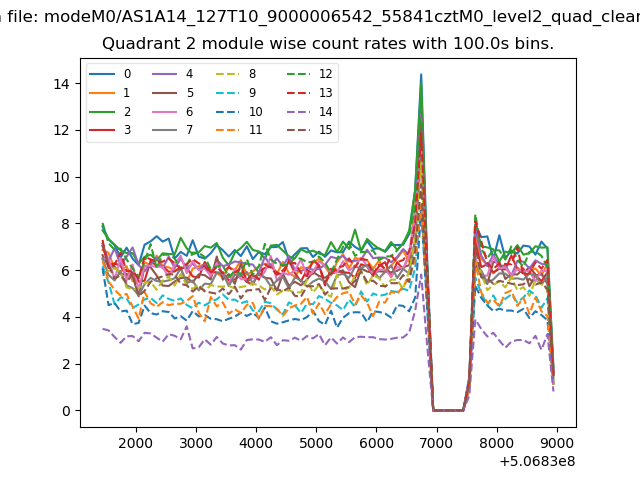
| Module-wise count rates for Quadrant B Data is divided into 100 sec bins |
 |
 |
| Module-wise count rates for Quadrant C Data is divided into 100 sec bins |
 |
 |
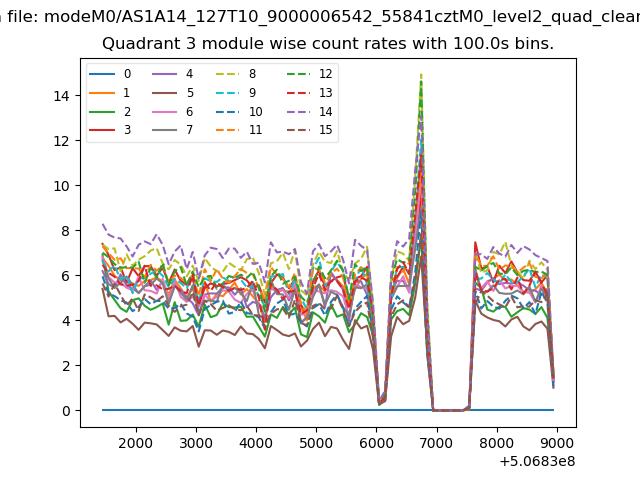
| Module-wise count rates for Quadrant D Data is divided into 100 sec bins |
 |
 |
| Parameter | Plot |
|---|---|
| CZT HV Monitor | 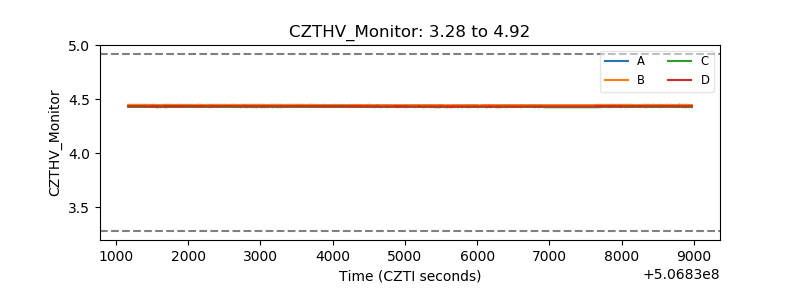 |
| D_VDD | 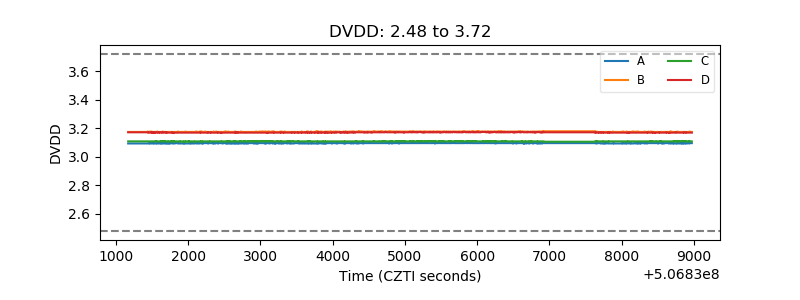 |
| Temperature 1 | 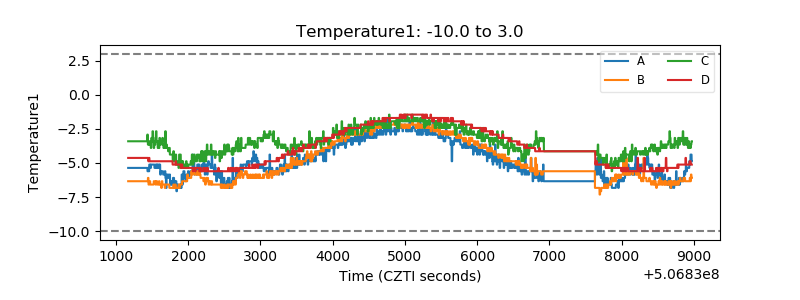 |
| Veto HV Monitor | 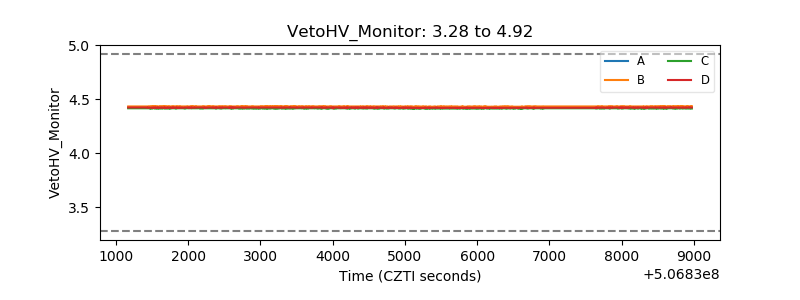 |
| Veto LLD | 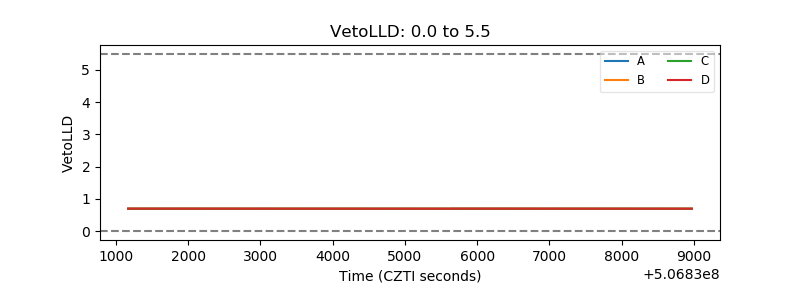 |
| Alpha Counter | 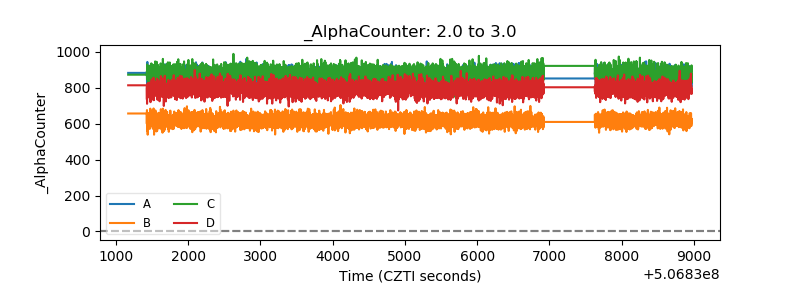 |
| _CPM_Rate | 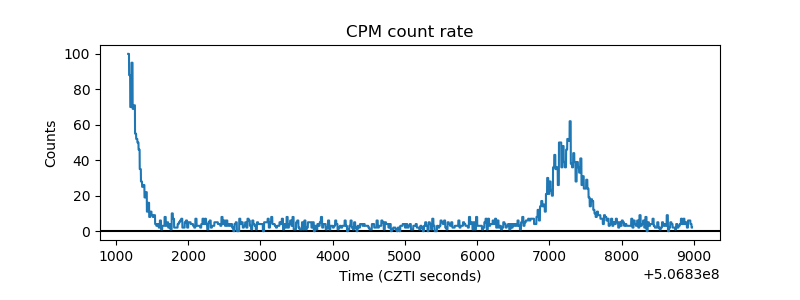 |
| CZT Counter | 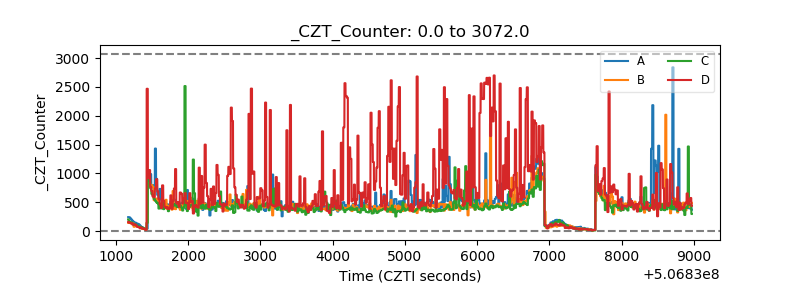 |
| +2.5 Volts monitor | 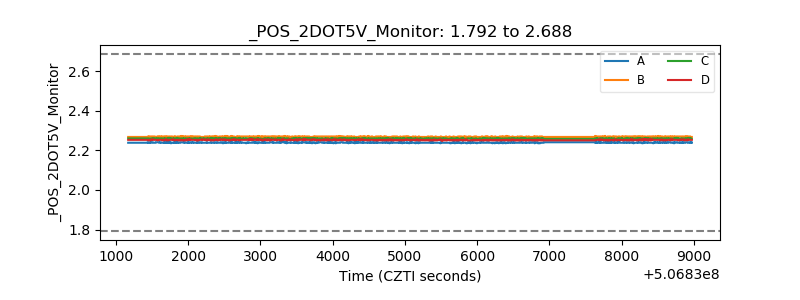 |
| +5 Volts monitor | 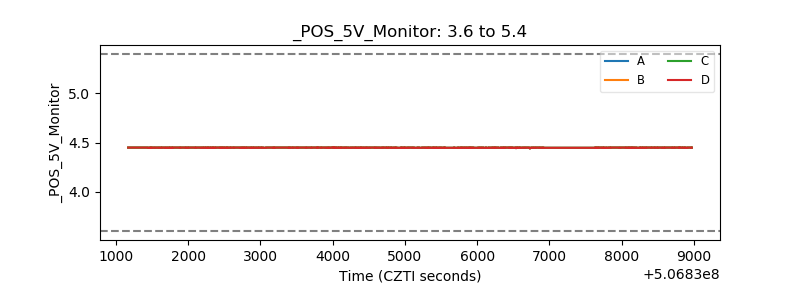 |
| _ROLL_ROT | 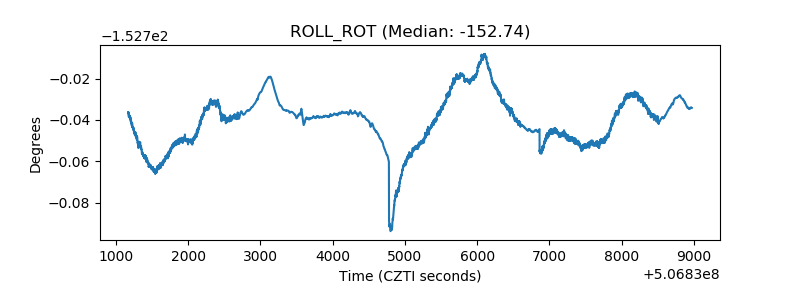 |
| _Roll_DEC | 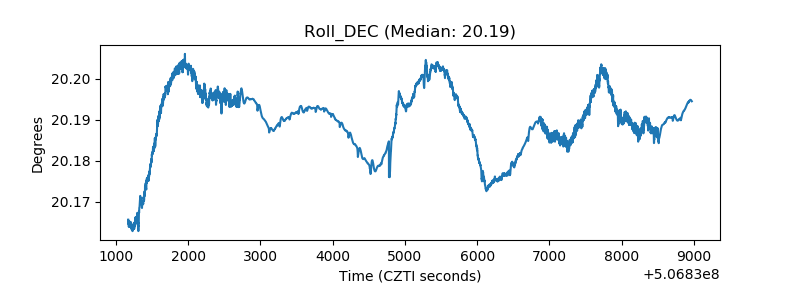 |
| _Roll_RA | 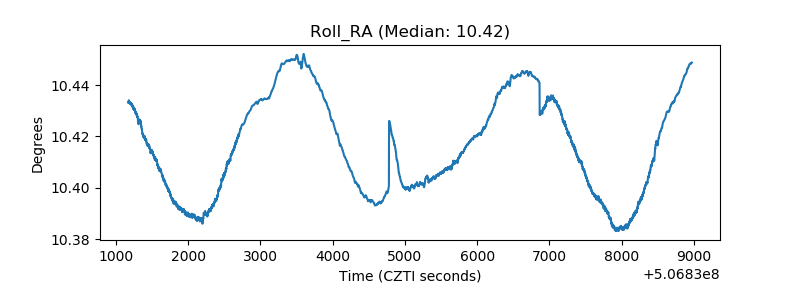 |
| Veto Counter | 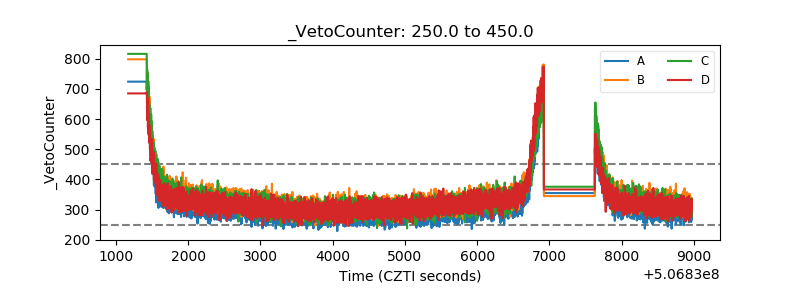 |