| Param | Original file | Final file |
|---|---|---|
| Filename | modeM0/AS1A14_127T10_9000006542_55842cztM0_level2.fits | modeM0/AS1A14_127T10_9000006542_55842cztM0_level2_quad_clean.evt |
| Size (bytes) | 586,872,000 | 110,831,040 |
| Size | 559.7 MB | 105.7 MB |
| Events in quadrant A | 6,460,003 | 699,042 |
| Events in quadrant B | 3,745,752 | 780,161 |
| Events in quadrant C | 3,583,747 | 717,173 |
| Events in quadrant D | 7,320,739 | 609,679 |
| Mode M0 | |||
|---|---|---|---|
| Quadrant | BADHDUFLAG | Total packets | Discarded packets |
| A | 0 | 25025 | 1 |
| B | 0 | 16795 | 1 |
| C | 0 | 16955 | 1 |
| D | 0 | 27323 | 1 |
| Mode M9 | |||
|---|---|---|---|
| Quadrant | BADHDUFLAG | Total packets | Discarded packets |
| A | 0 | 7 | 0 |
| B | 0 | 7 | 0 |
| C | 0 | 7 | 0 |
| D | 0 | 7 | 0 |
| Mode SS | |||
|---|---|---|---|
| Quadrant | BADHDUFLAG | Total packets | Discarded packets |
| A | 0 | 160 | 0 |
| B | 0 | 160 | 0 |
| C | 0 | 160 | 0 |
| D | 0 | 160 | 0 |
| Quadrant | Total seconds | Saturated seconds | Saturation percentage |
|---|---|---|---|
| A | 7911 | 562 | 7.104032% |
| B | 7911 | 271 | 3.425610% |
| C | 7912 | 80 | 1.011122% |
| D | 7912 | 944 | 11.931244% |
Noise dominated data is calculated using 1-second bins in cleaned event files. If a bin has >2000 counts, and if more than 50% of those come from <1% of pixels, then it is considered to be noise-dominated and hence unusable.
| Quadrant | # 1 sec bins | Bins with >0 counts | Bins with >2000 counts | High rate bins dominated by noise | Noise dominated (total time) | Noise dominated (detector-on time) | Marked lightcurve |
|---|---|---|---|---|---|---|---|
| A | 8616 | 7911 | 265 | 265 | 3.08% | 3.35% |  |
| B | 8616 | 7911 | 4 | 4 | 0.05% | 0.05% |  |
| C | 8617 | 7912 | 13 | 13 | 0.15% | 0.16% |  |
| D | 8617 | 7912 | 880 | 880 | 10.21% | 11.12% | 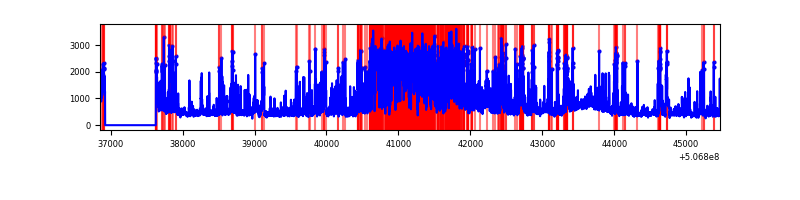 |
Top three noisy pixels from each quadrant. If the there are fewer than three noisy pixels in the level2.evt file, extra rows are filled as -1
| Pixel properties | Quadrant properties | ||||||
|---|---|---|---|---|---|---|---|
| Quadrant | DetID | PixID | Counts | Sigma | Mean | Median | Sigma |
| A | 7 | 64 | 1481643 | 7063.19 | 850 | 828 | 209.7 |
| A | 0 | 8 | 588273 | 2801.99 | 850 | 828 | 209.7 |
| A | 12 | 115 | 446271 | 2124.67 | 850 | 828 | 209.7 |
| B | 0 | 197 | 221523 | 1198.24 | 851 | 818 | 184.2 |
| B | 0 | 213 | 65442 | 350.85 | 851 | 818 | 184.2 |
| B | 5 | 185 | 30677 | 162.11 | 851 | 818 | 184.2 |
| C | 6 | 223 | 80632 | 342.75 | 845 | 838 | 232.8 |
| C | 14 | 254 | 51097 | 215.88 | 845 | 838 | 232.8 |
| C | 12 | 250 | 46463 | 195.98 | 845 | 838 | 232.8 |
| D | 11 | 129 | 2951847 | 12929.05 | 805 | 769 | 228.3 |
| D | 3 | 12 | 616239 | 2696.45 | 805 | 769 | 228.3 |
| D | 8 | 245 | 243901 | 1065.19 | 805 | 769 | 228.3 |
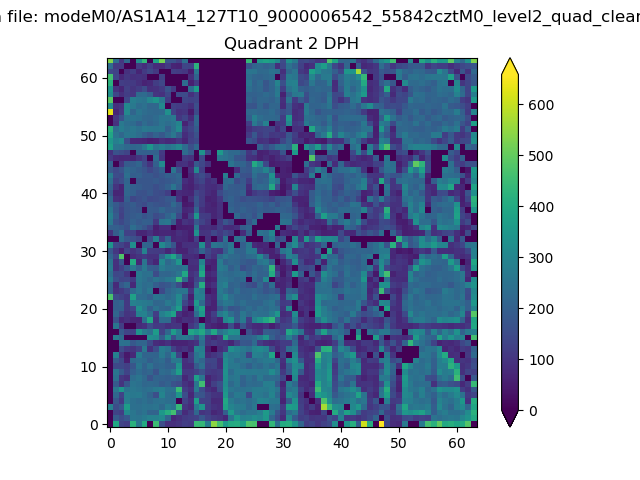
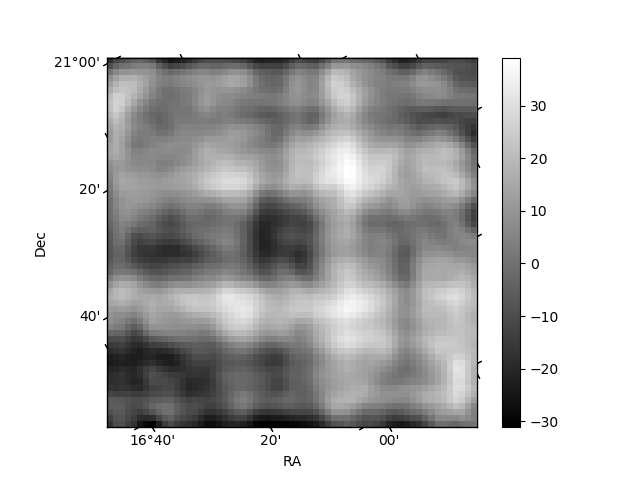
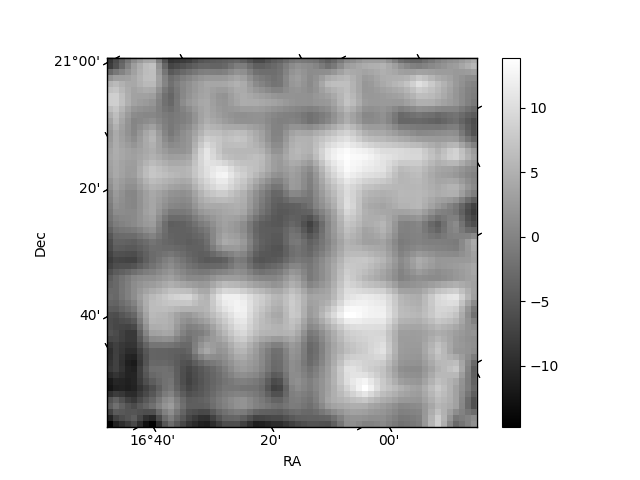
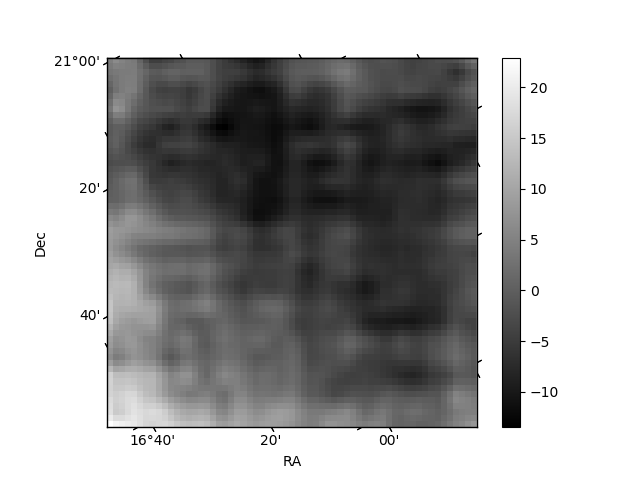
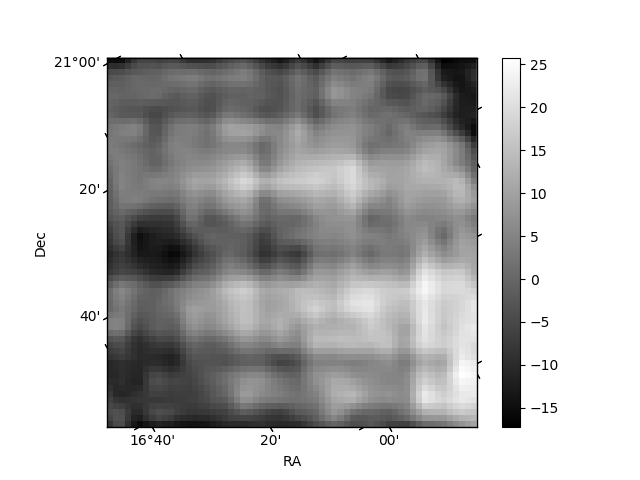
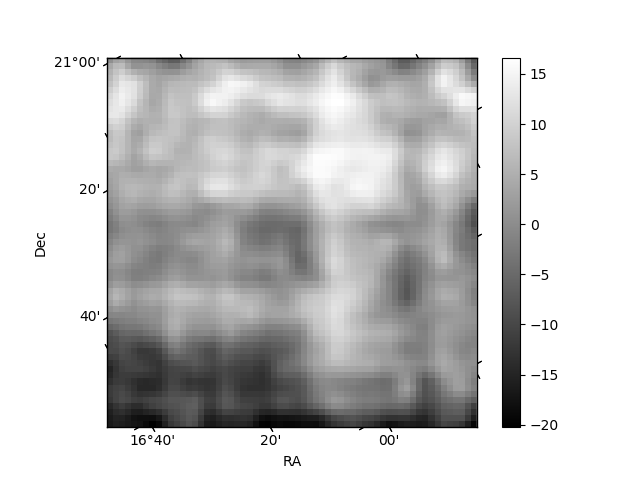
Histogram calculated using DETX and DETY for each event in the final _common_clean file
| Quadrant A | 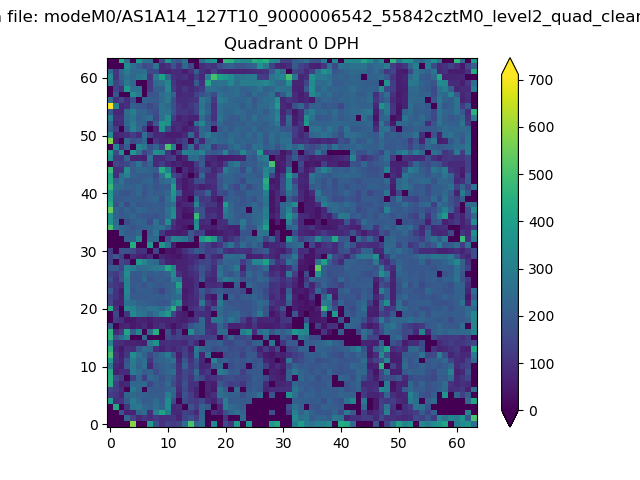 |
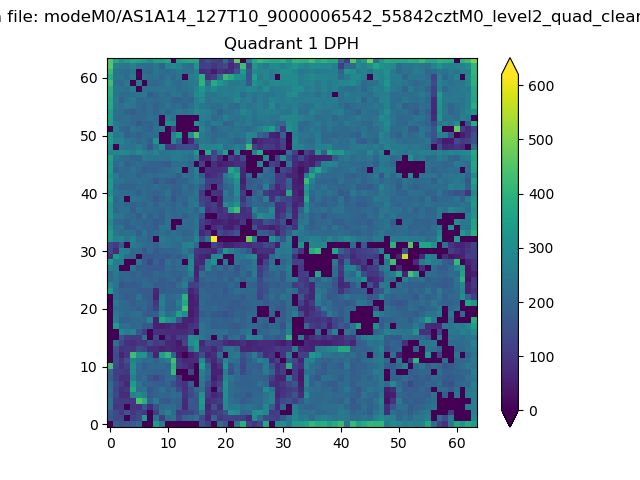 |
Quadrant B |
|---|---|---|---|
| Quadrant D | 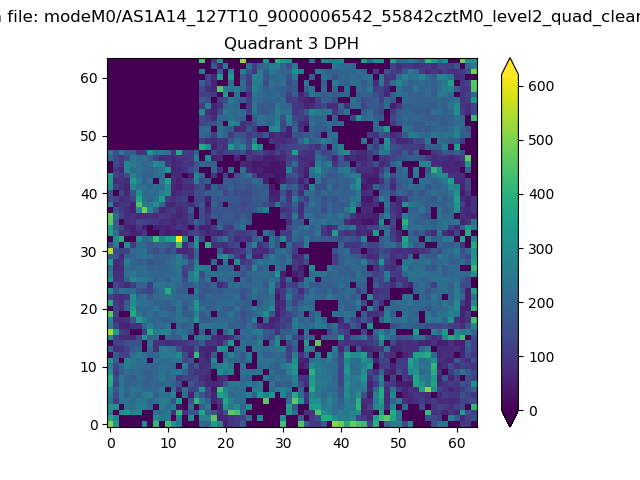 |
 |
Quadrant C |
| Plot type | Count rate plots | Images |
|---|---|---|
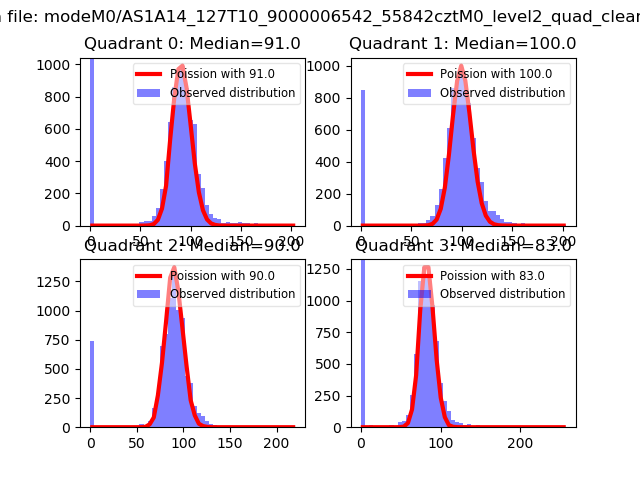
| Comparison with Poisson distribution Blue bars denote a histogram of data divided into 1 sec bins. Red curve is a Poisson curve with rate = median count rate of data. |
 |
 |
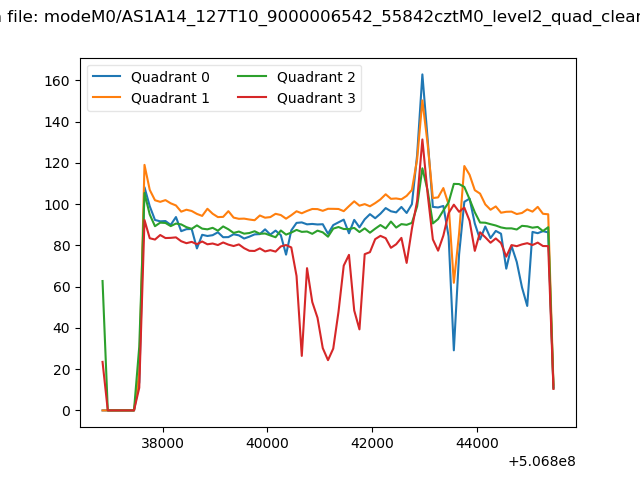
| Quadrant-wise count rates Data is divided into 100 sec bins |
 |
|
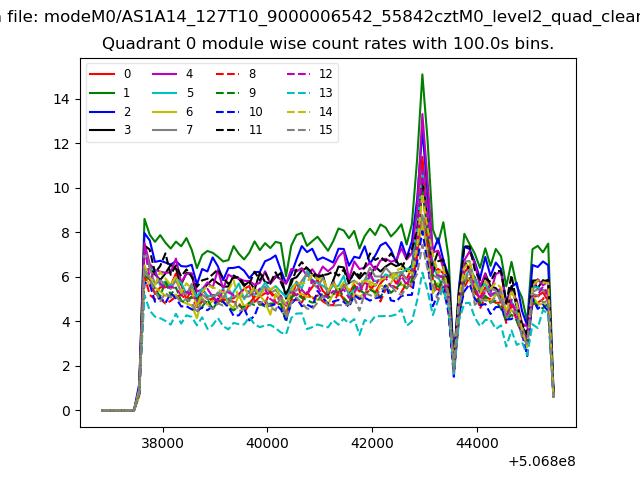
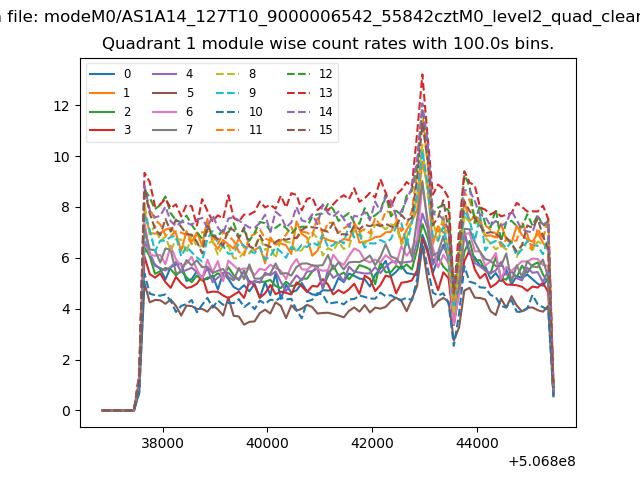
| Module-wise count rates for Quadrant A Data is divided into 100 sec bins |
 |
 |
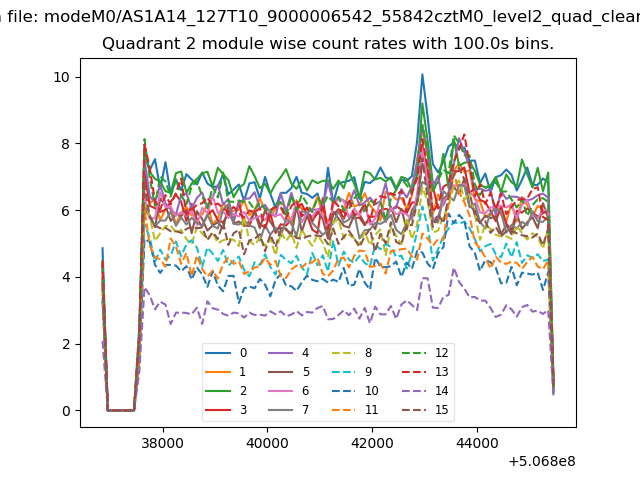
| Module-wise count rates for Quadrant B Data is divided into 100 sec bins |
 |
 |
| Module-wise count rates for Quadrant C Data is divided into 100 sec bins |
 |
 |
| Module-wise count rates for Quadrant D Data is divided into 100 sec bins |
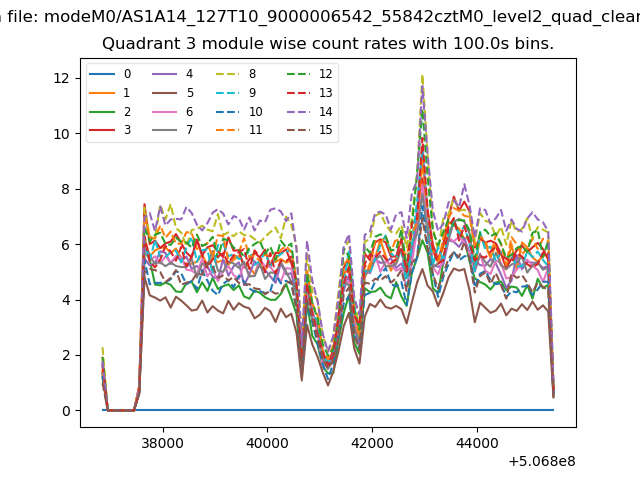 |
 |
| Parameter | Plot |
|---|---|
| CZT HV Monitor | 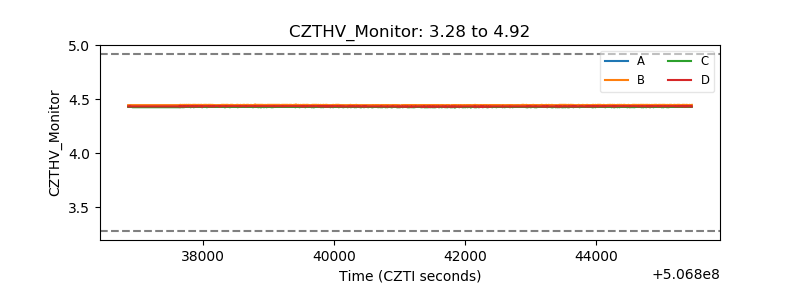 |
| D_VDD | 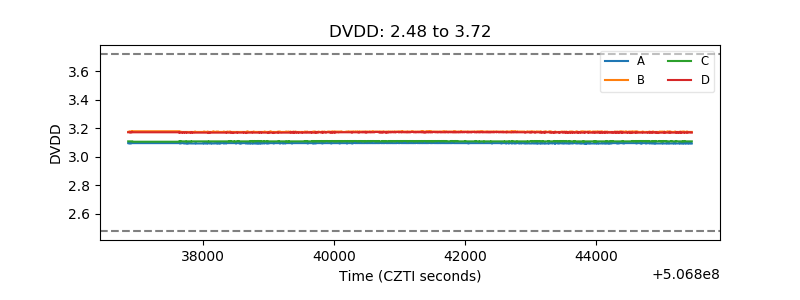 |
| Temperature 1 | 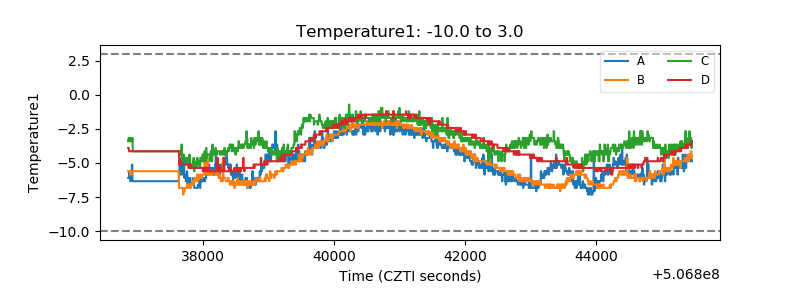 |
| Veto HV Monitor | 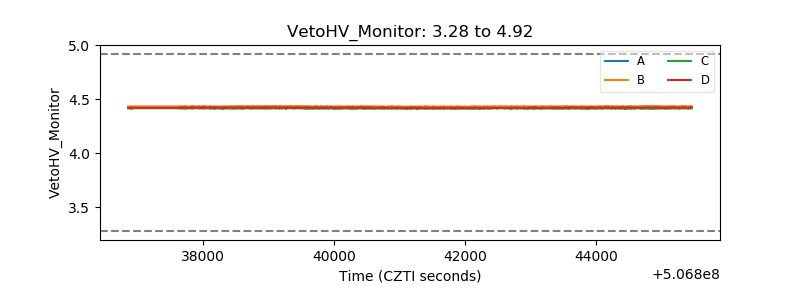 |
| Veto LLD | 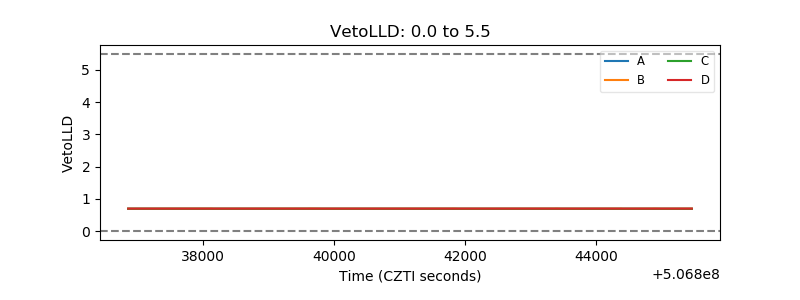 |
| Alpha Counter | 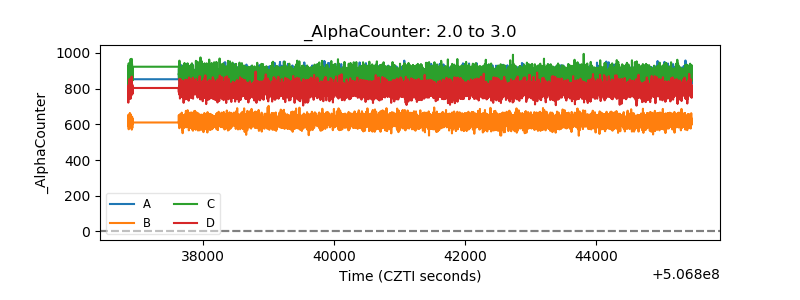 |
| _CPM_Rate | 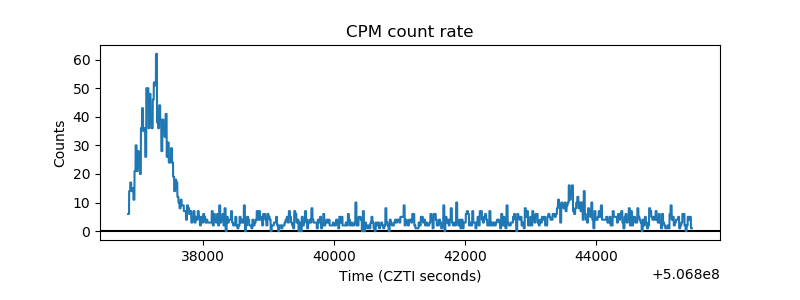 |
| CZT Counter | 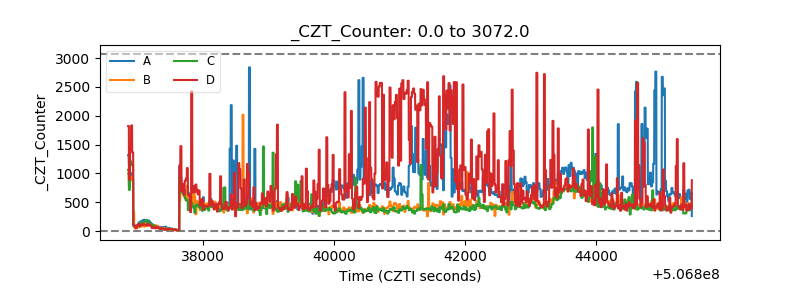 |
| +2.5 Volts monitor |  |
| +5 Volts monitor | 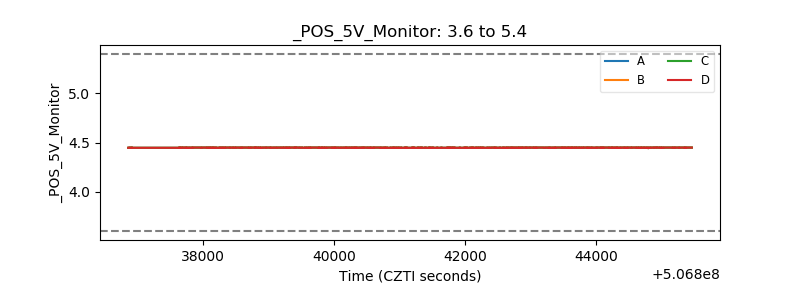 |
| _ROLL_ROT | 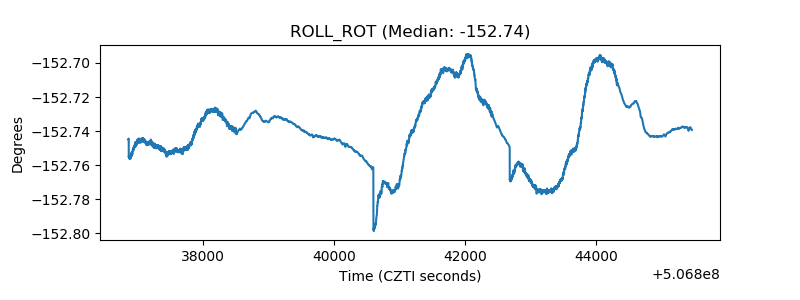 |
| _Roll_DEC | 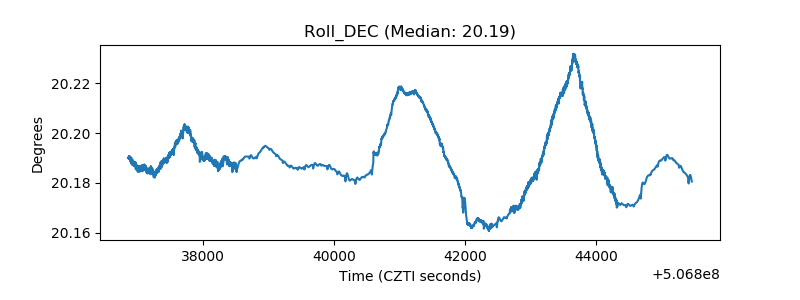 |
| _Roll_RA | 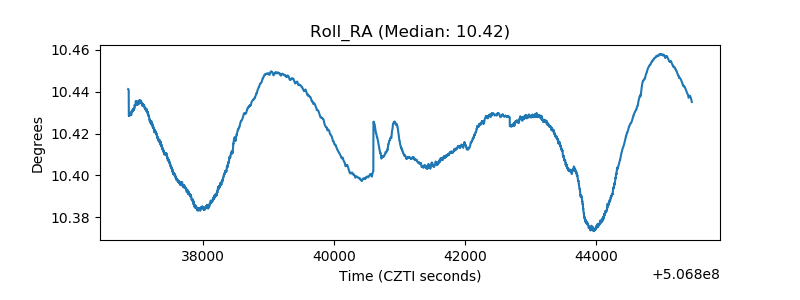 |
| Veto Counter | 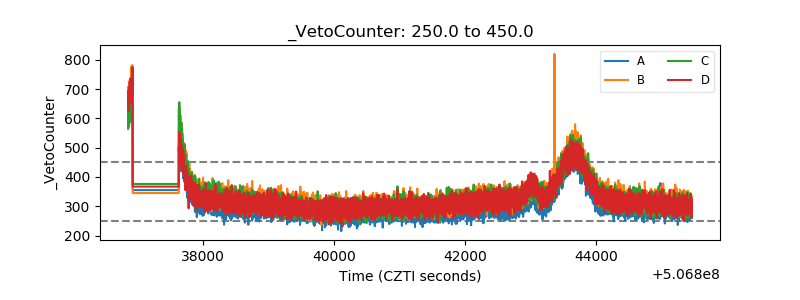 |