| Param | Original file | Final file |
|---|---|---|
| Filename | modeM0/AS1A14_127T10_9000006542_55843cztM0_level2.fits | modeM0/AS1A14_127T10_9000006542_55843cztM0_level2_quad_clean.evt |
| Size (bytes) | 1,382,376,960 | 257,065,920 |
| Size | 1.3 GB | 245.2 MB |
| Events in quadrant A | 14,702,312 | 1,644,211 |
| Events in quadrant B | 8,694,268 | 1,823,899 |
| Events in quadrant C | 8,175,930 | 1,653,208 |
| Events in quadrant D | 18,175,465 | 1,393,139 |
| Mode M0 | |||
|---|---|---|---|
| Quadrant | BADHDUFLAG | Total packets | Discarded packets |
| A | 0 | 56951 | 1 |
| B | 0 | 38875 | 1 |
| C | 0 | 39057 | 1 |
| D | 0 | 66981 | 1 |
| Mode M9 | |||
|---|---|---|---|
| Quadrant | BADHDUFLAG | Total packets | Discarded packets |
| A | 0 | 7 | 0 |
| B | 0 | 7 | 0 |
| C | 0 | 7 | 0 |
| D | 0 | 7 | 0 |
| Mode SS | |||
|---|---|---|---|
| Quadrant | BADHDUFLAG | Total packets | Discarded packets |
| A | 0 | 370 | 0 |
| B | 0 | 370 | 0 |
| C | 0 | 370 | 0 |
| D | 0 | 370 | 0 |
| Quadrant | Total seconds | Saturated seconds | Saturation percentage |
|---|---|---|---|
| A | 18411 | 996 | 5.409809% |
| B | 18411 | 335 | 1.819564% |
| C | 18411 | 118 | 0.640921% |
| D | 18412 | 2205 | 11.975885% |
Noise dominated data is calculated using 1-second bins in cleaned event files. If a bin has >2000 counts, and if more than 50% of those come from <1% of pixels, then it is considered to be noise-dominated and hence unusable.
| Quadrant | # 1 sec bins | Bins with >0 counts | Bins with >2000 counts | High rate bins dominated by noise | Noise dominated (total time) | Noise dominated (detector-on time) | Marked lightcurve |
|---|---|---|---|---|---|---|---|
| A | 19116 | 18411 | 646 | 646 | 3.38% | 3.51% | 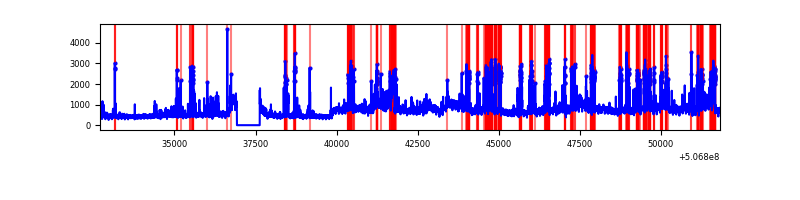 |
| B | 19116 | 18411 | 23 | 23 | 0.12% | 0.12% | 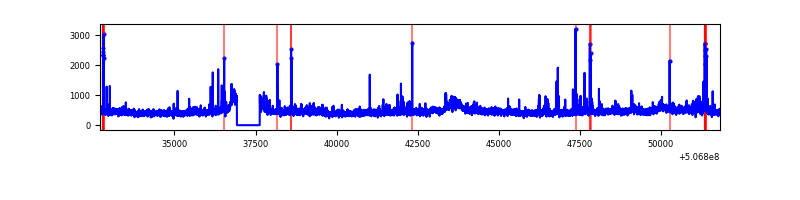 |
| C | 19116 | 18411 | 55 | 55 | 0.29% | 0.30% | 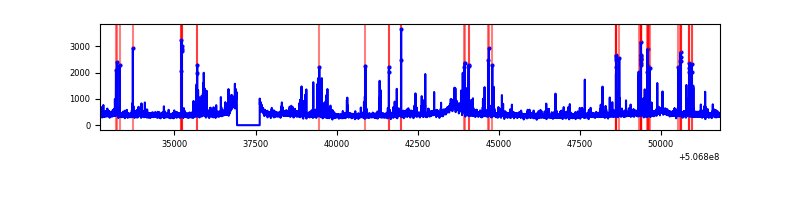 |
| D | 19116 | 18411 | 2122 | 2122 | 11.10% | 11.53% | 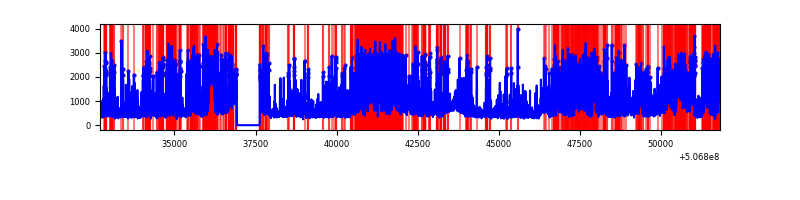 |
Top three noisy pixels from each quadrant. If the there are fewer than three noisy pixels in the level2.evt file, extra rows are filled as -1
| Pixel properties | Quadrant properties | ||||||
|---|---|---|---|---|---|---|---|
| Quadrant | DetID | PixID | Counts | Sigma | Mean | Median | Sigma |
| A | 7 | 64 | 3233595 | 6818.3 | 1914 | 1866 | 474.0 |
| A | 0 | 8 | 1663621 | 3505.97 | 1914 | 1866 | 474.0 |
| A | 8 | 192 | 755160 | 1589.3 | 1914 | 1866 | 474.0 |
| B | 0 | 197 | 467048 | 1120.04 | 1919 | 1844 | 415.3 |
| B | 5 | 185 | 192020 | 457.87 | 1919 | 1844 | 415.3 |
| B | 0 | 213 | 129624 | 307.65 | 1919 | 1844 | 415.3 |
| C | 6 | 223 | 256061 | 490.8 | 1892 | 1873 | 517.9 |
| C | 4 | 192 | 97552 | 184.74 | 1892 | 1873 | 517.9 |
| C | 12 | 252 | 87315 | 164.98 | 1892 | 1873 | 517.9 |
| D | 11 | 129 | 7641125 | 14917.96 | 1801 | 1720 | 512.1 |
| D | 8 | 245 | 1801142 | 3513.85 | 1801 | 1720 | 512.1 |
| D | 3 | 12 | 1094039 | 2133.04 | 1801 | 1720 | 512.1 |
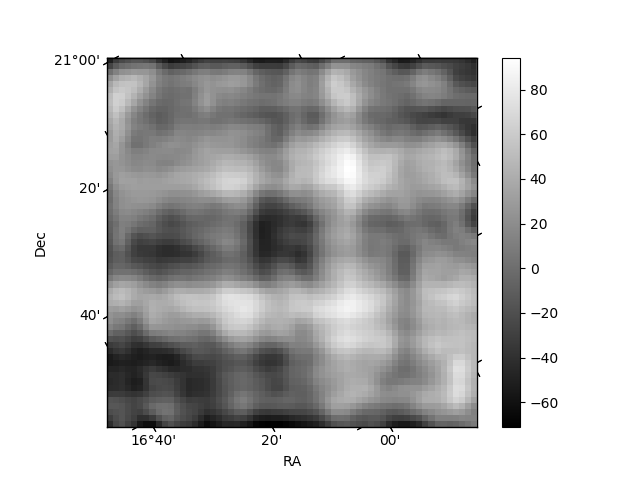
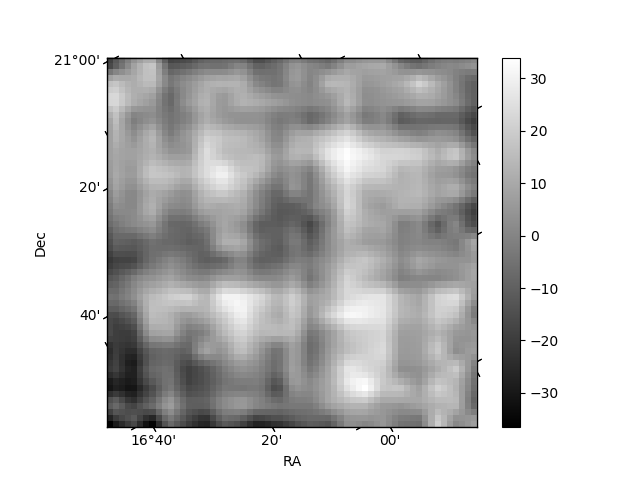
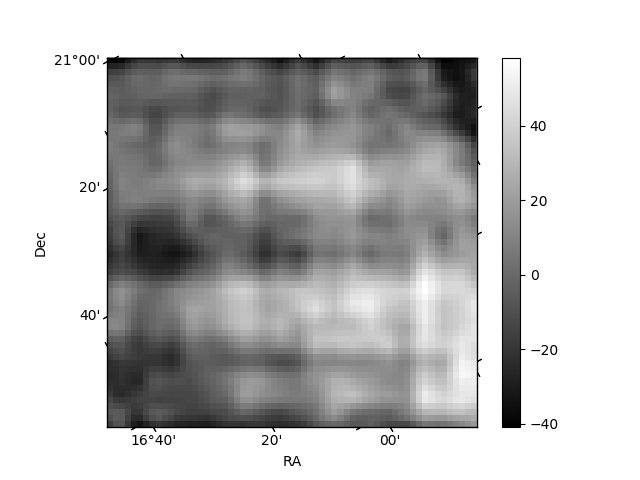
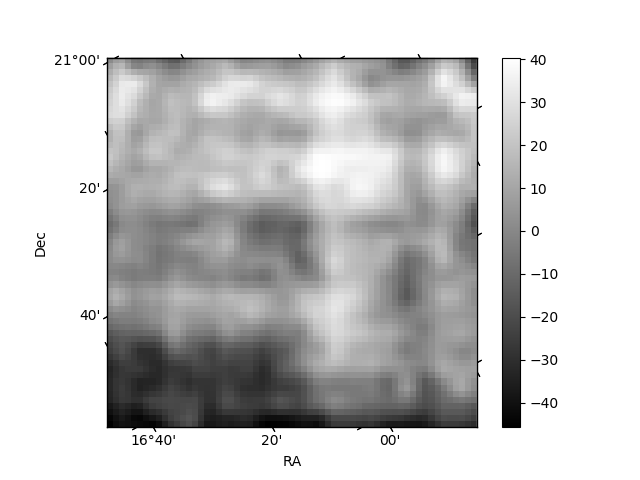
Histogram calculated using DETX and DETY for each event in the final _common_clean file
| Quadrant A | 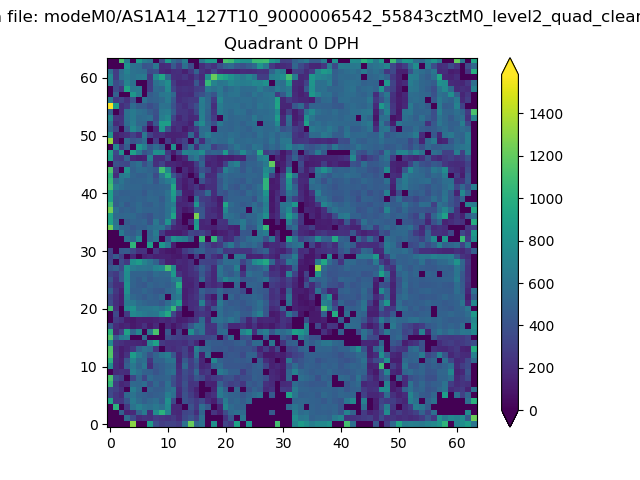 |
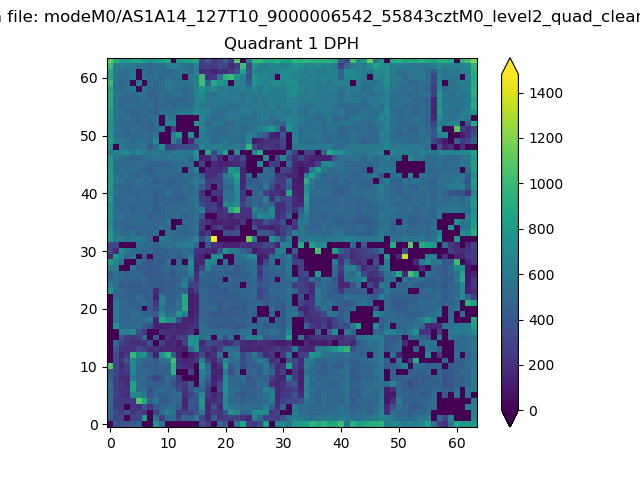 |
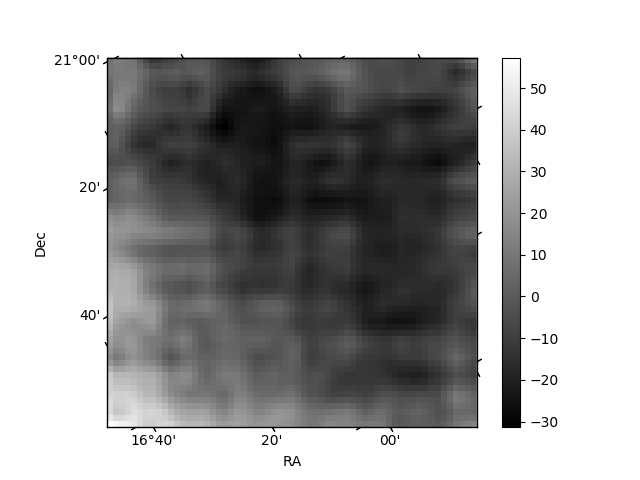
Quadrant B |
|---|---|---|---|
| Quadrant D | 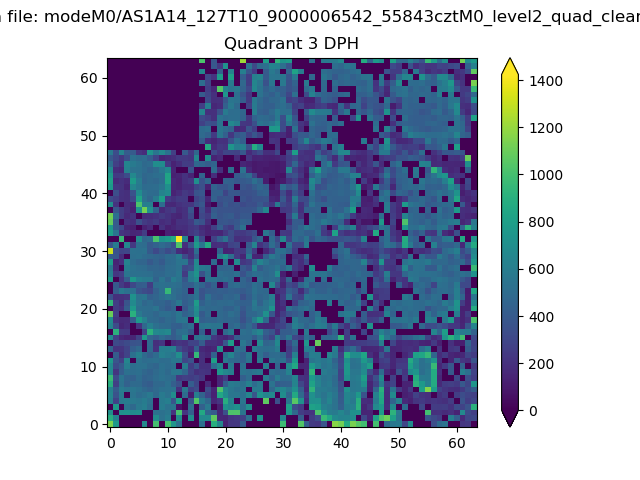 |
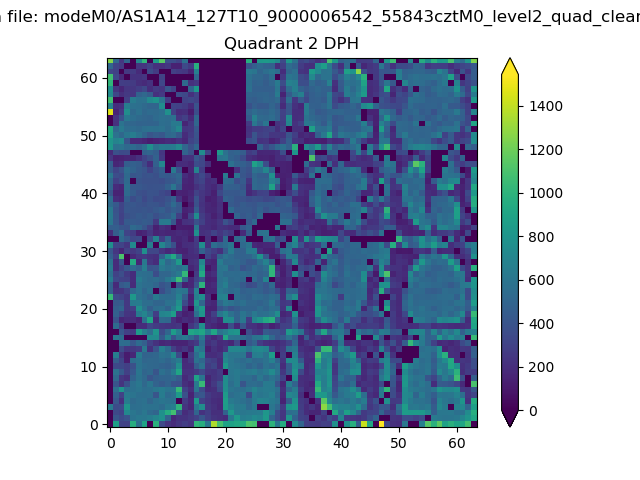 |
Quadrant C |
| Plot type | Count rate plots | Images |
|---|---|---|
| Comparison with Poisson distribution Blue bars denote a histogram of data divided into 1 sec bins. Red curve is a Poisson curve with rate = median count rate of data. |
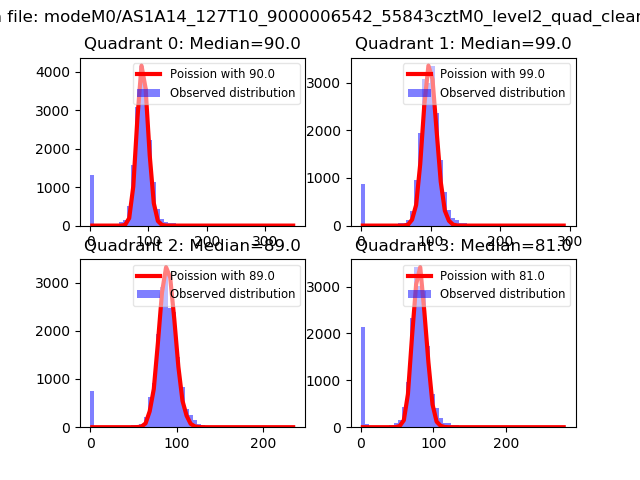 |
 |
| Quadrant-wise count rates Data is divided into 100 sec bins |
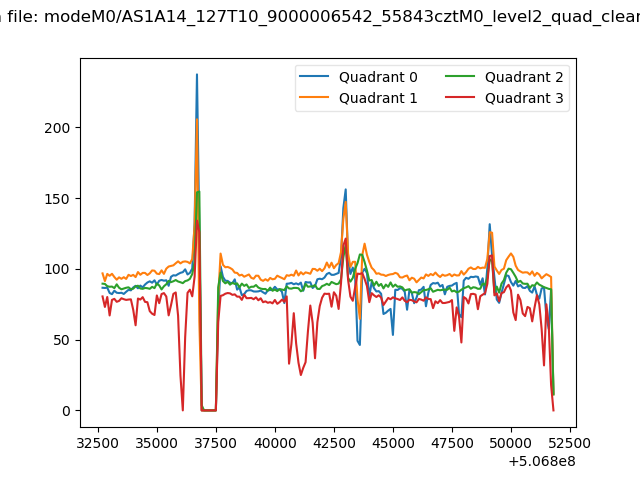 |
|
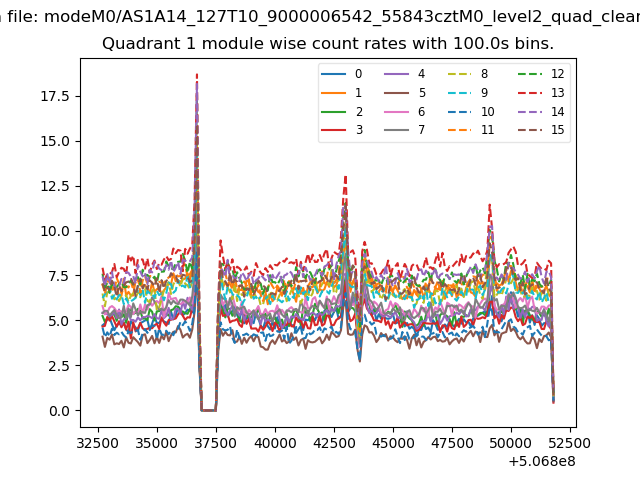
| Module-wise count rates for Quadrant A Data is divided into 100 sec bins |
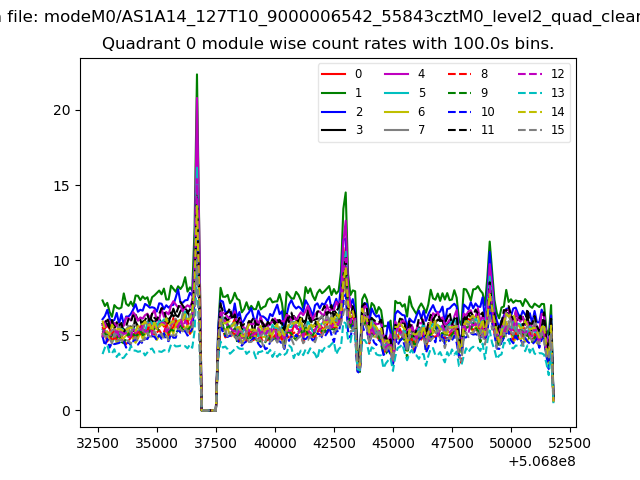 |
 |
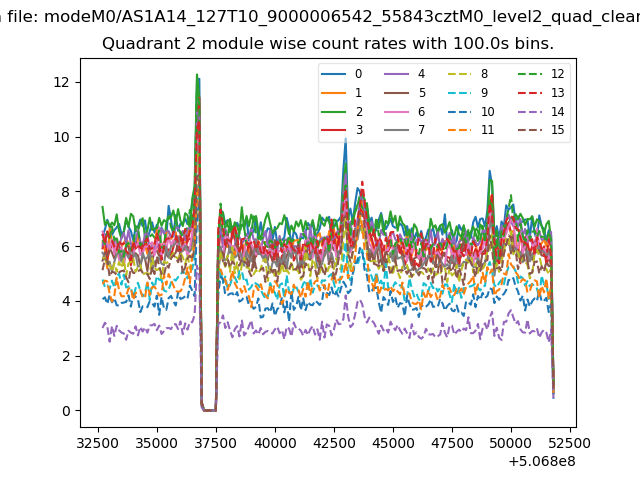
| Module-wise count rates for Quadrant B Data is divided into 100 sec bins |
 |
 |
| Module-wise count rates for Quadrant C Data is divided into 100 sec bins |
 |
 |
| Module-wise count rates for Quadrant D Data is divided into 100 sec bins |
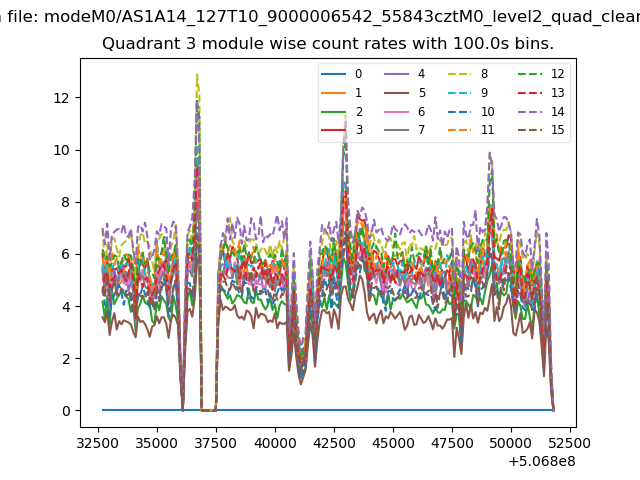 |
 |
| Parameter | Plot |
|---|---|
| CZT HV Monitor | 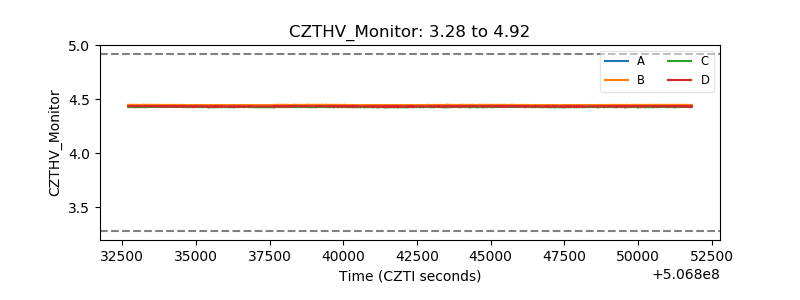 |
| D_VDD | 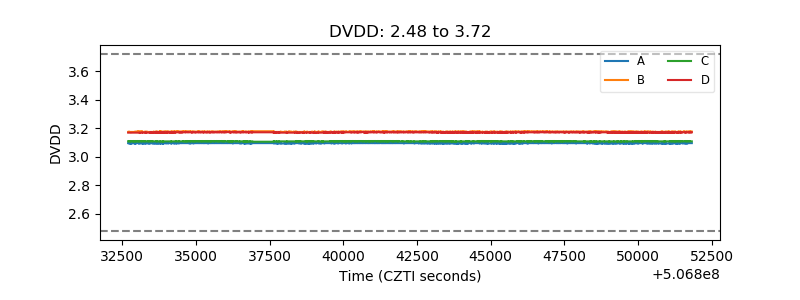 |
| Temperature 1 | 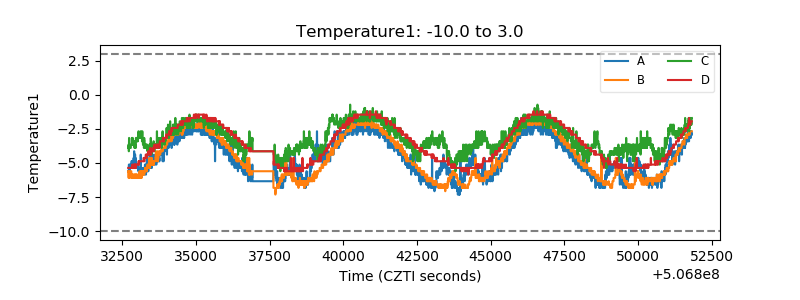 |
| Veto HV Monitor | 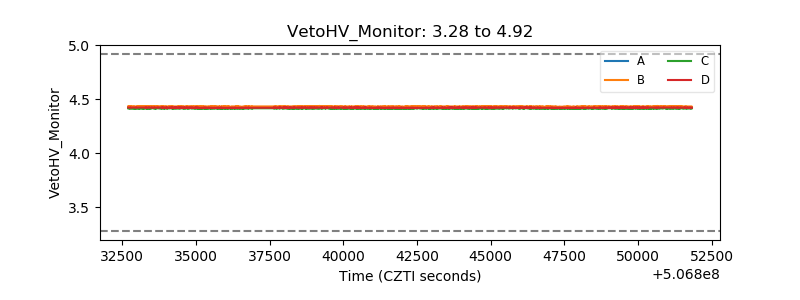 |
| Veto LLD | 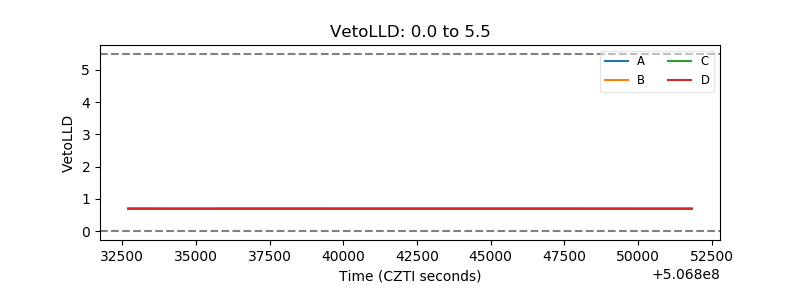 |
| Alpha Counter | 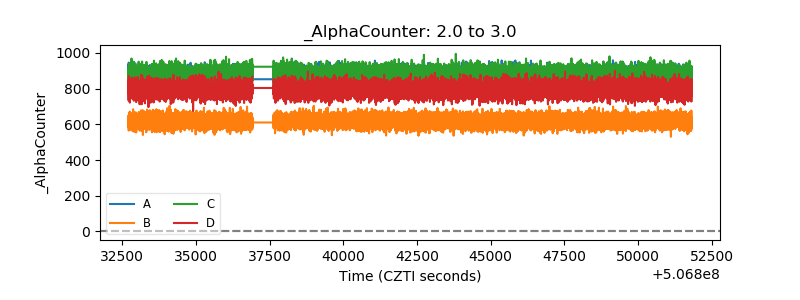 |
| _CPM_Rate | 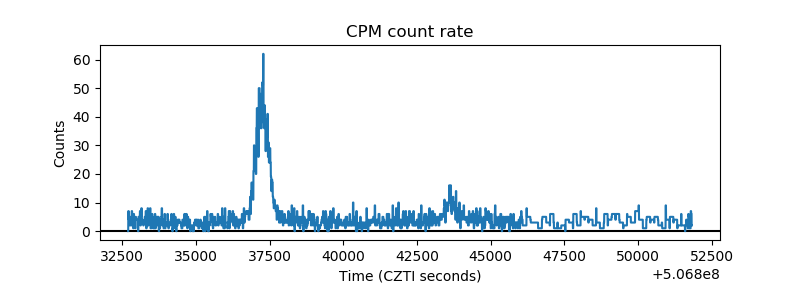 |
| CZT Counter | 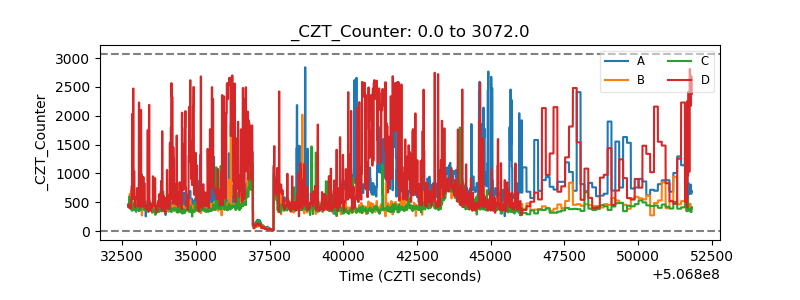 |
| +2.5 Volts monitor | 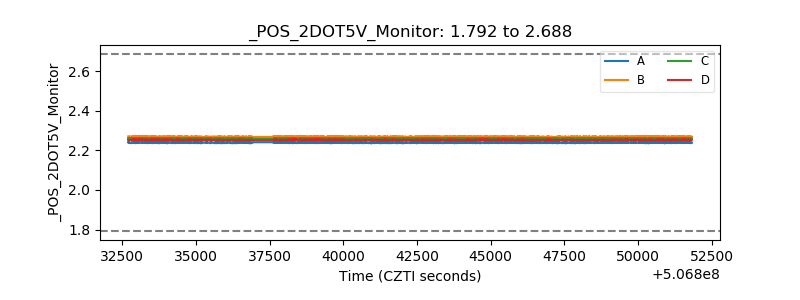 |
| +5 Volts monitor | 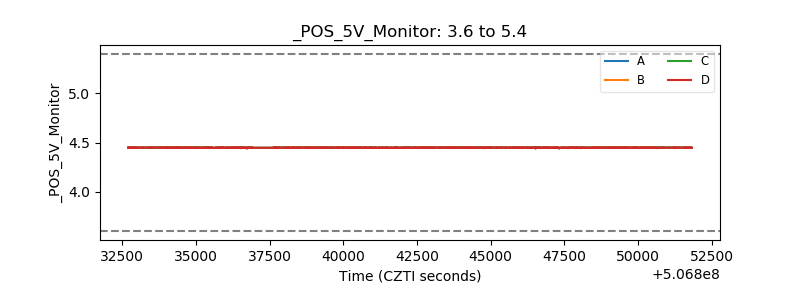 |
| _ROLL_ROT | 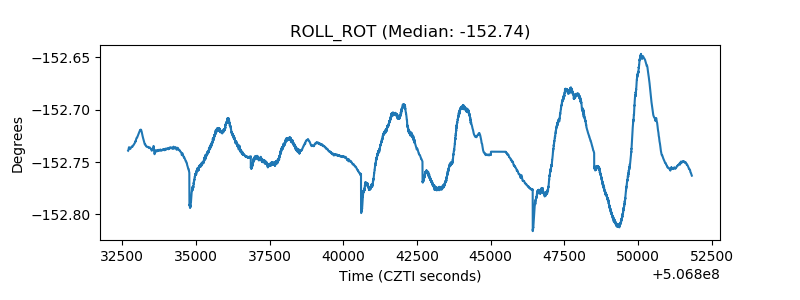 |
| _Roll_DEC | 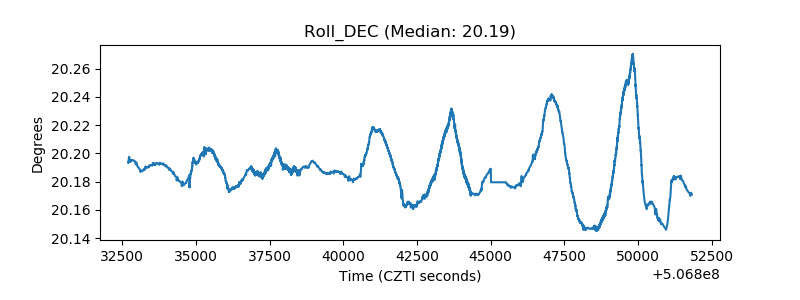 |
| _Roll_RA | 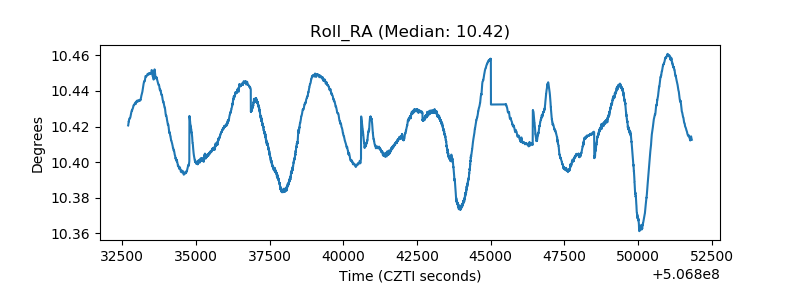 |
| Veto Counter | 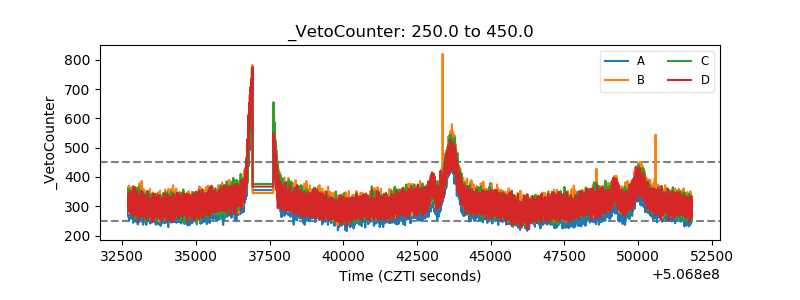 |