| Param | Original file | Final file |
|---|---|---|
| Filename | modeM0/AS1A14_127T10_9000006542_55844cztM0_level2.fits | modeM0/AS1A14_127T10_9000006542_55844cztM0_level2_quad_clean.evt |
| Size (bytes) | 719,369,280 | 104,633,280 |
| Size | 686.0 MB | 99.8 MB |
| Events in quadrant A | 5,613,567 | 717,943 |
| Events in quadrant B | 3,703,174 | 789,460 |
| Events in quadrant C | 3,806,987 | 706,289 |
| Events in quadrant D | 12,882,642 | 396,883 |
| Mode M0 | |||
|---|---|---|---|
| Quadrant | BADHDUFLAG | Total packets | Discarded packets |
| A | 0 | 22217 | 0 |
| B | 0 | 16748 | 0 |
| C | 0 | 17641 | 0 |
| D | 0 | 43808 | 0 |
| Mode SS | |||
|---|---|---|---|
| Quadrant | BADHDUFLAG | Total packets | Discarded packets |
| A | 0 | 160 | 0 |
| B | 0 | 160 | 0 |
| C | 0 | 160 | 0 |
| D | 0 | 160 | 0 |
| Quadrant | Total seconds | Saturated seconds | Saturation percentage |
|---|---|---|---|
| A | 8020 | 167 | 2.082294% |
| B | 8021 | 24 | 0.299215% |
| C | 8021 | 76 | 0.947513% |
| D | 8021 | 3499 | 43.622990% |
Noise dominated data is calculated using 1-second bins in cleaned event files. If a bin has >2000 counts, and if more than 50% of those come from <1% of pixels, then it is considered to be noise-dominated and hence unusable.
| Quadrant | # 1 sec bins | Bins with >0 counts | Bins with >2000 counts | High rate bins dominated by noise | Noise dominated (total time) | Noise dominated (detector-on time) | Marked lightcurve |
|---|---|---|---|---|---|---|---|
| A | 8020 | 8020 | 156 | 156 | 1.95% | 1.95% | 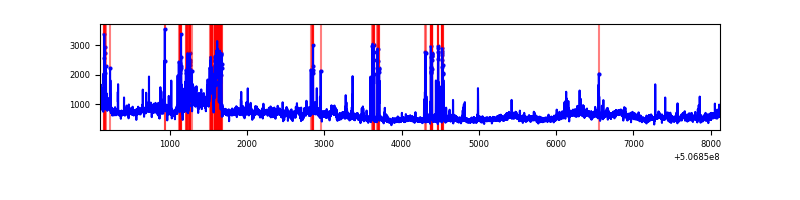 |
| B | 8021 | 8021 | 16 | 16 | 0.20% | 0.20% | 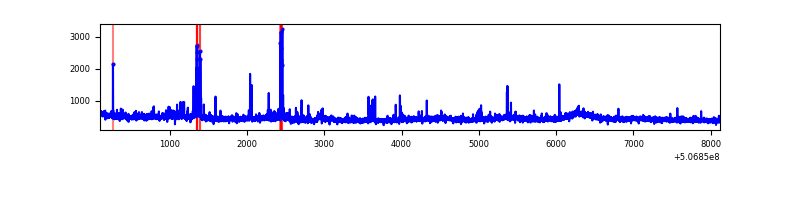 |
| C | 8021 | 8021 | 72 | 72 | 0.90% | 0.90% | 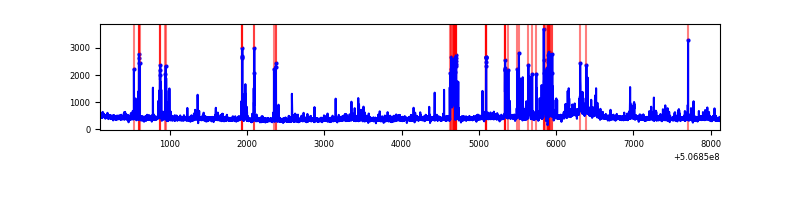 |
| D | 8020 | 8020 | 3265 | 3265 | 40.71% | 40.71% | 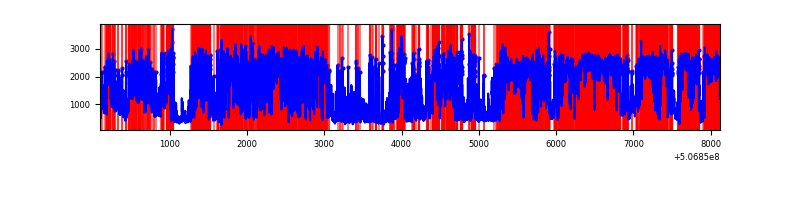 |
Top three noisy pixels from each quadrant. If the there are fewer than three noisy pixels in the level2.evt file, extra rows are filled as -1
| Pixel properties | Quadrant properties | ||||||
|---|---|---|---|---|---|---|---|
| Quadrant | DetID | PixID | Counts | Sigma | Mean | Median | Sigma |
| A | 7 | 64 | 1187046 | 5862.48 | 821 | 799 | 202.3 |
| A | 4 | 249 | 450536 | 2222.62 | 821 | 799 | 202.3 |
| A | 0 | 8 | 291329 | 1435.81 | 821 | 799 | 202.3 |
| B | 5 | 185 | 139062 | 776.37 | 819 | 790 | 178.1 |
| B | 0 | 197 | 98103 | 546.39 | 819 | 790 | 178.1 |
| B | 12 | 0 | 87438 | 486.51 | 819 | 790 | 178.1 |
| C | 12 | 252 | 221457 | 995.17 | 804 | 798 | 221.7 |
| C | 6 | 223 | 189769 | 852.26 | 804 | 798 | 221.7 |
| C | 12 | 250 | 82509 | 368.52 | 804 | 798 | 221.7 |
| D | 11 | 129 | 8825515 | 51556.65 | 596 | 569 | 171.2 |
| D | 8 | 245 | 826684 | 4826.28 | 596 | 569 | 171.2 |
| D | 3 | 12 | 264431 | 1541.52 | 596 | 569 | 171.2 |
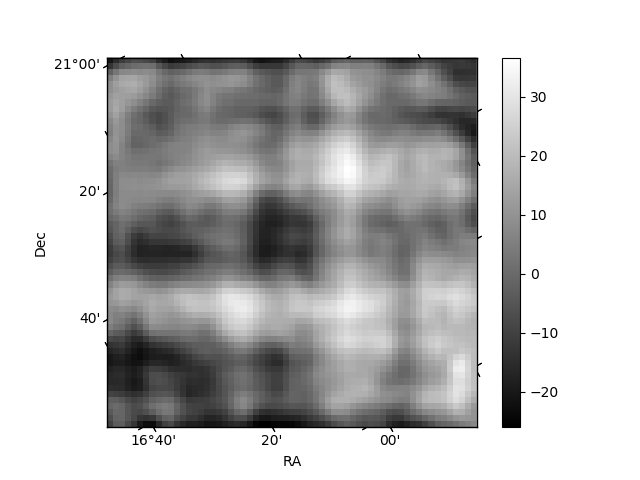
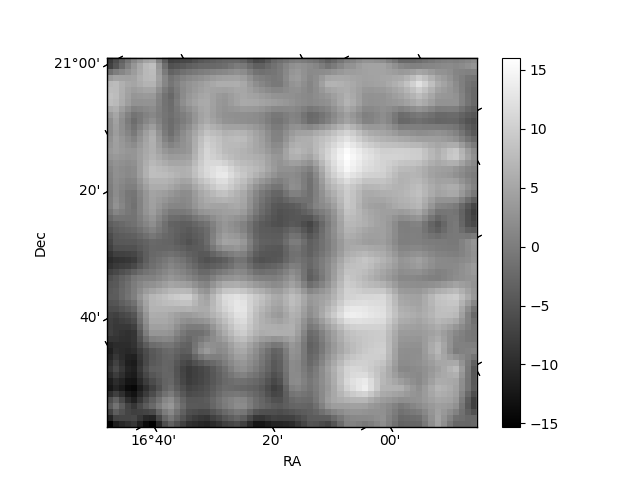
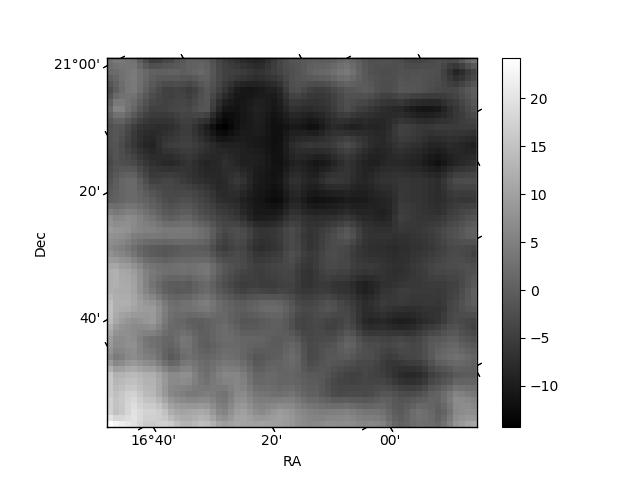
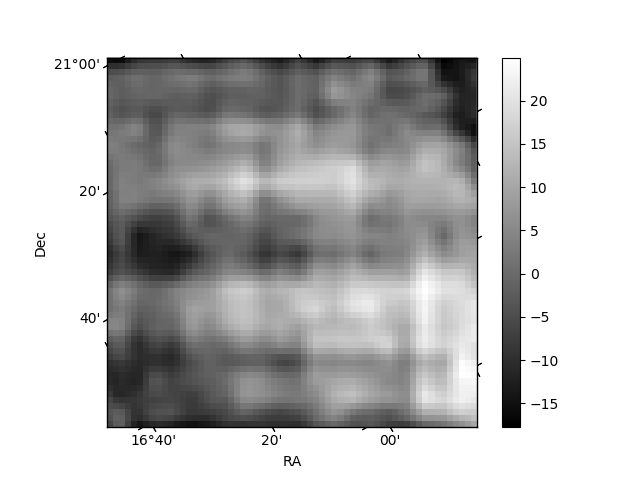
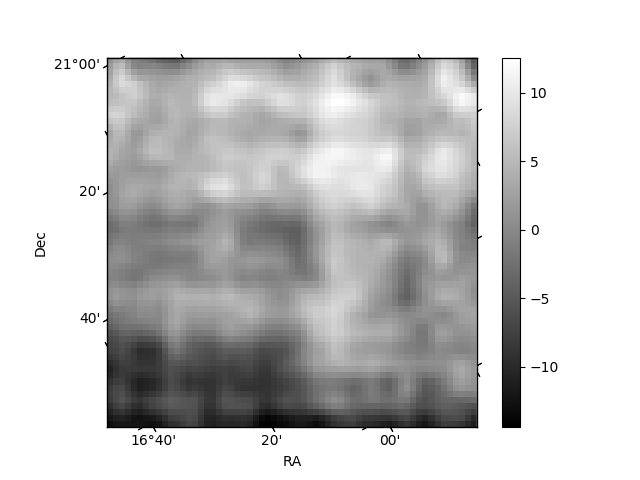
Histogram calculated using DETX and DETY for each event in the final _common_clean file
| Quadrant A | 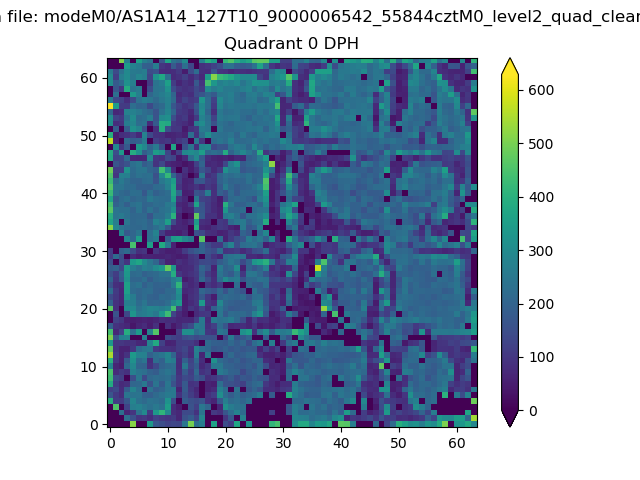 |
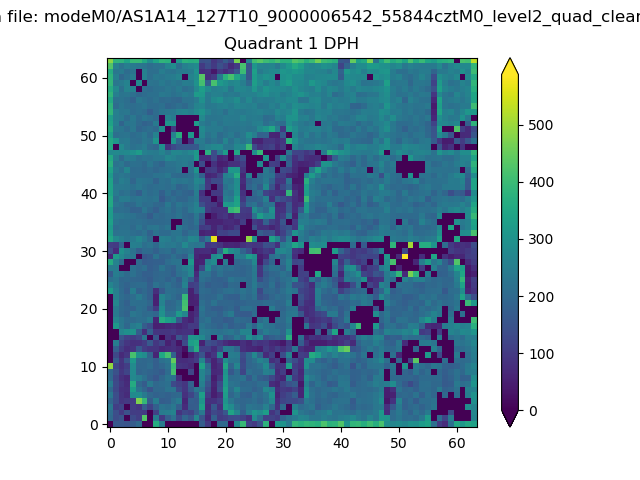 |
Quadrant B |
|---|---|---|---|
| Quadrant D | 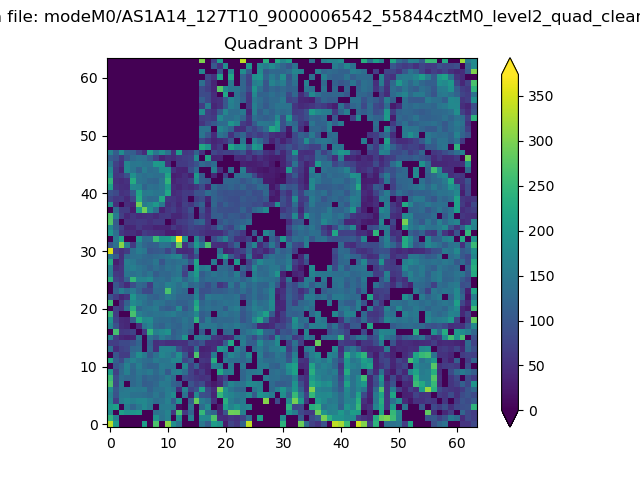 |
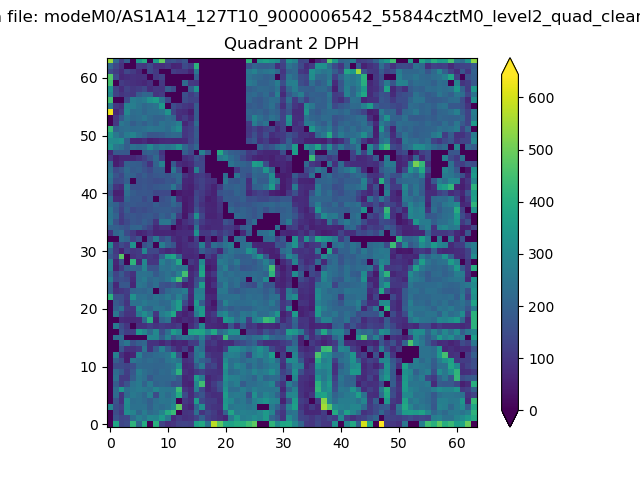 |
Quadrant C |
| Plot type | Count rate plots | Images |
|---|---|---|
| Comparison with Poisson distribution Blue bars denote a histogram of data divided into 1 sec bins. Red curve is a Poisson curve with rate = median count rate of data. |
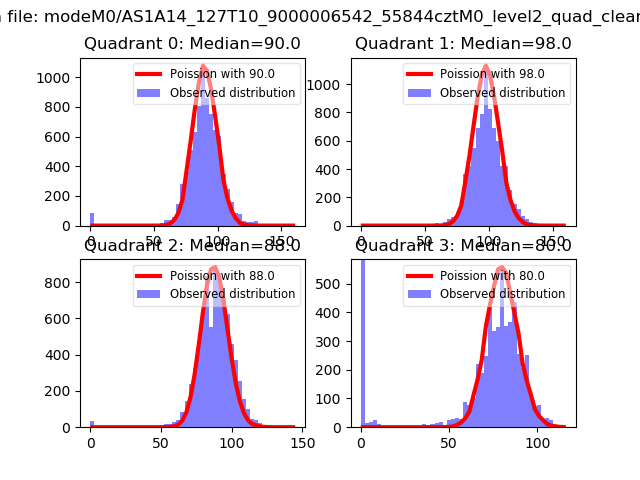 |
 |
| Quadrant-wise count rates Data is divided into 100 sec bins |
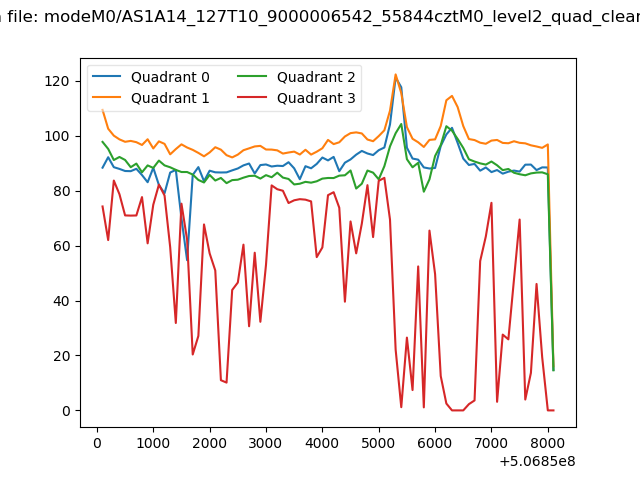 |
|
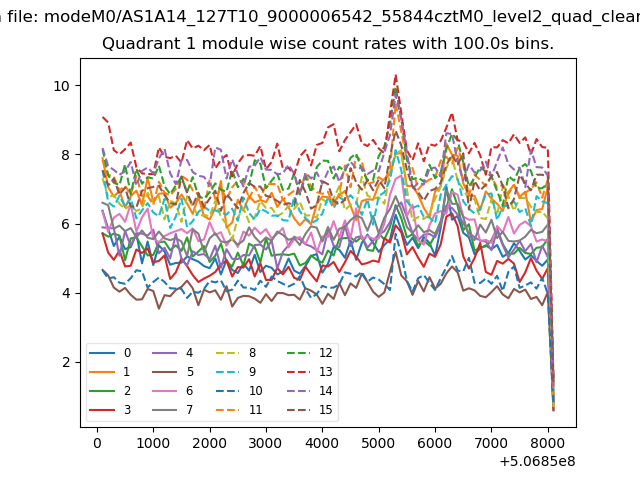
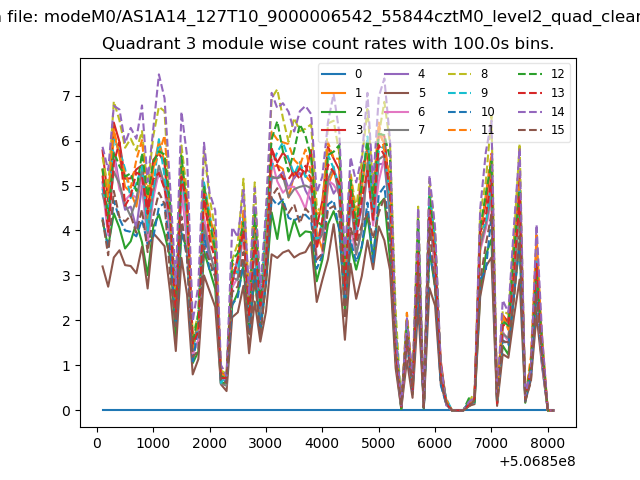
| Module-wise count rates for Quadrant A Data is divided into 100 sec bins |
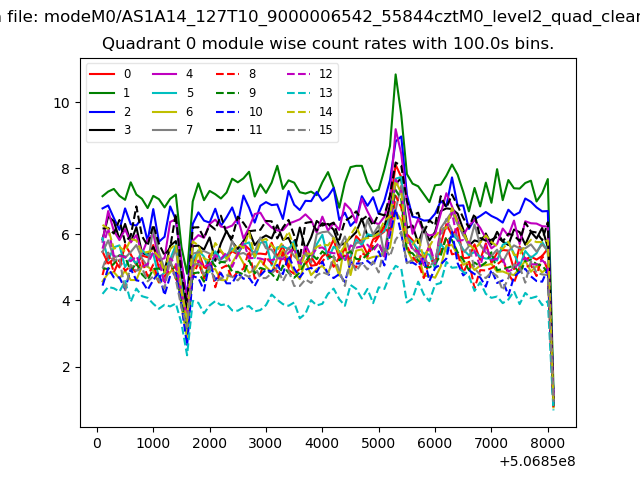 |
 |
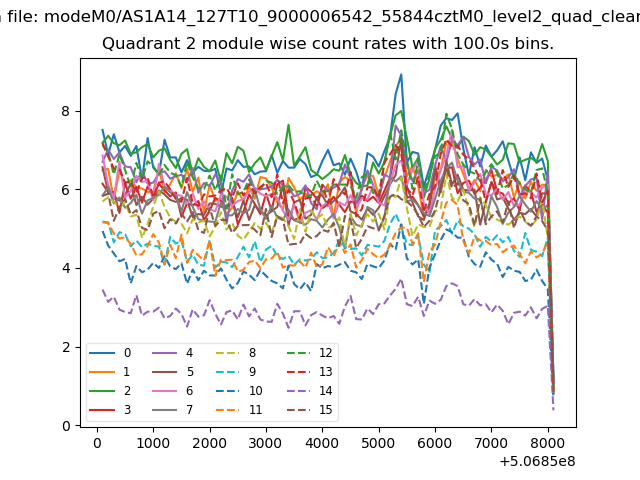
| Module-wise count rates for Quadrant B Data is divided into 100 sec bins |
 |
 |
| Module-wise count rates for Quadrant C Data is divided into 100 sec bins |
 |
 |
| Module-wise count rates for Quadrant D Data is divided into 100 sec bins |
 |
 |
| Parameter | Plot |
|---|---|
| CZT HV Monitor | 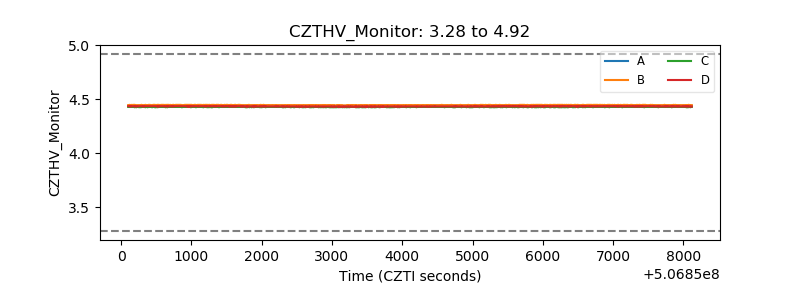 |
| D_VDD | 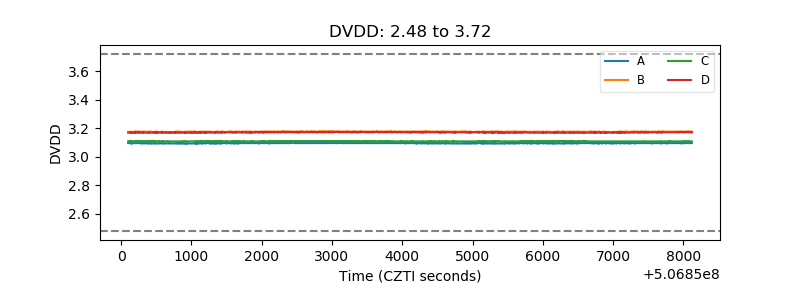 |
| Temperature 1 | 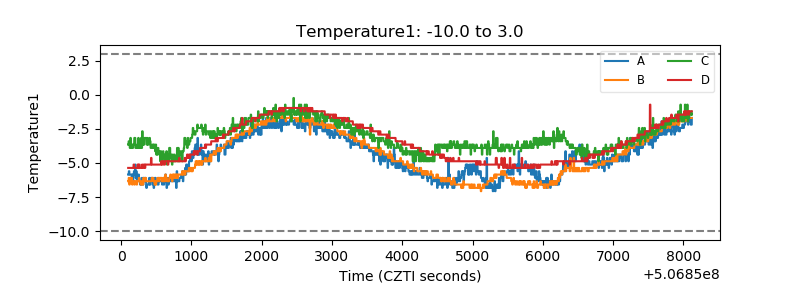 |
| Veto HV Monitor | 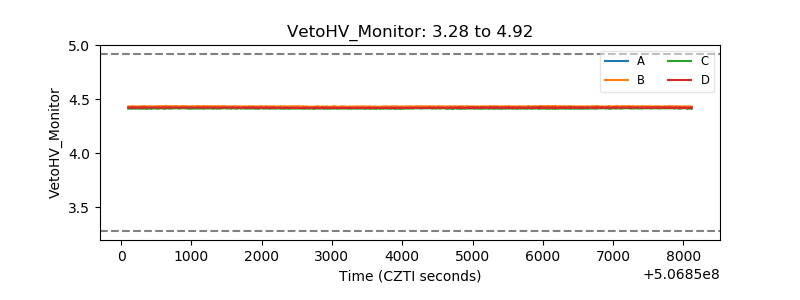 |
| Veto LLD | 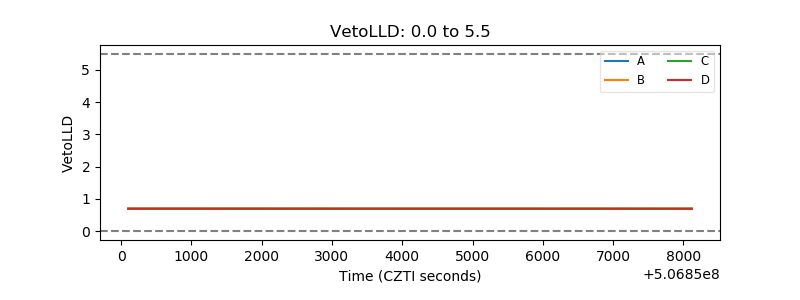 |
| Alpha Counter | 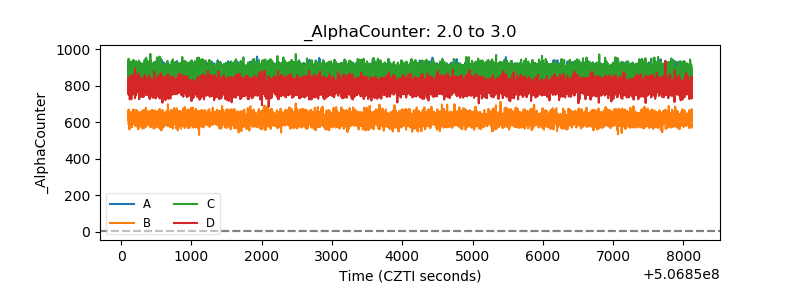 |
| _CPM_Rate | 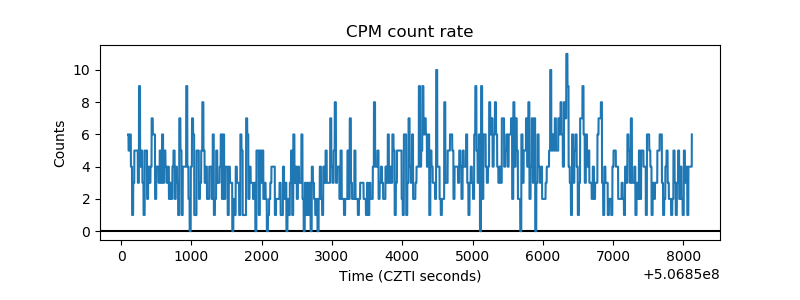 |
| CZT Counter | 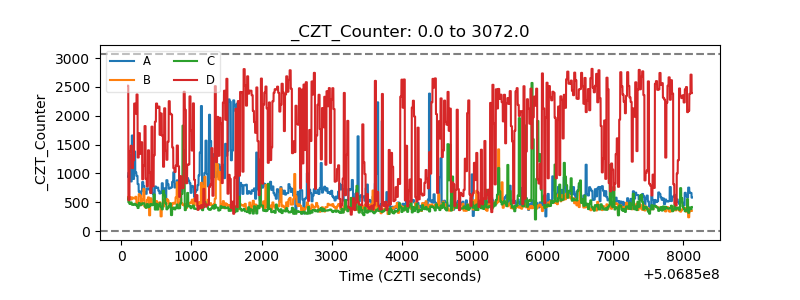 |
| +2.5 Volts monitor | 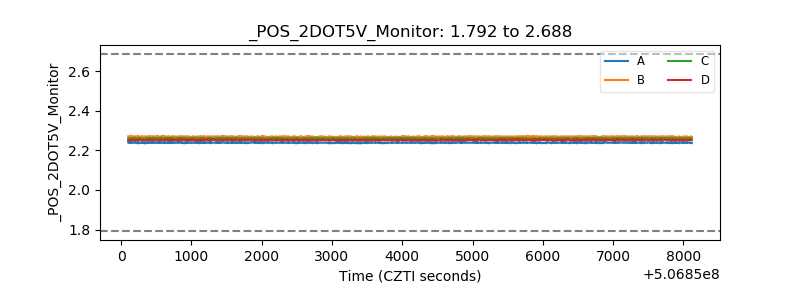 |
| +5 Volts monitor | 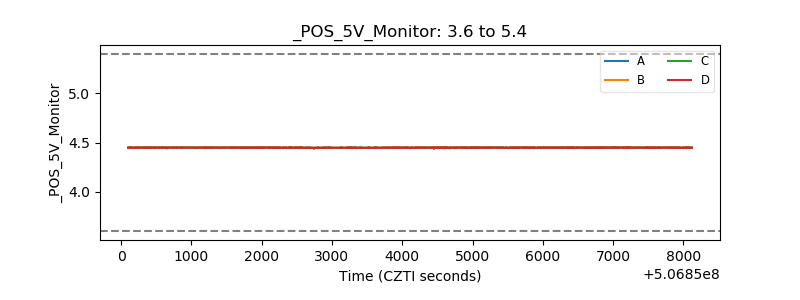 |
| _ROLL_ROT | 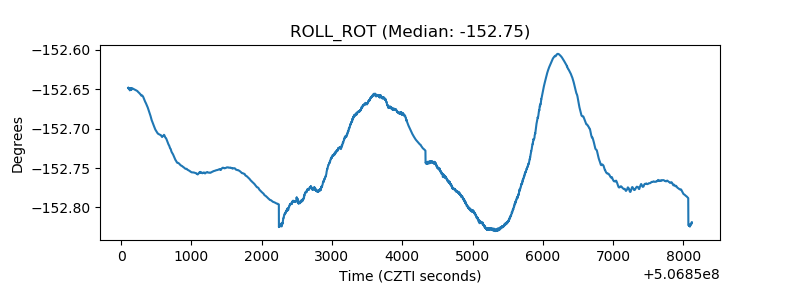 |
| _Roll_DEC | 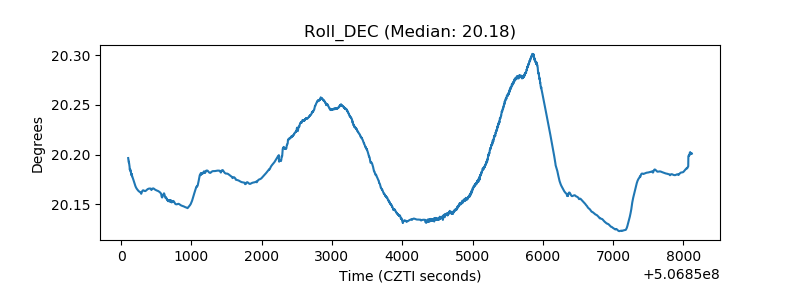 |
| _Roll_RA | 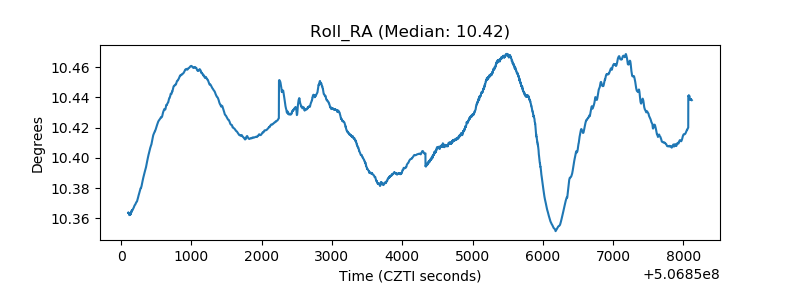 |
| Veto Counter | 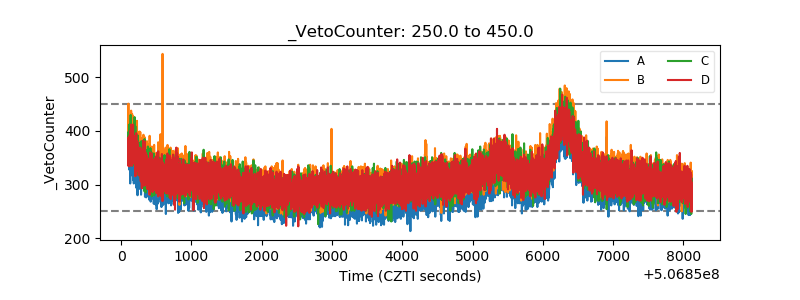 |