| Param | Original file | Final file |
|---|---|---|
| Filename | modeM0/AS1A14_127T10_9000006542_55851cztM0_level2.fits | modeM0/AS1A14_127T10_9000006542_55851cztM0_level2_quad_clean.evt |
| Size (bytes) | 486,936,000 | 92,154,240 |
| Size | 464.4 MB | 87.9 MB |
| Events in quadrant A | 3,213,581 | 629,726 |
| Events in quadrant B | 3,053,940 | 669,302 |
| Events in quadrant C | 3,525,938 | 584,668 |
| Events in quadrant D | 7,730,402 | 457,323 |
| Mode M0 | |||
|---|---|---|---|
| Quadrant | BADHDUFLAG | Total packets | Discarded packets |
| A | 0 | 13890 | 2 |
| B | 0 | 14005 | 2 |
| C | 0 | 15439 | 2 |
| D | 0 | 27486 | 2 |
| Mode M9 | |||
|---|---|---|---|
| Quadrant | BADHDUFLAG | Total packets | Discarded packets |
| A | 0 | 12 | 0 |
| B | 0 | 12 | 0 |
| C | 0 | 13 | 0 |
| D | 0 | 13 | 0 |
| Mode SS | |||
|---|---|---|---|
| Quadrant | BADHDUFLAG | Total packets | Discarded packets |
| A | 0 | 130 | 0 |
| B | 0 | 130 | 0 |
| C | 0 | 130 | 0 |
| D | 0 | 130 | 0 |
| Quadrant | Total seconds | Saturated seconds | Saturation percentage |
|---|---|---|---|
| A | 6442 | 43 | 0.667495% |
| B | 6442 | 78 | 1.210804% |
| C | 6442 | 293 | 4.548277% |
| D | 6442 | 1416 | 21.980751% |
Noise dominated data is calculated using 1-second bins in cleaned event files. If a bin has >2000 counts, and if more than 50% of those come from <1% of pixels, then it is considered to be noise-dominated and hence unusable.
| Quadrant | # 1 sec bins | Bins with >0 counts | Bins with >2000 counts | High rate bins dominated by noise | Noise dominated (total time) | Noise dominated (detector-on time) | Marked lightcurve |
|---|---|---|---|---|---|---|---|
| A | 7547 | 6442 | 24 | 24 | 0.32% | 0.37% | 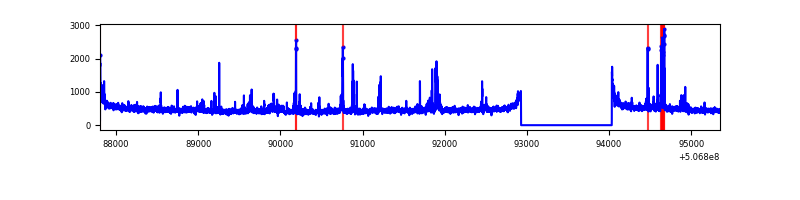 |
| B | 7547 | 6442 | 45 | 45 | 0.60% | 0.70% | 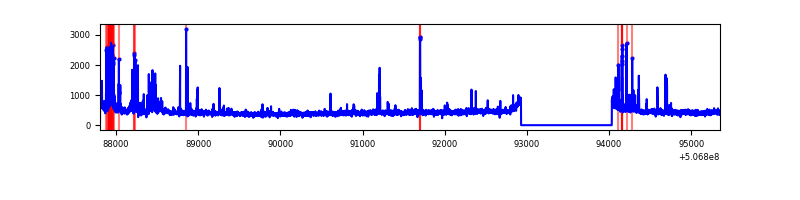 |
| C | 7547 | 6443 | 230 | 230 | 3.05% | 3.57% | 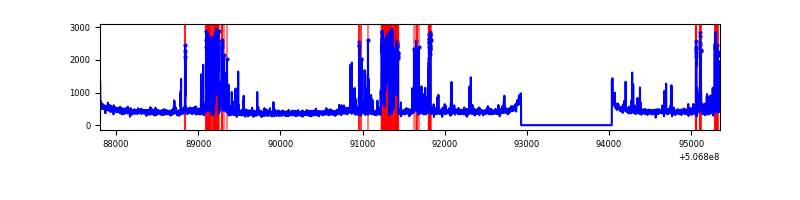 |
| D | 7546 | 6441 | 1472 | 1472 | 19.51% | 22.85% | 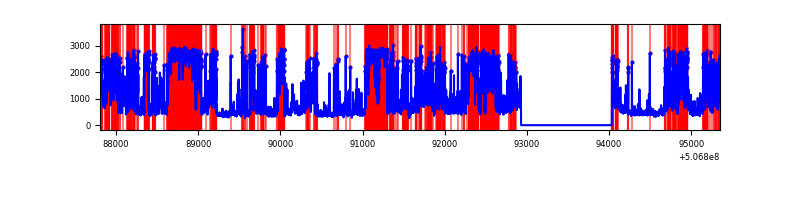 |
Top three noisy pixels from each quadrant. If the there are fewer than three noisy pixels in the level2.evt file, extra rows are filled as -1
| Pixel properties | Quadrant properties | ||||||
|---|---|---|---|---|---|---|---|
| Quadrant | DetID | PixID | Counts | Sigma | Mean | Median | Sigma |
| A | 8 | 192 | 184433 | 1091.71 | 673 | 656 | 168.3 |
| A | 4 | 3 | 99102 | 584.81 | 673 | 656 | 168.3 |
| A | 0 | 8 | 96894 | 571.69 | 673 | 656 | 168.3 |
| B | 5 | 185 | 201108 | 1386.21 | 665 | 640 | 144.6 |
| B | 10 | 247 | 54185 | 370.26 | 665 | 640 | 144.6 |
| B | 5 | 172 | 37811 | 257.03 | 665 | 640 | 144.6 |
| C | 13 | 3 | 385505 | 2167.51 | 644 | 637 | 177.6 |
| C | 6 | 223 | 265913 | 1493.99 | 644 | 637 | 177.6 |
| C | 12 | 254 | 207984 | 1167.74 | 644 | 637 | 177.6 |
| D | 11 | 129 | 3212724 | 18821.27 | 592 | 565 | 170.7 |
| D | 7 | 96 | 1749802 | 10249.45 | 592 | 565 | 170.7 |
| D | 3 | 12 | 124687 | 727.28 | 592 | 565 | 170.7 |
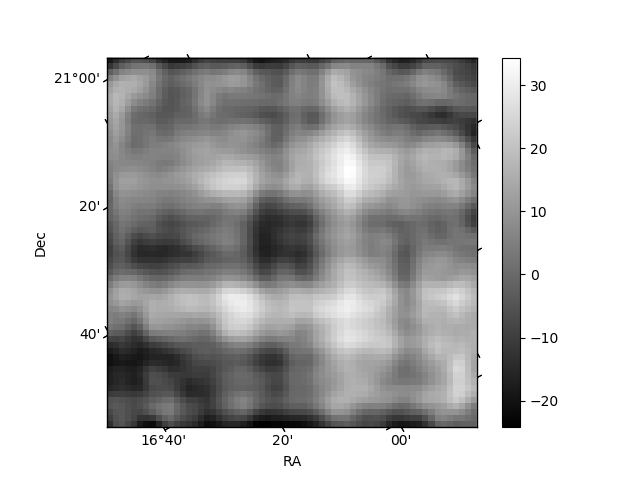
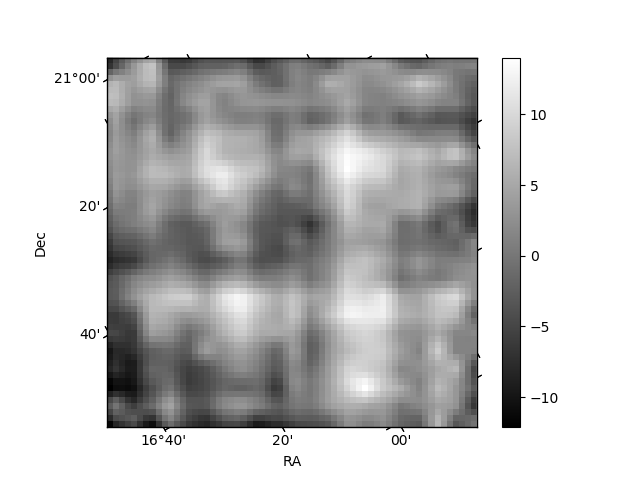
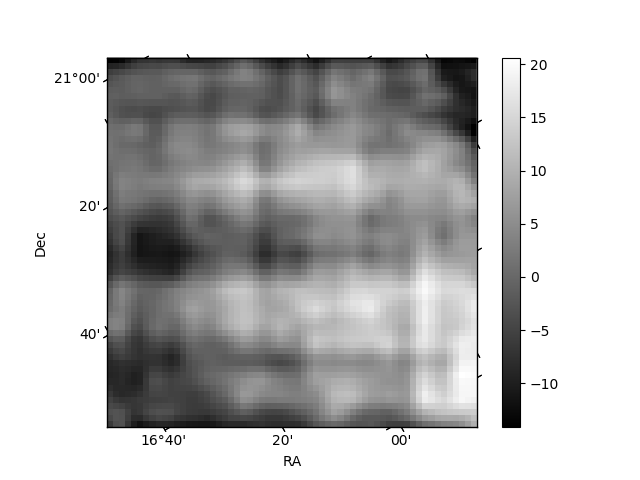
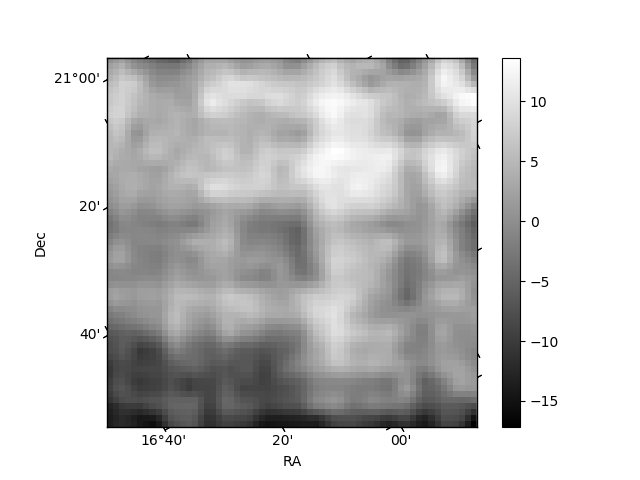
Histogram calculated using DETX and DETY for each event in the final _common_clean file
| Quadrant A | 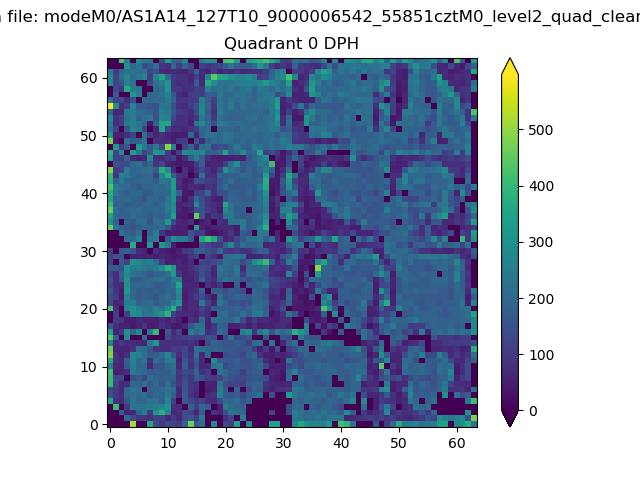 |
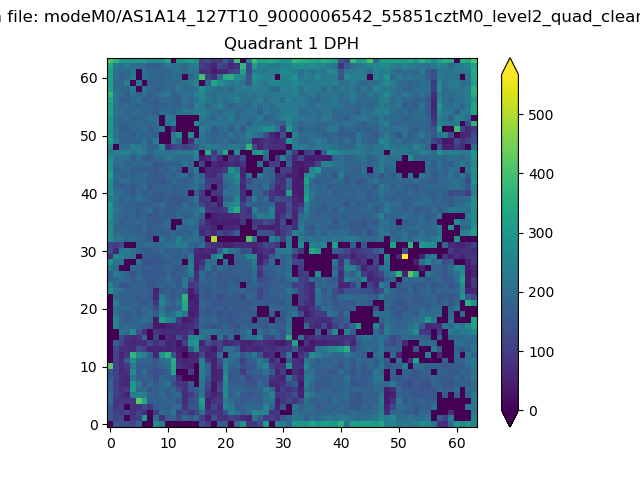 |
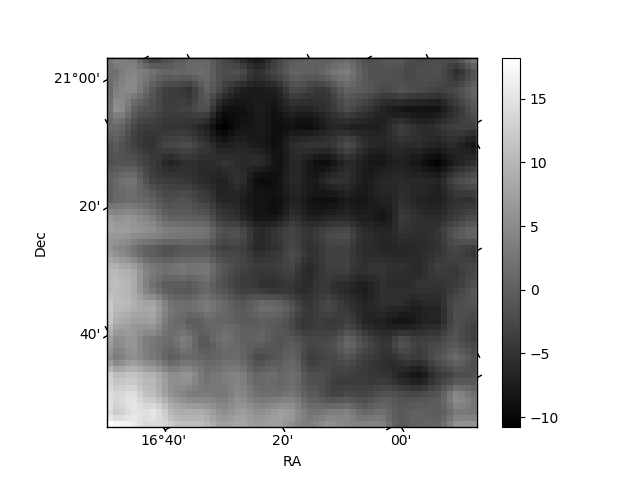
Quadrant B |
|---|---|---|---|
| Quadrant D | 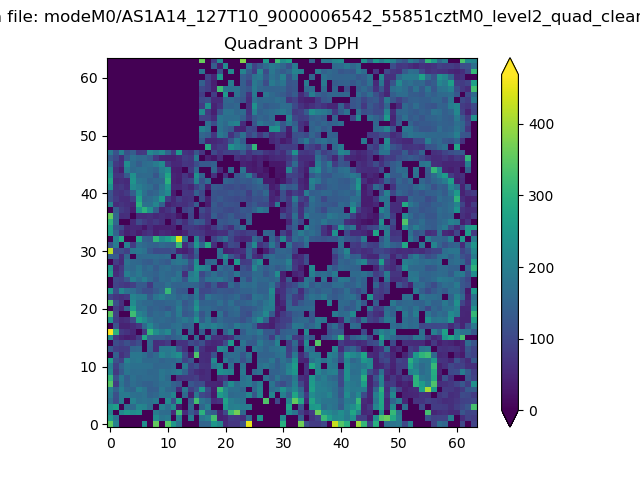 |
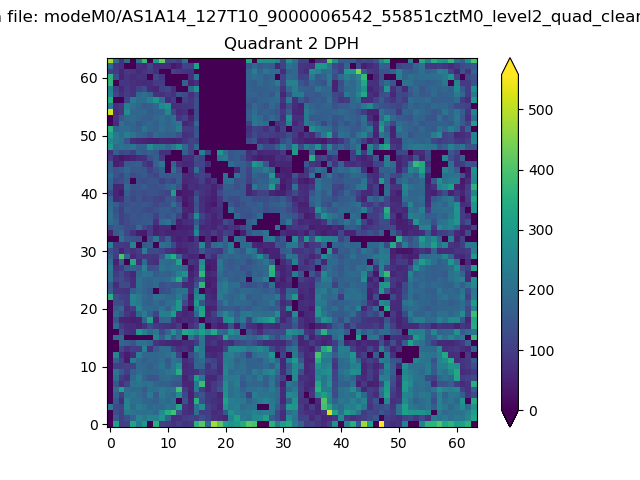 |
Quadrant C |
| Plot type | Count rate plots | Images |
|---|---|---|
| Comparison with Poisson distribution Blue bars denote a histogram of data divided into 1 sec bins. Red curve is a Poisson curve with rate = median count rate of data. |
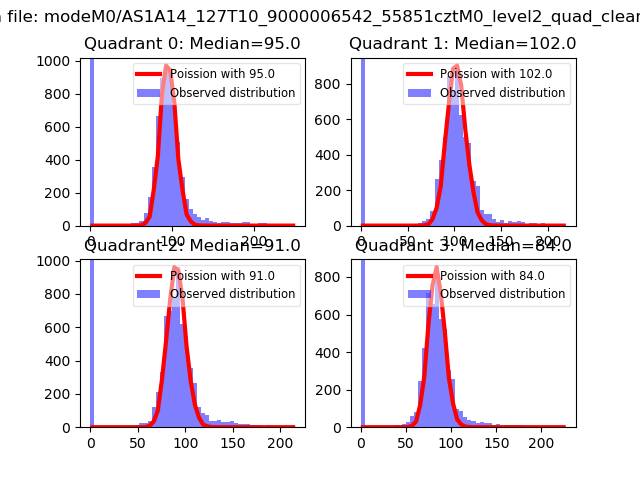 |
 |
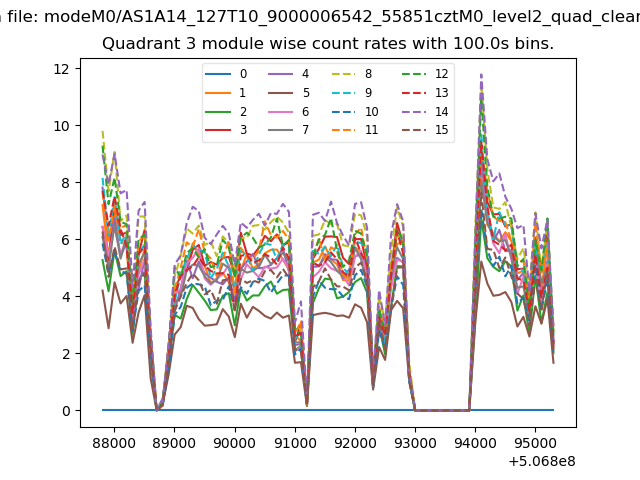
| Quadrant-wise count rates Data is divided into 100 sec bins |
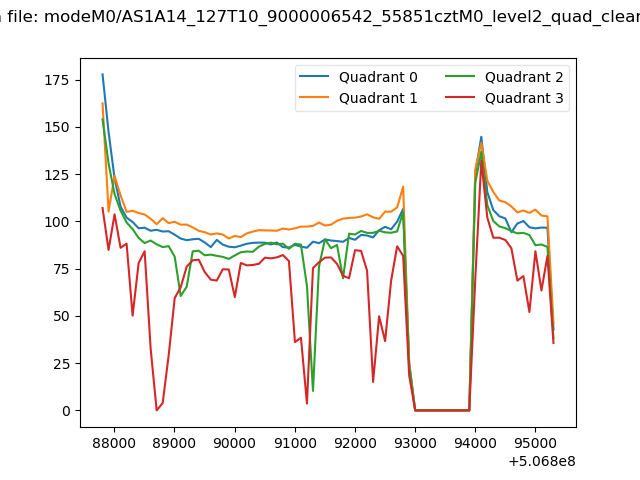 |
|
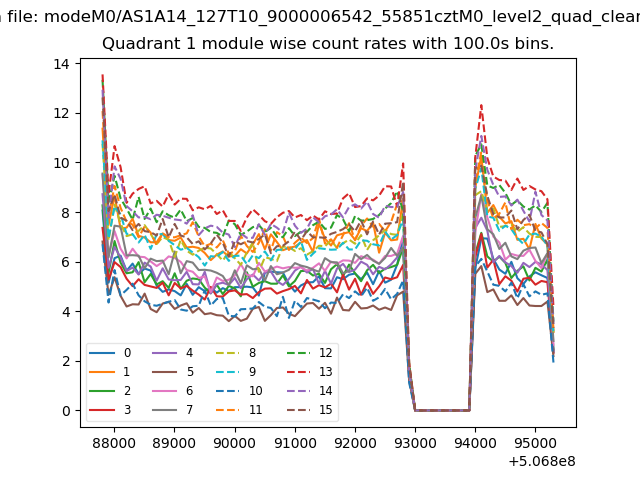
| Module-wise count rates for Quadrant A Data is divided into 100 sec bins |
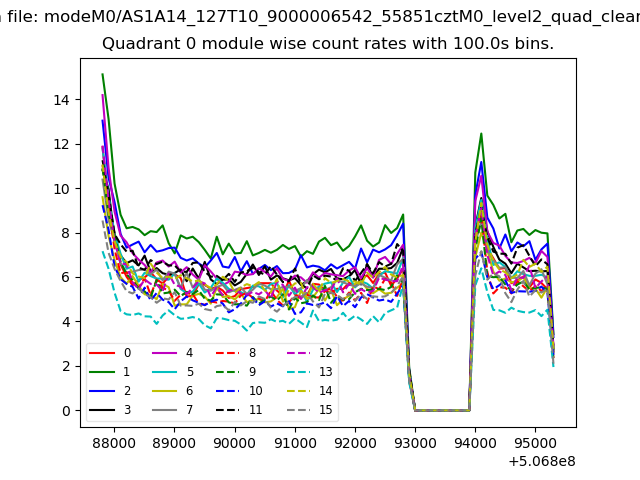 |
 |
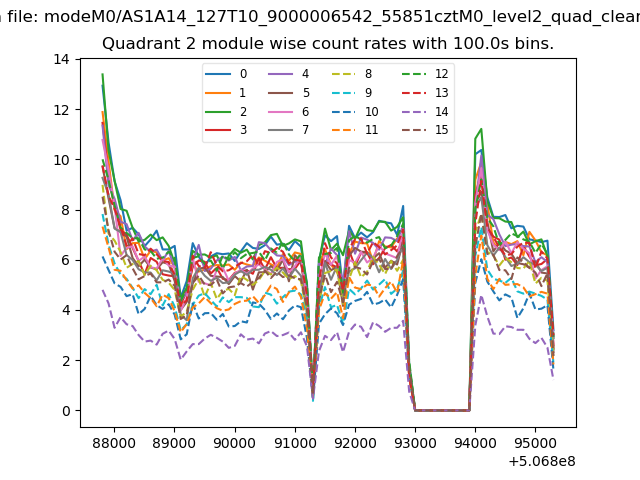
| Module-wise count rates for Quadrant B Data is divided into 100 sec bins |
 |
 |
| Module-wise count rates for Quadrant C Data is divided into 100 sec bins |
 |
 |
| Module-wise count rates for Quadrant D Data is divided into 100 sec bins |
 |
 |
| Parameter | Plot |
|---|---|
| CZT HV Monitor | 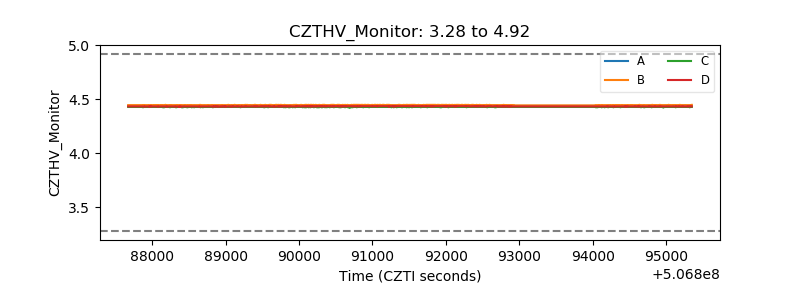 |
| D_VDD | 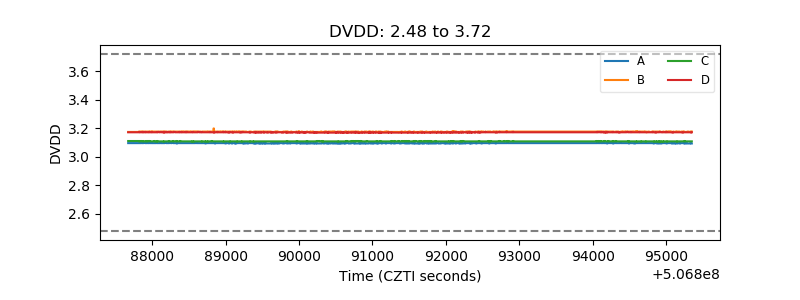 |
| Temperature 1 | 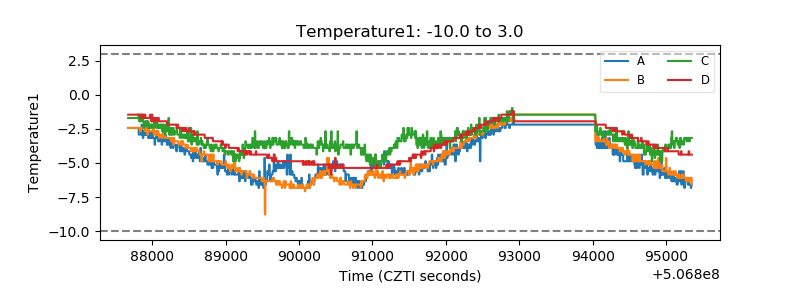 |
| Veto HV Monitor | 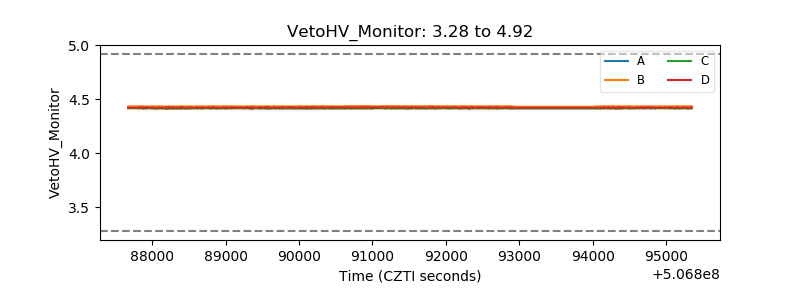 |
| Veto LLD | 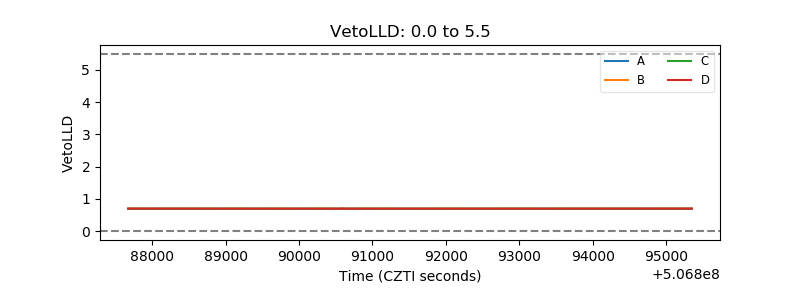 |
| Alpha Counter | 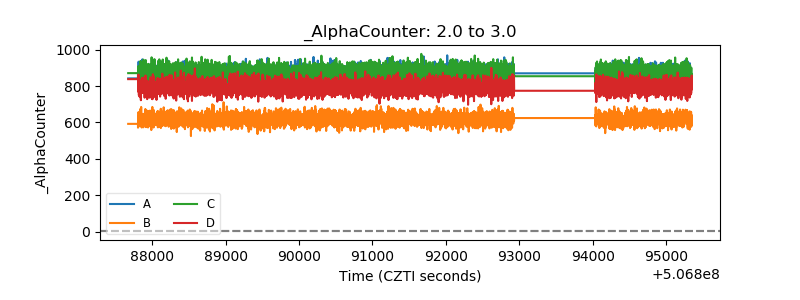 |
| _CPM_Rate | 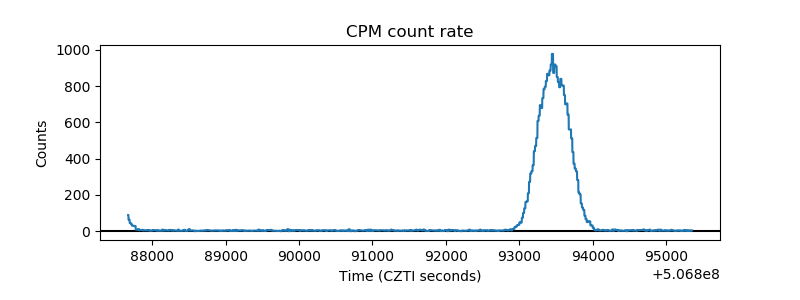 |
| CZT Counter | 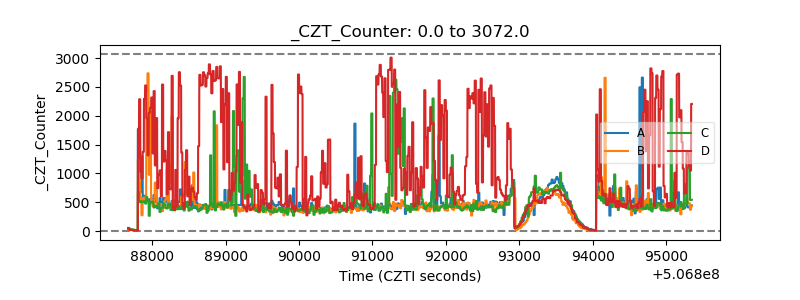 |
| +2.5 Volts monitor |  |
| +5 Volts monitor |  |
| _ROLL_ROT | 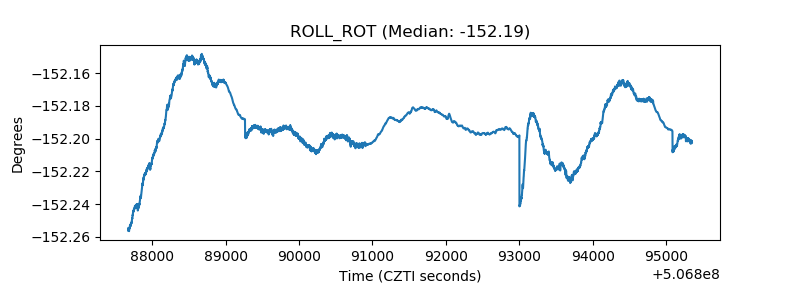 |
| _Roll_DEC | 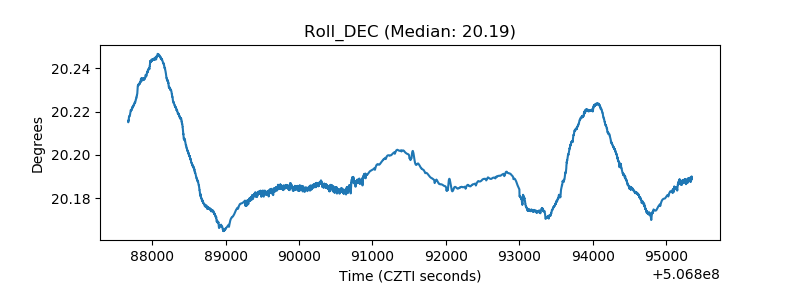 |
| _Roll_RA | 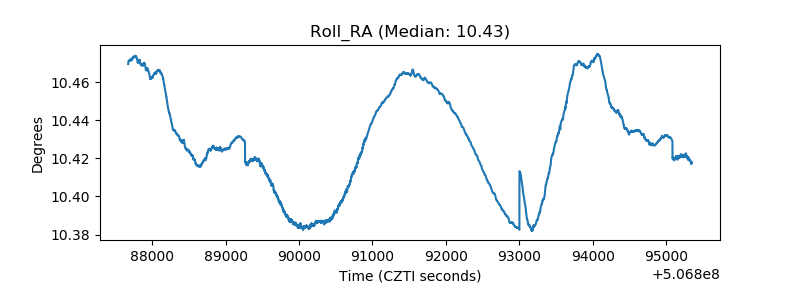 |
| Veto Counter | 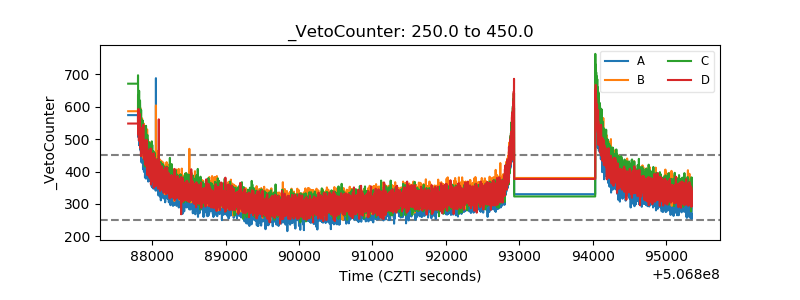 |